The ACS LCID Project. II. Faint Variable Stars
in the Isolated Dwarf Irregular Galaxy IC 161311affiliation: Based on observations made with the NASA/ESA Hubble Space
Telescope, obtained at the Space Telescope Science Institute, which is
operated by the Association of Universities for Research in Astronomy,
Inc., under NASA contract NAS5-26555. These observations are associated
with program 10505.
Abstract
We present the results of a new search for variable stars in the Local Group (LG) isolated dwarf galaxy IC 1613, based on 24 orbits of F475W and F814W photometry from the Advanced Camera for Surveys onboard the Hubble Space Telescope. We detected 259 candidate variables in this field, of which only 13 (all of them bright Cepheids) were previously known. Out of the confirmed variables, we found 90 RR Lyrae stars, 49 classical Cepheids (including 36 new discoveries), and 38 eclipsing binary stars for which we could determine a period. The RR Lyrae include 61 fundamental (RR) and 24 first-overtone (RR) pulsators, and 5 pulsating in both modes simultaneously (RR). As for the majority of LG dwarfs, the mean periods of the RR and RR (0.611 and 0.334 day, respectively) as well as the fraction of overtone pulsators (fc=0.28) place this galaxy in the intermediate regime between the Oosterhoff types. From their position on the period-luminosity diagram and light-curve morphology, we can unambiguously classify 25 and 14 Cepheids as fundamental and first-overtone mode pulsators, respectively. Another two are clearly second-overtone Cepheids, the first ones to be discovered beyond the Magellanic Clouds. Among the remaining candidate variables, five were classified as -Scuti and five as long-period variables. Most of the others are located on the main-sequence, the majority of them likely eclipsing binary systems, although some present variations similar to pulsating stars. We estimate the distance to IC 1613 using various methods based on the photometric and pulsational properties of the Cepheids and RR Lyrae stars. The values we find are in very good agreement with each other and with previous estimates based on independent methods. When corrected to a common reddening of E(BV)=0.025 and true LMC distance modulus of (mM)LMC,0=18.5150.085, we find that all the distance determinations from the literature converge to a common value of (mM)0=24.4000.014 (statistical), or 760 kpc. The parallel WFPC2 field, which lies within three core radii, was also searched for variable stars. We discovered nine RR Lyrae stars (4 RR, 4 RR and 1 RR) and two Cepheids, even though the lower signal-to-noise ratio of the observations did not allow us to measure their periods as accurately as for the variables in the ACS field-of-view. We provide their coordinates and approximate properties for completeness.
Subject headings:
binaries: eclipsing — galaxies: dwarf — galaxies: individual (IC 1613) — Local Group — stars: variables: Cepheids — stars: variables: RR Lyrae1. Introduction
The search for variable stars in IC 1613 started at the beginning of the 1930’s with the seminal work of Baade, Hubble, and Mayall, although it was published only later in Sandage (1971). The discovery of 37 definite Cepheids allowed Baade to calculate the first distance to IC 1613 based on the period-luminosity (PL) relation. The analysis of the faint Cepheids in the same photographic plates was completed by Carlson & Sandage (1990) and the PL relation extended to periods as short as about two days. Candidate RR Lyrae stars were also observed in IC 1613 from ground- (Saha et al., 1992) and space-based imaging (Dolphin et al., 2001), confirming the presence of a bona fide old population. More recent surveys by Mantegazza et al. (2001, and references therein) and the OGLE collaboration (Udalski et al., 2001) of a central 14x14 field led to the discovery of 128 and 138 Cepheids, respectively, although the small size of the telescopes used by both groups limited the sample to relatively bright, long-period Cepheids. While all the Cepheids with periods longer than about 10 days in IC 1613 have most likely been discovered, very few have been found at the faint end of the PL relation (e.g., Dolphin et al., 2001).
Here we present the analysis of very deep Hubble Space Telescope (HST) ACS data with the aim of searching for short-period variable stars. These data are part of a larger set obtained in the context of the LCID project999Local Cosmology from Isolated Dwarfs: http://www.iac.es/project/LCID/. (C. Gallart et al. 2010, in preparation). The depth and quality of the data also allow the reconstruction of the full star formation history (SFH) of this field located just outside of the core radius. The study of the stellar populations and SFH from the color-magnitude diagram (CMD) fitting technique will be presented in a companion paper (E. Skillman et al. 2010, in preparation).
The structure of the present paper follows closely that of Bernard et al. (2009, hereafter Paper I) in which we analysed the properties of the variables in the dSph galaxies Cetus and Tucana. A summary of the observations and data reduction is presented in § 2, while § 3 and § 4 deal with the identification of variable stars and the sample completeness, respectively. In § 5 we describe the sample of RR Lyrae stars and the Cepheids are presented in § 6. The eclipsing binaries and other candidate variables are presented in § 7 to 9. Our list of variables is cross-identified with the previous catalogs covering this field in § 10. In § 11 we use the properties of the RR Lyrae stars and Cepheids to estimate the distance to IC 1613 and compare it with the values of the literature. In the last section we discuss the results and present our conclusions.
| Date | UT Start | MHJDaaModified Heliocentric Julian Date of mid-exposure: HJD2,400,000. | Filter | Exp. Time |
|---|---|---|---|---|
| 2006 Aug 18 | 06:59:48 | 53965.304727 | F475W | 1325 |
| 2006 Aug 18 | 07:24:48 | 53965.320827 | F814W | 1106 |
| 2006 Aug 18 | 08:35:20 | 53965.370932 | F475W | 1300 |
| 2006 Aug 18 | 08:59:55 | 53965.387147 | F814W | 1153 |
| 2006 Aug 18 | 10:11:37 | 53965.437935 | F475W | 1324 |
| 2006 Aug 18 | 10:36:36 | 53965.454023 | F814W | 1107 |
| 2006 Aug 18 | 11:47:09 | 53965.504139 | F475W | 1300 |
| 2006 Aug 18 | 12:11:44 | 53965.520354 | F814W | 1153 |
| 2006 Aug 18 | 13:23:26 | 53965.571142 | F475W | 1324 |
| 2006 Aug 18 | 13:48:25 | 53965.587230 | F814W | 1107 |
| 2006 Aug 18 | 14:58:58 | 53965.637346 | F475W | 1300 |
| 2006 Aug 18 | 15:23:33 | 53965.653565 | F814W | 1153 |
| 2006 Aug 18 | 16:35:15 | 53965.704349 | F475W | 1324 |
| 2006 Aug 18 | 17:00:14 | 53965.720437 | F814W | 1107 |
| 2006 Aug 18 | 18:10:47 | 53965.770553 | F475W | 1300 |
| 2006 Aug 18 | 18:35:22 | 53965.786769 | F814W | 1153 |
| 2006 Aug 19 | 06:58:25 | 53966.303776 | F475W | 1324 |
| 2006 Aug 19 | 07:23:24 | 53966.319864 | F814W | 1107 |
| 2006 Aug 19 | 08:33:57 | 53966.369980 | F475W | 1300 |
| 2006 Aug 19 | 08:58:32 | 53966.386197 | F814W | 1153 |
| 2006 Aug 19 | 10:10:14 | 53966.436983 | F475W | 1324 |
| 2006 Aug 19 | 10:35:13 | 53966.453071 | F814W | 1107 |
| 2006 Aug 19 | 11:45:46 | 53966.503187 | F475W | 1300 |
| 2006 Aug 19 | 12:10:21 | 53966.519403 | F814W | 1153 |
| 2006 Aug 19 | 13:22:02 | 53966.570179 | F475W | 1324 |
| 2006 Aug 19 | 13:47:02 | 53966.586278 | F814W | 1107 |
| 2006 Aug 19 | 14:57:34 | 53966.636383 | F475W | 1300 |
| 2006 Aug 19 | 15:22:10 | 53966.652610 | F814W | 1153 |
| 2006 Aug 19 | 16:33:52 | 53966.703397 | F475W | 1324 |
| 2006 Aug 19 | 16:58:51 | 53966.719486 | F814W | 1107 |
| 2006 Aug 19 | 18:09:24 | 53966.769602 | F475W | 1300 |
| 2006 Aug 19 | 18:33:59 | 53966.785817 | F814W | 1153 |
| 2006 Aug 20 | 05:21:08 | 53967.236226 | F475W | 1324 |
| 2006 Aug 20 | 05:46:07 | 53967.252314 | F814W | 1107 |
| 2006 Aug 20 | 06:56:41 | 53967.302442 | F475W | 1300 |
| 2006 Aug 20 | 07:21:16 | 53967.318658 | F814W | 1153 |
| 2006 Aug 20 | 08:32:57 | 53967.369434 | F475W | 1324 |
| 2006 Aug 20 | 08:57:56 | 53967.385520 | F814W | 1107 |
| 2006 Aug 20 | 10:08:30 | 53967.435649 | F475W | 1300 |
| 2006 Aug 20 | 10:33:05 | 53967.451865 | F814W | 1153 |
| 2006 Aug 20 | 11:44:46 | 53967.502641 | F475W | 1324 |
| 2006 Aug 20 | 12:09:45 | 53967.518729 | F814W | 1107 |
| 2006 Aug 20 | 13:20:19 | 53967.568857 | F475W | 1300 |
| 2006 Aug 20 | 13:44:54 | 53967.585072 | F814W | 1153 |
| 2006 Aug 20 | 14:56:35 | 53967.635848 | F475W | 1324 |
| 2006 Aug 20 | 15:21:34 | 53967.651936 | F814W | 1107 |
| 2006 Aug 20 | 16:32:08 | 53967.702064 | F475W | 1300 |
| 2006 Aug 20 | 16:56:43 | 53967.718279 | F814W | 1153 |
2. Observations and Data Reduction
2.1. Primary ACS Imaging
This work is based on observations obtained with the ACS onboard the HST of a field located about 5 West of the center of IC 1613. The field location was chosen to be far enough out in radius to minimize crowding effects for high quality photometry, yet close enough in to maximize the total number of stars observed. As the goal of these observations was to reach the oldest main sequence turn-offs with good photometric accuracy, 24 HST orbits were devoted to this galaxy. These were collected over about 2.4 consecutive days between 2006 August 28 and 30. Each orbit was split in two 1200 seconds exposures in F475W and F814W for an optimal sampling of the light curves. The complete observing log is presented in Table 1.
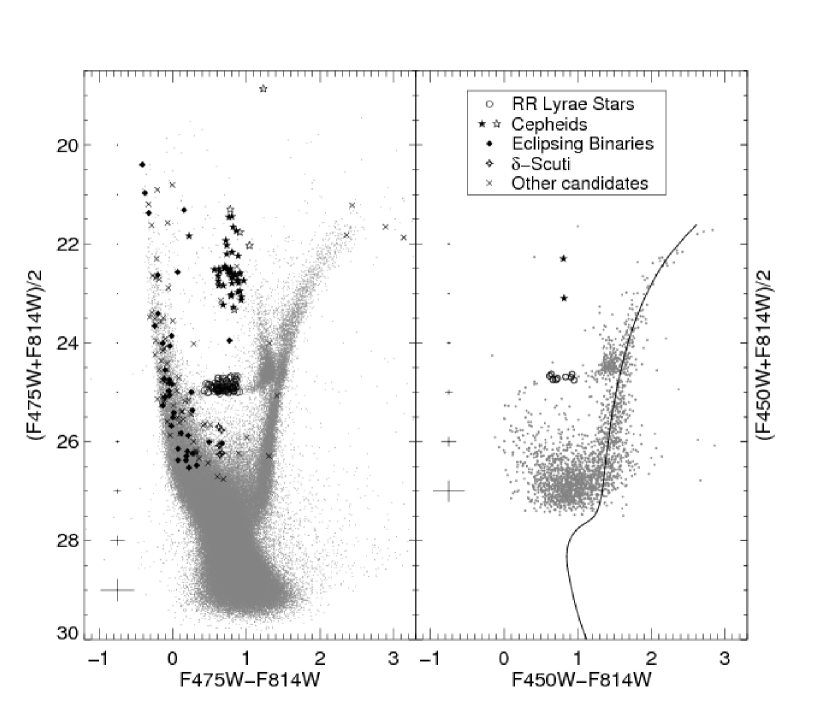
The DAOPHOT/ALLFRAME suite of programs (Stetson, 1994) was used to obtain the instrumental photometry of the stars on the individual, non-drizzled images provided by the HST pipeline. Additionally, we used the pixel area maps and data quality masks to correct for the variations of the pixel areas on the sky around the field and to flag bad pixels. Standard calibration was carried out as described in Sirianni et al. (2005), taking into account the updated zero-points of Mack et al. (2007) following the lowering of the Wide Field Channel temperature setpoint in July 2006. We refer the reader to Monelli et al. (2010) for a detailed description of the data reduction and calibration. The final CMD is presented in Fig. 1 (left panel), where the filter combination was chosen for the ordinate axis so that the horizontal-branch (HB) appears approximately horizontal.
The light-curves of the Cepheids and RR Lyrae stars were converted to Johnson BVI magnitudes using the transformations given in Paper I. Since 12 of our Cepheids were also observed by the OGLE team in V and I (see § 10), we could check the accuracy of our transformations. Ten out of the 12 stars in common have well sampled light-curves and accurately determined periods, although 6 of these only have V observations in the OGLE database because of their relatively low luminosities.
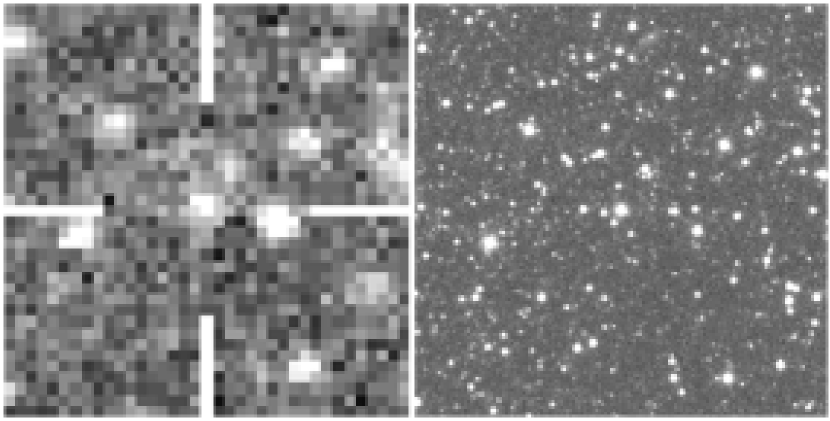
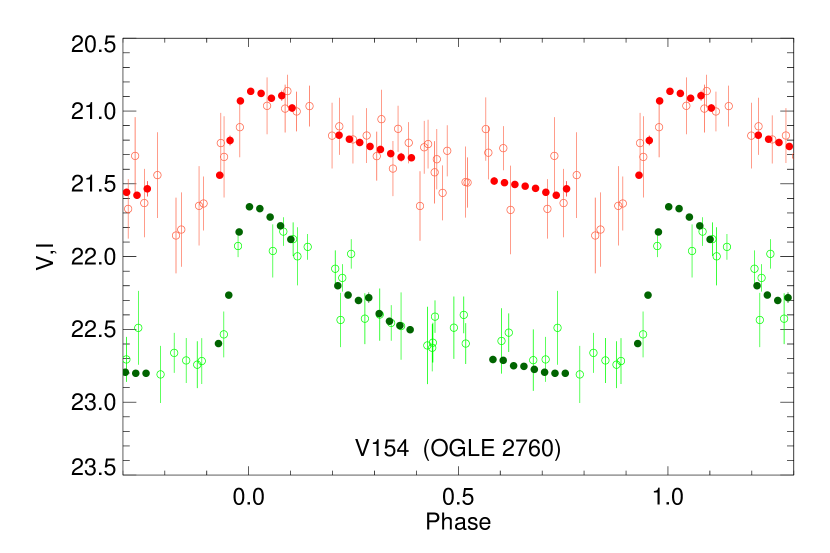
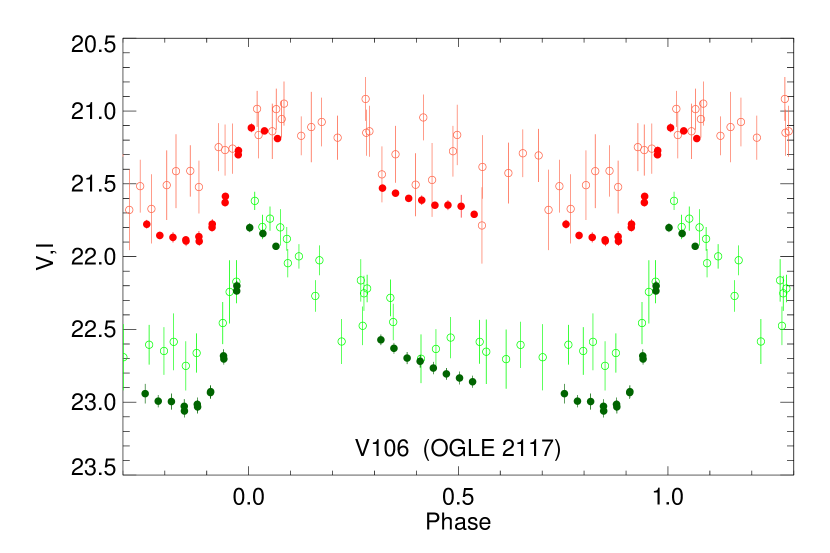
We find excellent agreement at all phases between the two photometry sets for 7 of the 10 usable stars. The remaining three present a shift in magnitude which ranges from 0.1 at maximum light to 0.5 for the faintest points. The comparison of the finding charts shows that this difference is due to contamination by nearby bright stars that are not resolved in the ground-based data. To illustrate this, in Fig. 2 we compare the finding-charts and photometry of the OGLE database with ours for two Cepheids (V106 and V154). For each Cepheid, we show 15x15 stamps from the OGLE I-band and our F814W images, as well as the V and I light-curves from both photometries. While both Cepheids are located in rather crowded fields, the stars close to V154 are relatively faint compared to the Cepheid. The ground-based and HST light-curves are therefore overlapping perfectly. On the other hand, in the case of V106 the neighbours have a luminosity similar to that of the Cepheid, thus affecting the mean magnitude and amplitude of the OGLE light-curve.
This test shows that our photometry in the Johnson bands, although transformed from a very different photometric system, is very reliable and can be safely used to analyse the properties of the variable stars, both in terms of magnitude and amplitude. This is emphasized in § 11 where the distance to IC 1613 is calculated from Johnson luminosities and for which we find excellent agreement with previous measurements based on other methods.
| MHJDaaModified Heliocentric Julian Date of mid-exposure: HJD2,400,000. | MHJDaaModified Heliocentric Julian Date of mid-exposure: HJD2,400,000. | ||||
|---|---|---|---|---|---|
| V001 | |||||
| 53965.304727 | 24.978 | 0.036 | 53965.320827 | 24.420 | 0.026 |
| 53965.370932 | 25.216 | 0.043 | 53965.387147 | 24.410 | 0.039 |
| 53965.437935 | 25.356 | 0.035 | 53965.454023 | 24.583 | 0.030 |
| 53965.504139 | 25.500 | 0.038 | 53965.520354 | 24.634 | 0.042 |
| 53965.571142 | 25.562 | 0.033 | 53965.587230 | 24.669 | 0.052 |
Note. — Table 2 is published in its entirety in the electronic edition of The Astrophysical Journal. A portion is shown here for guidance regarding its form and content.
2.2. Parallel WFPC2 Imaging
| MHJDaaModified Heliocentric Julian Date of mid-exposure: HJD2,400,000. | MHJDaaModified Heliocentric Julian Date of mid-exposure: HJD2,400,000. | MHJDaaModified Heliocentric Julian Date of mid-exposure: HJD2,400,000. | ||||||
|---|---|---|---|---|---|---|---|---|
| V001 | ||||||||
| 53965.304727 | 25.054 | 0.036 | 53965.312777 | 24.789 | 0.036 | 53965.320827 | 24.403 | 0.026 |
| 53965.370932 | 25.337 | 0.043 | 53965.379040 | 24.939 | 0.043 | 53965.387147 | 24.392 | 0.039 |
| 53965.437935 | 25.471 | 0.035 | 53965.445979 | 25.090 | 0.035 | 53965.454023 | 24.565 | 0.030 |
| 53965.504139 | 25.633 | 0.038 | 53965.512247 | 25.202 | 0.038 | 53965.520354 | 24.618 | 0.042 |
| 53965.571142 | 25.701 | 0.033 | 53965.579186 | 25.255 | 0.033 | 53965.587230 | 24.654 | 0.052 |
Note. — Table 3 is published in its entirety in the electronic edition of The Astrophysical Journal. A portion is shown here for guidance regarding its form and content.
| R.A. | Decl. | Period | ||||||||||||||
|---|---|---|---|---|---|---|---|---|---|---|---|---|---|---|---|---|
| ID | Type | (J2000) | (J2000) | (days) | log P | |||||||||||
| V001 | 01 04 20.90 | 02 10 36.8 | 0.592 | 0.228 | 25.272 | 1.170 | 24.562 | 0.555 | 0.710 | 25.374 | 1.280 | 25.037 | 0.890 | 24.545 | 0.558 | |
| V002 | 01 04 20.96 | 02 10 27.4 | 0.425 | 0.372 | 25.076 | 0.465 | 24.459 | 0.239 | 0.618 | 25.163 | 0.508 | 24.866 | 0.381 | 24.442 | 0.237 | |
| V003 | EB | 01 04 20.99 | 02 09 41.6 | 2.900 | 0.462 | 24.341 | 0.168 | 23.572 | 0.107 | 0.769 | 24.449 | 0.254 | 24.073 | 0.169 | 23.549 | 0.146 |
| V004 | 01 04 22.03 | 02 09 10.7 | 0.314 | 0.503 | 25.051 | 0.361 | 24.595 | 0.167 | 0.455 | 25.110 | 0.390 | 24.898 | 0.287 | 24.583 | 0.163 | |
| V005 | 01 04 22.10 | 02 09 13.1 | 0.484 | 0.315 | 25.237 | 0.978 | 24.616 | 0.544 | 0.621 | 25.347 | 1.111 | 24.995 | 0.809 | 24.599 | 0.541 |
Note. — Table 4 is published in its entirety in the electronic edition of The Astrophysical Journal. A portion is shown here for guidance regarding its form and content.
IC 1613 was also observed with the WFPC2 in the F450W and F814W bands as parallel exposures to the primary ACS observations. This provided the opportunity to analyze a second field with the same number of observations and a similar exposure time. The orientation of the ACS field was chosen such that the parallel WFPC2 field would sample a region further from the center of the galaxy (11) in order to study population gradients. The images from the Wide Field chips were reduced individually as described in Turner (1997), and calibrated following the instructions from the HST Data Handbook for WFPC2.101010http://www.stsci.edu/instruments/wfpc2/Wfpc2_dhb/wfpc2_ ch52.html Given the small number of stars on the Planetary Camera, the photometry of this chip was performed on the stacked images only. The resulting CMD for the whole WFPC2 field-of-view is shown in the right panel of Fig. 1, where a 13 Gyr old isochrone from the BaSTI library (Pietrinferni et al., 2004) has been overplotted assuming =0.123 and =0.056 (Schlegel et al., 1998) for the F450W and F814W bands, respectively, and a dereddened distance modulus of 24.40 (see § 11.3).
Unfortunately, due to the lower sensitivity of the instrument with respect to the ACS, especially in the F450W band, the CMD does not reach the oldest main-sequence turn-offs. However, the lack of bright main-sequence stars in this outer field reveals the presence of a blue horizontal-branch component, typical of old, low metallicity stellar populations.
3. Identification of Variable Stars
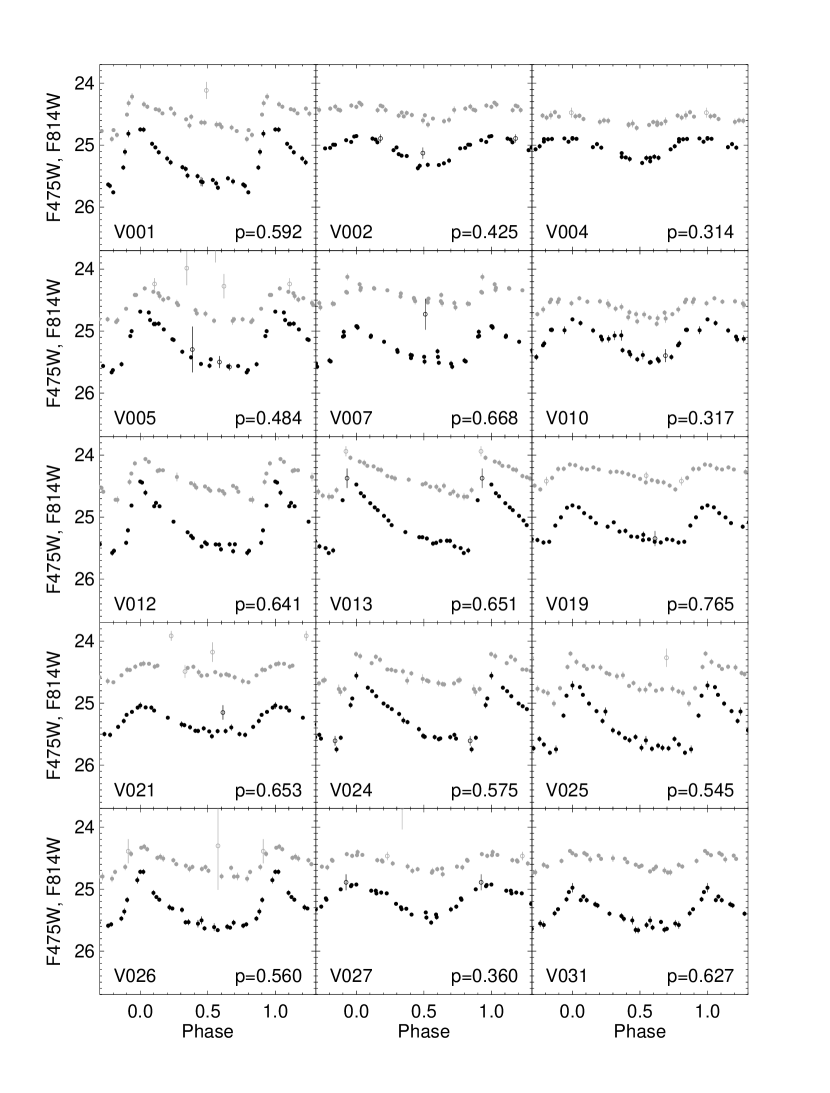
The candidate variables were extracted from the photometric catalogs using the variability index of Welch & Stetson (1993). This process yielded 780 candidates in the primary field. A preliminary check of the light-curve and position on the CMD, together with a careful inspection of the stacked image, allowed us to discard false detections due to cosmic-ray hits, chip defects or stars located under the wings of bright stars. This left us with 259 candidates; these are shown in Fig. 1 overplotted on the CMD using their intensity-averaged magnitudes when available (see below). The individual F475W and F814W measurements for all of the candidate variables are listed in Table 2, while the transformed BVI magnitudes are given in Table 3.
The period search was performed on the suspected variables through Fourier analysis (Horne & Baliunas, 1986) taking into account the information from both bands simultaneously, then refined interactively by modifying the period until a tighter light curve was obtained. For each variable, datapoints with error bars larger than 3- above the mean error bar size were rejected through sigma clipping with five iterations. As the period-finding program is interactive, it was possible to selectively reject more or less datapoints depending on the light curve quality before recalculating the periodogram. However, except in few particular cases, we found that the period-search was not affected by a few bad points. Given the short timebase of the observations (3 days), the periods are given with three significant figures only. The accuracy of period determination was estimated from the degradation of the quality of the light curves when applying small period offsets. It mainly depends on the period itself and on the time interval covered by observations, and ranges from about 0.001 day for the shorter period RR Lyrae stars to few hundredths of a day for the longest period Cepheids.
The classification of the candidates was based on their light-curve morphology and position in the CMD. We found 90 RR Lyrae stars, 49 Cepheids, 38 eclipsing binaries, and five candidate -Scuti stars. A significant number of variable candidates was also found along the main sequence. For most of these, however, we could not find a period that would produce a smooth light-curve. In the following, we will simply refer to these variables as main-sequences variables (MSV), although most of them are probably eclipsing binaries.
To obtain the amplitudes and intensity-averaged magnitudes of the monoperiodic variables in the instability strip, we fitted the light-curves with a set of templates based on the set of Layden et al. (1999, see Paper I). The amplitudes of the double-mode RR Lyrae stars were measured from a low-order Fourier fit to the light-curve phased with the primary period after prewhitening of the secondary period. The mean magnitude and color of the variables for which we could not find a period are weighted averages from the ALLFRAME photometry and are therefore only approximate. Table 4 summarizes the properties of the confirmed variable stars in the ACS field. The first two columns give the identification number and type of variability, while the next two list the equatorial coordinates (J2000.0). Columns (5) and (6) give the primary period in days, i.e., the first-overtone period in the case of the RR, and the logarithm of this period. The intensity-averaged magnitudes and , and color are given in columns (7), (9), and (11). The amplitudes in the F475W and F814W bands measured from the template fits are listed in the eighth and tenth columns. The last six columns alternately list the intensity-averaged magnitudes and amplitudes in the Johnson B, V, and I bands. Approximate values are listed in italics. A list of the remaining candidates, providing the coordinates and approximate magnitudes, is given in Table 5. They are labeled as MSV, long-period variables (LPV), classical instability strip variables (ISV), and RGB variables (RGV) based on their location on the CMD.
The same procedure was followed with the WFPC2 photometry, in which we found 11 variables: nine RR Lyrae stars and two Cepheids. However, the low signal-to-noise of the individual measurements produced rather noisy light-curves, and some low amplitude variables might have been missed. Given the small number of variables in the parallel field and the generally lower quality of their photometry and inferred parameters, we only give their coordinates and approximate parameters in Table 6 for completeness. These variables will not be taken into account when calculating average properties of the IC 1613 variable star population.
| R.A. | Decl. | ||||
|---|---|---|---|---|---|
| ID | Type | (J2000) | (J2000) | ||
| VC194 | MSV | 01 04 20.27 | 02 10 28.6 | 25.272 | 25.261 |
| VC195 | RGV | 01 04 20.62 | 02 10 01.1 | 25.777 | 24.361 |
| VC196 | MSV | 01 04 22.63 | 02 09 53.7 | 26.401 | 26.078 |
| VC197 | MSV | 01 04 23.08 | 02 08 06.6 | 26.680 | 25.784 |
| VC198 | MSV | 01 04 23.24 | 02 08 33.6 | 24.092 | 24.221 |
Note. — Table 5 is published in its entirety in the electronic edition of The Astrophysical Journal. A portion is shown here for guidance regarding its form and content.
| R.A. | Decl. | Period | ||||||||
|---|---|---|---|---|---|---|---|---|---|---|
| ID | Type | (J2000) | (J2000) | (days) | log P | |||||
| V183 | 01 04 04.90 | 02 13 44.9 | 0.34 | 0.46 | 25.178 | 24.446 | 0.732 | 0.463 | 0.146 | |
| V184 | 01 04 05.05 | 02 13 11.0 | 0.36 | 0.44 | 24.955 | 24.313 | 0.642 | 0.520 | 0.299 | |
| V185 | 01 04 05.20 | 02 13 32.7 | 0.56 | 0.25 | 25.150 | 24.240 | 0.910 | 1.168 | 0.551 | |
| V186 | 01 04 05.29 | 02 11 01.7 | 0.35 | 0.46 | 25.107 | 24.272 | 0.834 | 0.510 | 0.234 | |
| V187 | 01 04 07.61 | 02 13 00.8 | 0.55 | 0.26 | 25.096 | 24.393 | 0.703 | 1.615 | 0.565 | |
| V188 | 01 04 07.99 | 02 11 32.5 | 0.65 | 0.19 | 25.097 | 24.174 | 0.924 | 0.794 | 0.409 | |
| V189 | 01 04 08.65 | 02 11 11.0 | 0.60 | 0.22 | 25.228 | 24.279 | 0.949 | 0.773 | 0.296 | |
| V190 | Cep | 01 04 10.25 | 02 13 06.9 | 0.67 | 0.17 | 23.507 | 22.693 | 0.813 | 0.664 | 0.401 |
| V191 | 01 04 10.32 | 02 12 50.9 | 0.33 | 0.48 | 24.979 | 24.359 | 0.619 | 0.624 | 0.344 | |
| V192 | Cep | 01 04 10.40 | 02 12 03.7 | 1.30 | 0.11 | 22.701 | 21.896 | 0.805 | 0.657 | 0.285 |
| V193 | 01 04 10.97 | 02 12 08.1 | 0.36 | 0.44 | 25.072 | 24.411 | 0.661 | 0.516 | 0.276 |
4. Completeness and Areal Coverage
In this section, we analyze the effects of stellar crowding and signal-to-noise (SNR) limitations, temporal sampling, and spatial coverage on the completeness of our Cepheids and RR Lyrae stars samples.
The high spatial resolution of the ACS and the depth of our data imply that incompleteness will become noticeable well below the HB. Artificial-star tests (E. Skillman et al. 2010, in preparation) indicate that the completeness is higher than 98% at (F475W+F814W)/2 25.0. Therefore, down to these magnitudes only variables with amplitude of the order of the error bars at this magnitude (0.1) might have been missed. However, variables fainter than the HB (e.g., SX Phoenicis and/or -Scuti) have probably been missed due to crowding and low SNR. In addition, even though these variables are present in this galaxy (see § 8), the relatively long exposure time smoothing out the variations in luminosity and the rather slow temporal sampling hampered the detection of these short-period variables.
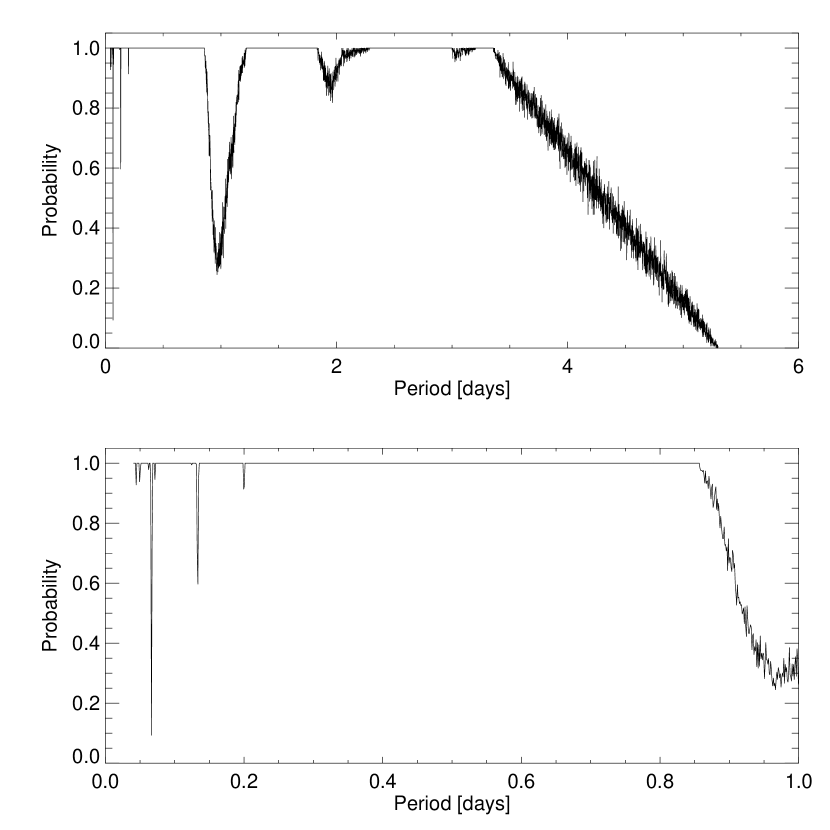
We also estimate the completeness due to temporal sampling by carrying out numerical simulations in the same way as described in Paper I. The detection probability is presented in Fig. 3. In the upper panel, the maximum period that is displayed is limited by the observational timebase (3 days). Note that even though it is possible to detect variable stars with periods longer than the observation time-base, it is not feasible to determine their periods. The Figure also shows that the probability to detect a variable star in the period range of RR Lyrae stars ( 0.2–0.8 day) is basically one. On the other hand, a significant dip is present at P1 day, due to the observations being gathered at the same time of the day each day. While it might not prevent detecting variables at this period (most likely Cepheids) if their amplitude is larger than about 0.1, it seriously limits our capacity to find an accurate period (e.g., V150 in Fig. 8, V030 in § 6.4).
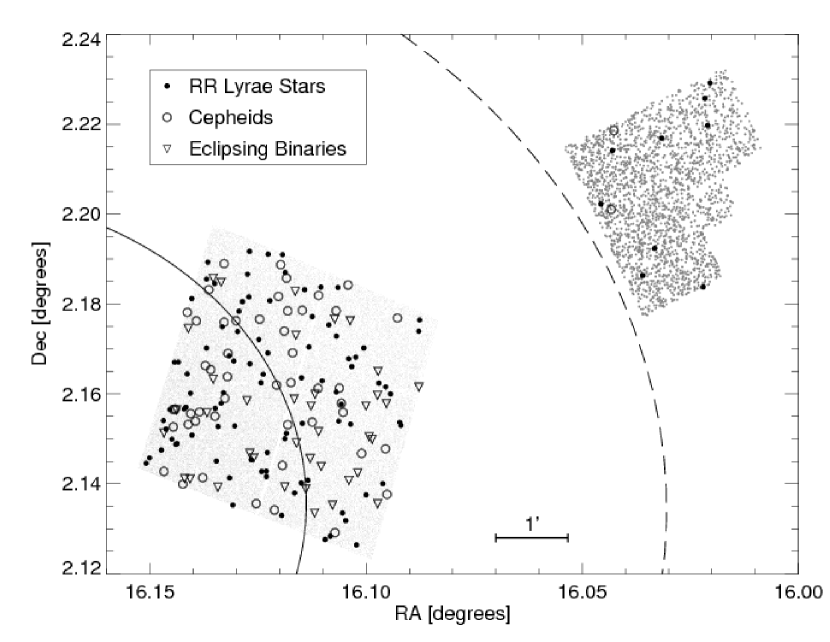
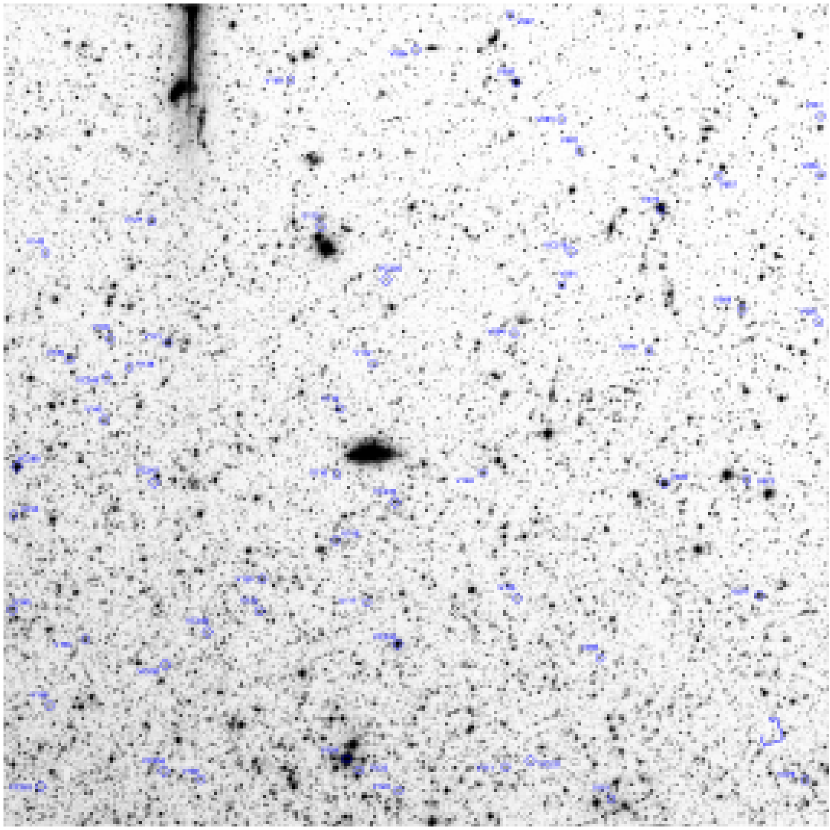
As expected from the large extent of the galaxy compared to the field-of-view of the ACS, the main factor preventing us from obtaining a complete census of RR Lyrae stars and Cepheids in IC 1613 is the spatial coverage. Figure 4 shows the distribution of stars from our ACS and WFPC2 fields on top of ellipses representing the core radius (, Battinelli et al., 2007) and twice the core radius. Battinelli et al. (2007) estimated a tidal radius of , ellipticity , and position angle of 87, in good agreement with the values found by Bernard et al. (2007, , ). Thus, the ACS field covers only about 1/160th of the area within the tidal radius. If we assume that the distribution of variable stars follows that of the overall population, we can estimate the total number of RR Lyrae stars and Cepheids within the tidal radius as described in Paper I. Basically, we adopt the shape and orientation of the isodensity contours from Battinelli et al. (2007) to divide our sample of variable stars into elliptical annuli. The area of these annuli was obtained through Monte-Carlo sampling, from which we could calculate the density profile of the variable stars. Using this profile with the core and tidal radii of Battinelli et al. (2007) as input to equation (21) of King (1962), we estimate that there should be about 2100 RR Lyrae stars and 1400 Cepheids within the tidal radius of IC 1613. Therefore, our ACS sample represents about 4% of the total number of RR Lyrae stars and Cepheids.
5. RR Lyrae stars
5.1. ACS sample
In our ACS field we detected 90 RR Lyrae stars, all of them new discoveries (see § 5.3). From the periods and light-curve shapes, we identified 61 of them pulsating in the fundamental mode (RR), 24 in the first-overtone mode (RR), and five in both modes simultaneously (RR). The light curves of all the RR Lyrae stars are shown in Fig. 5.
We find the mean period of the RR and RR to be 0.611 and 0.334 day, respectively. These values, as well as the fraction of first-overtone , place IC 1613 in the gap between the Oosterhoff type I and type II groups (Oo-I and Oo-II). IC 1613 therefore joins the majority of dwarf galaxies in the Local Group as an Oosterhoff intermediate galaxy, the only real exceptions among the dSphs with well-sampled HB to date being Ursa Minor (Nemec et al., 1988) and Boötes (Dall’Ora et al., 2006).
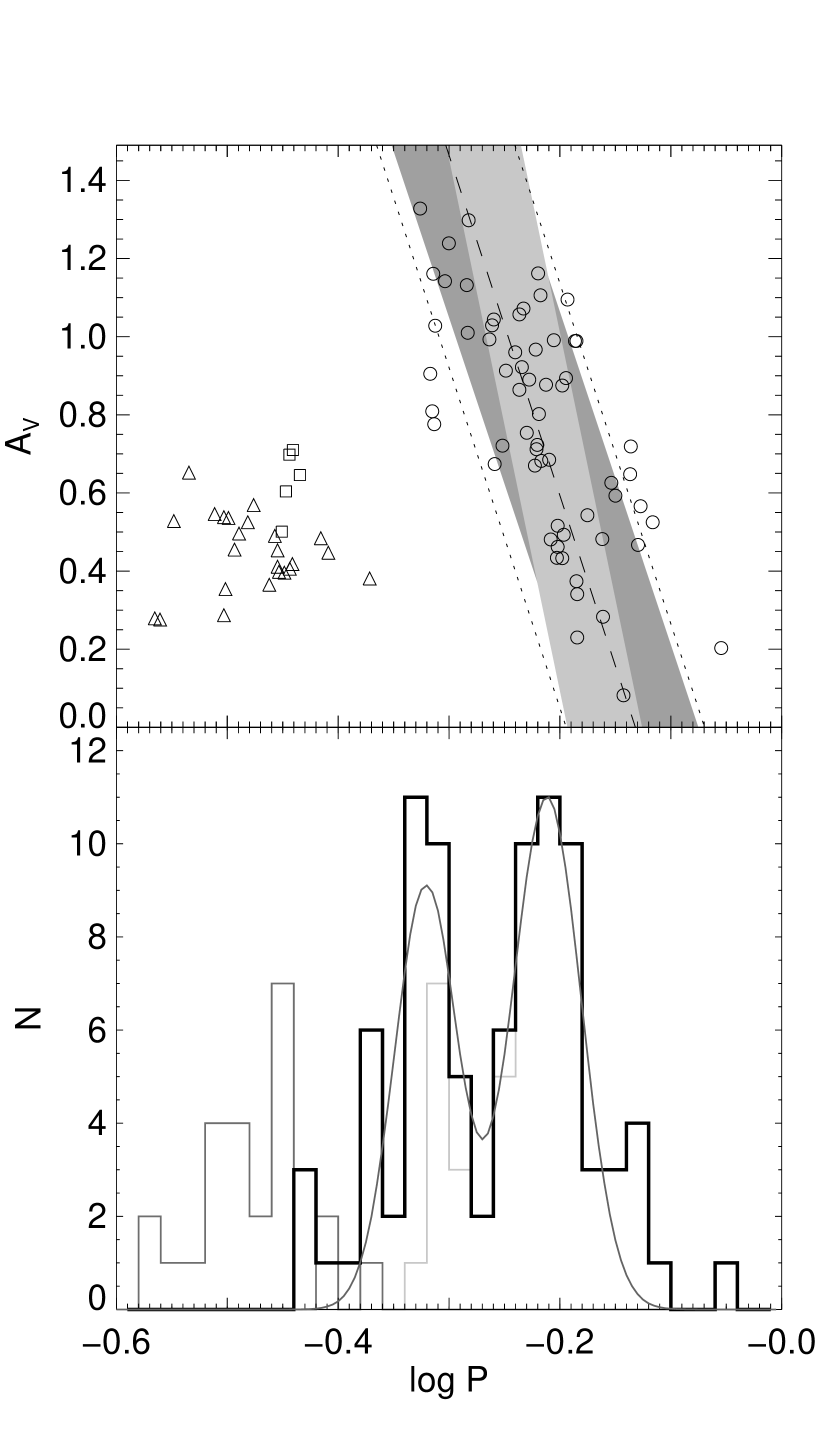
In Fig. 6 we show the period-amplitude diagram (top) and the period distribution (bottom) of the RR Lyrae stars. The top panel shows that the distribution of the RR of IC 1613 in period-amplitude space is very similar to that of Tucana, both in terms of slope and dispersion around the fit. The slight shift towards shorter periods of the RR stars of IC 1613, compared to those of Tucana, might be explained by the higher metallicity of IC 1613.
However, the distribution of fundamentalized periods appears to be bimodal, as shown by the fit of two Gaussian profiles (solid grey line) in the bottom panel, with peaks at P=0.478 and 0.614 day. Given the separation between the two peaks and the small uncertainty on the periods (0.001 day), it seems unlikely to be caused by stochastic effects only. To check the reliability of the observed bimodality, we applied the KMM test of Ashman et al. (1994) to the sample of RR periods. The algorithm estimates the improvement of a two-group fit over a single Gaussian, and returned a -value of 0.075. This can be interpreted as the rejection of the single Gaussian model at a confidence level of 92.5%, and therefore indicates that a bimodal distribution is a statistically significant improvement over the single Gaussian.
Note that the distribution of periods of the RR alone is also bimodal, although the small number of RR in the short-period peak does not exclude a result due to small number statistics. In addition, the location of the peaks (at P=0.494 and 0.615 day) does not seem to correspond to the superposition of Oo-I and Oo-II samples, as is the case in NGC 1835 (P0.54 and 0.65 day; Soszyński et al., 2003).
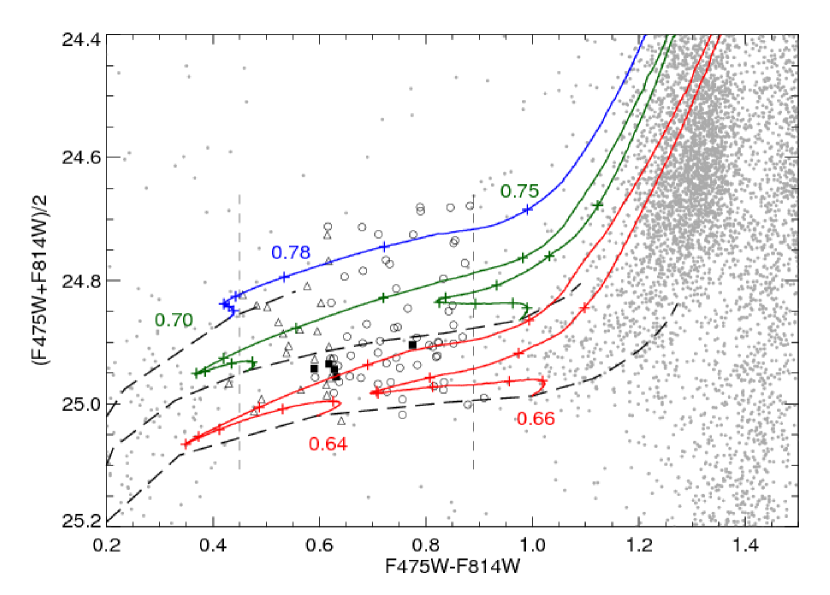
The bimodality might nontheless be due to the presence of two distinct old populations, as was already observed in the case of Tucana (Bernard et al., 2008). Figure 7 presents a zoom-in of the CMD centered on the HB. Zero-age horizontal-branch (ZAHB) loci and tracks from the scaled-solar models of the BaSTI library (Pietrinferni et al., 2004) are also shown, plotted assuming a reddening of E(BV)=0.025 from Schlegel et al. (1998), and a distance modulus of 24.49. This distance takes into account the true distance modulus (mM)0=24.44 determined in § 11.3 based on these data and a shift of 0.05 to correct for the updated electron-conduction opacities (Cassisi et al., 2007). This Figure shows that more than half of the RR Lyrae stars are concentrated in the faintest 0.1 mag of the instability strip (IS), while the other half is spread over 0.3 mag above. From the evolutionary tracks, it appears that most of the variables belong to the fainter, more-metal rich sample; these stars tend to have shorter periods. The brighter variables, on the other hand, appear to be related either to the Z=0.0001 population, or to stars with slightly higher metallicity (Z0.0003) that have evolved off the blue horizontal-branch visible on the WFPC2 CMD in Fig. 1.
In any case, the range of luminosity covered by the HB stars within the IS cannot be explained by a monometallic population, even taking into account evolution off the ZAHB. Given that RR Lyrae stars are old stars (10 Gyr), this implies a relatively quick chemical enrichment in the first few billion years of the formation of the galaxy.
5.2. WFPC2 sample
In the parallel WFPC2 field we discovered nine RR Lyrae stars (4 RR, 4 RR and 1 RR), even though the low signal-to-noise ratio of the observations did not allow us to measure their periods as accurately as for the variables in the ACS field-of-view. Based on the small samples of RR Lyrae stars, we find P=0.590.03 and P=0.350.01 for the fundamental and first-overtone pulsators, respectively, which is in rough agreement with the values found for the RR Lyrae stars in the ACS field-of-view. We provide their coordinates and approximate properties for completeness in Table 6.

5.3. Comparison with known RR Lyrae stars in IC 1613
Prior to our study, two surveys for variable stars found candidate RR Lyrae stars in IC 1613, although none of them in common with those presented here as the pointings did not overlap. Using the 4-shooter on the Hale-5m telescope, Saha et al. (1992) found 15 candidate RR Lyrae stars in a 88 field of view located 12 to the west of the galaxy center. From their Table 3, we calculated a mean period for the RR of 0.600.02 day, which is in good agreement with our value. We note, however, that all their RR Lyrae stars are of the type and on average appear brighter by about 0.3 mag than expected from the distance and metallicity of IC 1613 (see also § 11). While some RR stars could have been missed due to their low amplitude and the relatively noisy light-curves, some of them might have been misidentified as RR because of the small number of datapoints. Alternatively, given that crowding seems to be insignificant in this field—according to the finding charts—and that their RR span a range of luminosity of over a magnitude, we suspect that some of their RR Lyrae candidates could actually be short-period Cepheids.
The analysis of WFPC2 data by Dolphin et al. (2001) in a field 7.4 southwest from the center, on the other hand, returned 13 RR Lyrae candidates. Assuming that the likely and possible overtone pulsators are actual RR, their field contains 9 RR and 4 RR with mean periods of 0.580.02 and 0.370.03 day, respectively. This is very similar to the values we found for our WFPC2 field. The slightly shorter mean period for the RR, when compared to our ACS sample, may be due to the difficulty of detecting the low amplitude, longer period variables because of the lower quality of the data.
In any case, these samples at larger radii are not large enough for a robust comparison with the ACS sample in order to reveal potential gradients in the properties of the RR Lyrae stars as was done for the Tucana dwarf in Bernard et al. (2008). In the case of Tucana, the ACS field of view covered a larger fraction of the radius of the galaxy, allowing a radial gradient study within the ACS field alone.
6. Cepheids
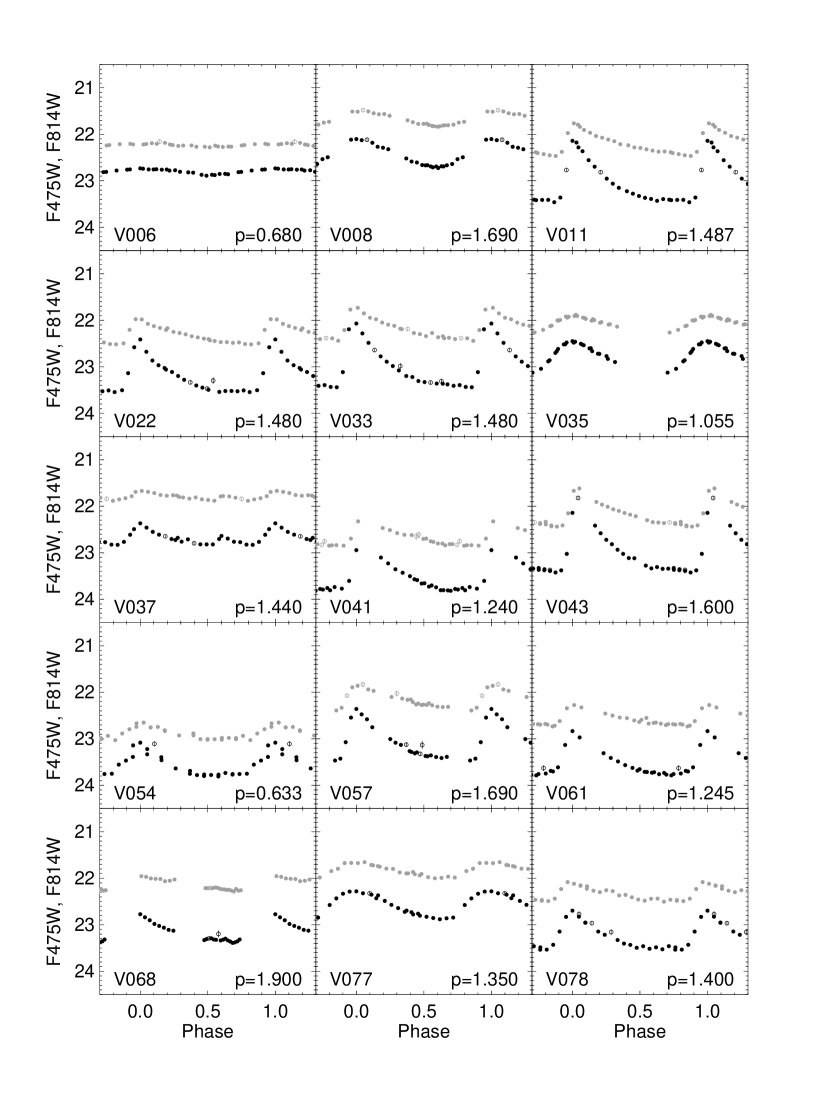
In the search for variable stars presented here we found 44 variables with properties of Cepheids: about 2 mag brighter than the HB, in or close to the IS, and P0.6 days. Their light-curves are shown in Fig. 8. Another five were found for which we could not determine their period and/or intensity-averaged mean magnitude due to inadequate temporal sampling. These are discussed in § 6.4.
Figure 9 shows the period diagram for the Cepheids in IC 1613. Because Cepheids from the different modes of pulsation have a different magnitude at a given period, their location in the period-luminosity (PL) diagrams can be used to differentiate their type. These PL relations are fundamental in that they represent the most robust method to calculate the distance to galaxies within the nearby universe. To reduce the scatter due to interstellar extinction and the intrinsic dispersion due to the finite width of the instability-strip, and to obtain a more secure classification, we calculated the Wesenheit, or reddening-free, magnitude introduced by van den Bergh (1968). In the HST bands used here, the relation is of the form:
| (1) |
where the coefficient 0.945 comes from the standard interstellar extinction curve dependence of the F814W magnitude on E(F475WF814W), from Schlegel et al. (1998).
Figure 9 shows two almost parallel sequences, and correspond to the fundamental (F, open circles) and first-overtone (FO, filled circles) Cepheids, respectively. A few outliers are marked as open triangles (V006 and V091) and a filled square (V126), and are discussed in § 6.2 and 6.3, respectively. From this plot, we find that 25 Cepheids are pulsating in the fundamental mode, while 16 fall on the first-overtone sequence.
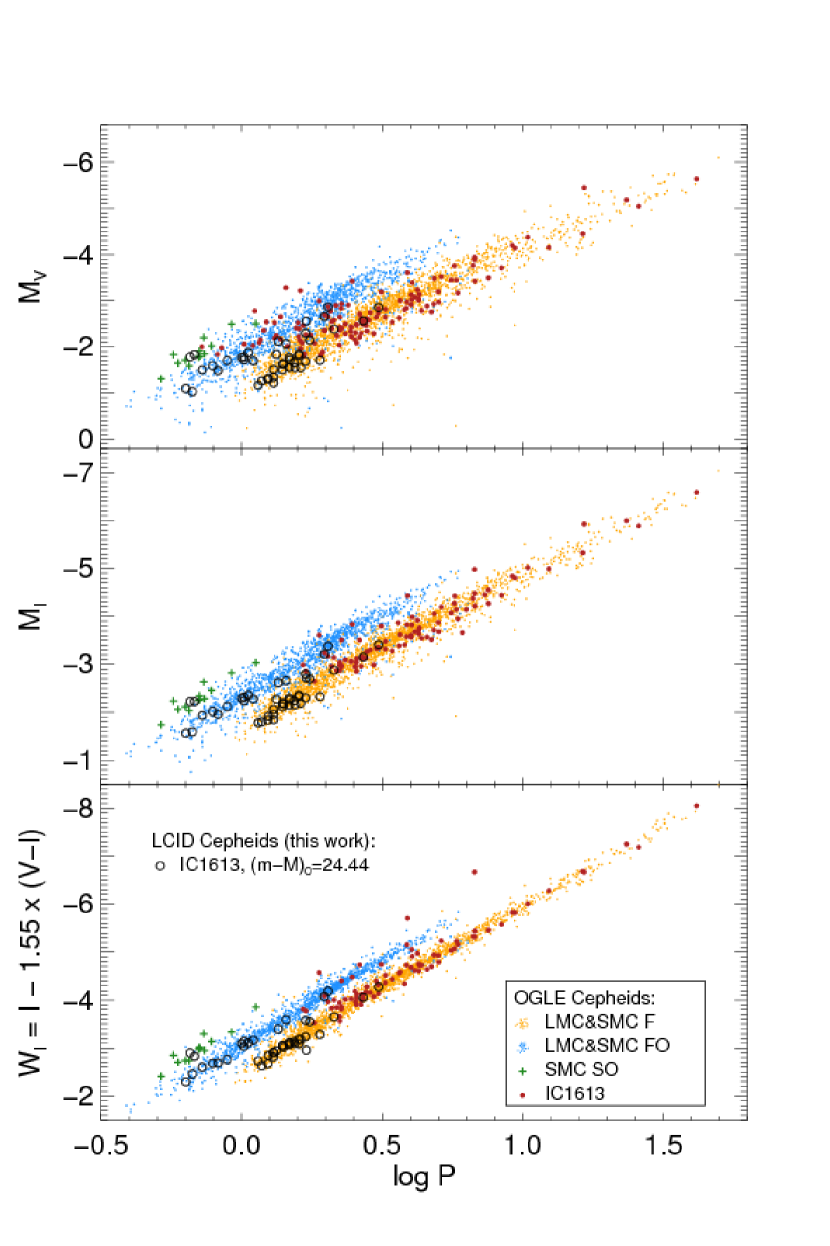
Figure 10 shows the PL diagram for the Johnson VI bands obtained as described in Paper I, as well as in the WI band as defined in Udalski et al. (1999c, ). The new Cepheids of IC 1613 (open circles) are shown overplotted on the classical Cepheids of the Large and Small Magellanic Clouds (LMC & SMC) and of IC 1613 from the OGLE collaboration (Udalski et al., 2001, and references therein) as labeled in the inset. The apparent magnitudes were converted to absolute magnitude assuming a distance modulus of 18.5150.085 to the LMC (Clementini et al., 2003), and a distance offset of 0.51 of the SMC relative to the LMC (Udalski et al., 1999c). The Cepheids of IC 1613 were shifted according to the distance determined in § 11. It shows that the properties of the Cepheids discovered in our field are in excellent agreement with the properties of OGLE Cepheids, therefore confirming their classical Cepheid nature.
However, one can see that the Cepheids in IC 1613 (both ours and OGLE) are mainly located toward the short-period extremity of the fundamental and overtone sequences when compared to the Cepheids in the Magellanic Clouds. Studies of the variable stars in the very metal poor dwarf irregular galaxies Leo A (Dolphin et al., 2002) and Sextans A (Dolphin et al., 2003) also revealed large numbers of short period Cepheids. This agrees with the suggestion by Bono (2003) that “the minimum mass that performs the blue loop [decreases with decreasing metallicity, which] means that metal-poor stellar systems such as IC 1613 should produce a substantial fraction of short-period classical Cepheids.”
Interestingly, the IC 1613 fundamental-mode Cepheids perfectly follow the various PL relationships defined by the Magellanic Clouds Cepheids over the whole range of periods, from 1 to 40 days (see Fig. 10). This suggests that the metallicity dependence of these relations, if any, must be very small at such low metallicities.
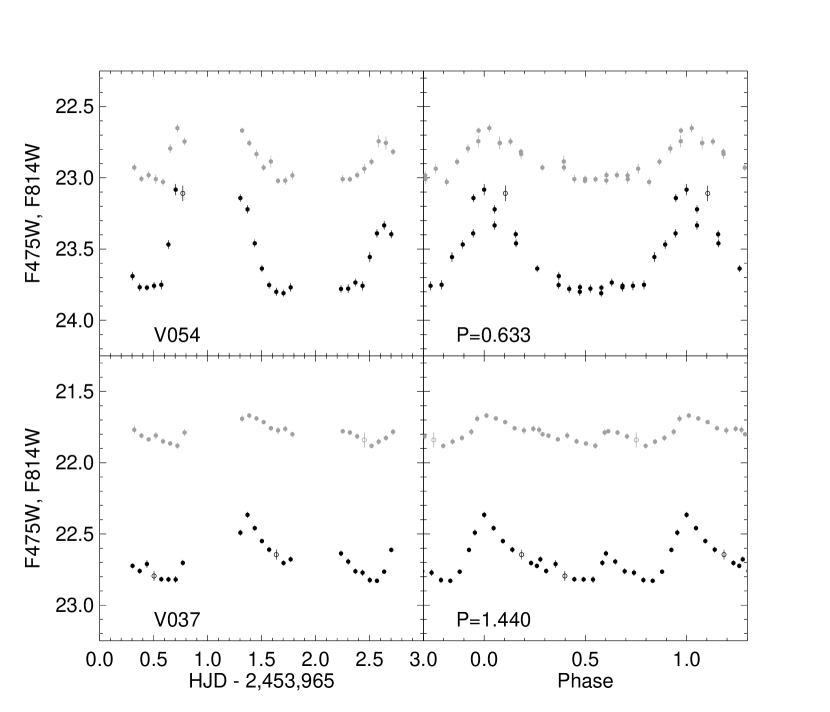
6.1. The peculiar Cepheids V037 & V054
Two of the Cepheids falling on the first-overtone sequence in Fig. 9 present very peculiar light-curves. These are shown again in Fig. 11, plotted as a function of Julian date (left) and phase (right).
In the top left panel, the amplitude of V054 seems to be decreasing at each consecutive maximum. The dispersion at maximum light on the phased light-curves is reminiscent of the light-curves of RR stars, although in this particular case the periodogram does not present the double-peak features characteristic of double-mode stars. However, the rather long main period of this variable (0.633 day vs. 0.39 for RR) limited the number of observed cycles to 4 and might explain the lack of resolution in the periodogram. In addition, the position of V054 on the PL diagrams, at the shorter period end, is in excellent agreement with the double-mode Cepheids pulsating simultaneously in the fundamental and first-overtone mode presented in Soszyński et al. (2008a).
In the case of V037, we found that the only period giving a smooth light-curve is P=1.44 days. However, as shown in the bottom right panel of Fig. 11, this produces a light-curve with a secondary maximum at phase 0.6. If this period is confirmed to be true, this would be the second Cepheid with such a light-curve in IC 1613 after V39 discovered by Baade (see Sandage, 1971). Note, however, that more recent observations and analysis of V39 (e.g., Mantegazza et al., 2001) favored a period only half that given by Sandage (1971, P=14.350 vs. 28.72 days) associated with a long term modulation of 1100 days, which could correspond to an extremely distant W Vir star in the outer halo of the MW blended with a long-period variable in IC 1613.
In our case, the short timebase of our observations definitely rules out the possibility of long term modulation. In addition, a shorter period for V037 cannot phase the light-curve properly unless a strong modulation of the period itself is taken into account, which is very unlikely on such short timescales. Given that its position in the CMD and PL diagrams is exactly that expected from a Cepheid, in the following we will assume that V037 is a bona fide classical Cepheid.
6.2. Second-Overtone candidates V006 & V091
In the diagrams shown in Figs. 9 & 10, two Cepheids lie above the first-overtone sequence in all panels. In particular in Fig. 10, they follow the sequence representing the second-overtone pulsators found by the OGLE collaboration in the SMC. Their nearly sinusoidal light-curve with very low amplitude in both bands (0.14 in F475W, 0.07 in F814W), as well as their location well within the IS, make them very strong second-overtone candidates. These are the first ones detected beyond the Magellanic Clouds.
Second-overtone classical Cepheids are very rare objects, as witnessed by the few firm candidates known to date: 13 out of 2049 classical Cepheids—0.42%—in the SMC (Udalski et al., 1999a), and 14 out of 3361—0.63%—in the LMC (Soszyński et al., 2008a). However, theoretical models by Antonello & Kanbur (1997) showed that these Cepheids are more likely to be found in low metallicity systems, which is in qualitative agreement with the fraction of second-overtone Cepheids in our IC 1613 sample, about 4%.
6.3. V126: a blended Cepheid?
The light-curve morphology, luminosity and period of V126 are all characteristic of a classical Cepheid. On the other hand, its color is 0.5 mag bluer than the blue edge of the IS, and therefore appears below the fundamental mode pulsator sequence in the period-Wesenheit diagram shown in Fig. 9. Although it appears isolated on the stacked images, the most likely hypothesis is that it is a bona fide Cepheid blended with an unresolved main-sequence star. The low amplitude of its luminosity variation in both bands relative to the other Cepheids with similar periods seems to support this conclusion.
6.4. Other candidates
Five Cepheids were observed for which we could not accurately determine their period and/or mean magnitude due to inadequate temporal sampling. We use the weighted mean magnitude given by ALLFRAME as their approximate magnitudes. They are shown as open stars in Fig. 1.
V030 has a period 0.98 day, and was therefore observed at the same phase each day, at minimum light. Most of the rising phase and peak are missing so it was not possible to fit a template light-curve and measure accurately its mean magnitude. From its approximate magnitude, its location on the PL diagram is consistent with the fundamental mode Cepheids.
V090 has relatively low-amplitude (A4750.15, A8140.11) and period 2P4 days. From its location on the PL diagram it is a probable first-overtone.
V124 is very bright and was previously known from ground-based observations (see § 10). Given its very long period (26 days), our observations cover less than 10% of a cycle so we did not try to obtain the mean magnitude from our data. It is shown in Fig. 10 as the fundamental mode OGLE Cepheid at log P1.41.
V137 was also present in the OGLE field, although their quoted period of 1.376 days does not provide a satisfactory fit to our data. Even though we could not obtain an accurate period for this variable, the 1.4-mag decrease in the F475W band over the first two days and the beginning of the third, and the subsequent increase implies a period in the range 2.7P3.3 days, which would make it a fundamental mode Cepheid.
V151 is one of the brightest Cepheids of our sample, and thus has a period longer than our observational timebase. Unfortunately, it is missing from the OGLE catalog so we can only constrain the period to the range 2.5P3.1 days from the light-curve morphology. It places it on the PL relation of fundamental mode Cepheids.
7. Eclipsing Binary Stars
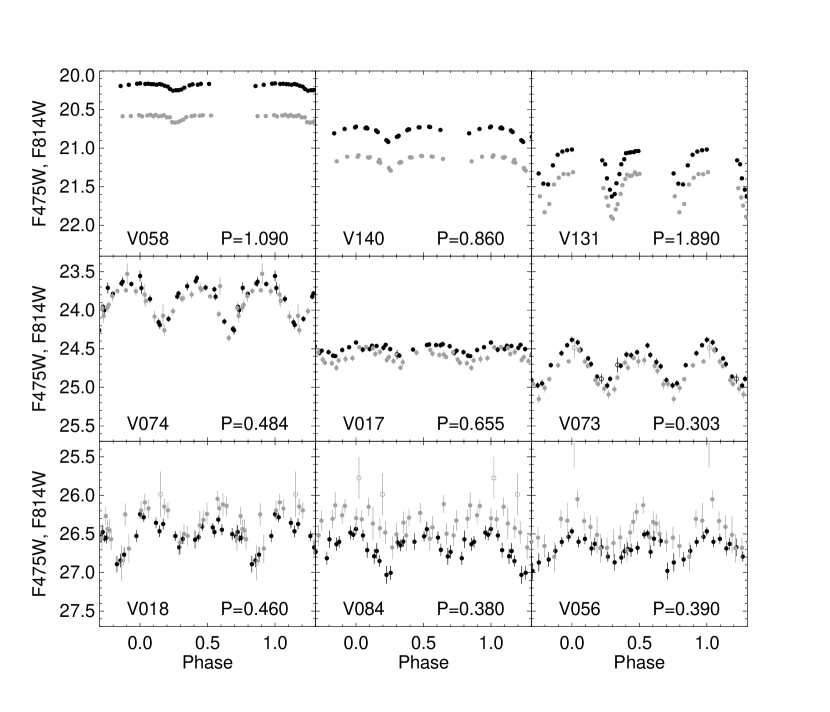
A large number of variable star candidates were found in the main-sequence, as can be expected from the fact that it is well populated from the turn-offs to the B giants. Most of the variables for which we could find a period are eclipsing binary stars. The remaining ones have properties of high-amplitude -Scuti stars (HADS) and are discussed in the following section, while the candidates for which the light-curves could not be phased are presented in § 9. Note that all of these stars are newly discovered variables.
In the ACS field-of-view, we found 38 eclipsing binaries between ‘V’20.5 and 26.5. At fainter magnitudes, the signal-to-noise ratio of the individual datapoints was too low to estimate the period and/or confirm variability. The light-curves of the three brightest, three intermediate magnitude, and the three faintest binaries are shown in Fig. 12.
Given the small number of datapoints and relatively low SNR of most of the candidates, some periods might actually be multiples of the true periods. We thus did not try to assign them a particular type of binary (detached or contact)—although the variety of light-curve morphologies indicate that members of both kinds appear to be present—nor check for their membership in IC 1613.
Bright eclipsing binaries have been used to determine distances to LG galaxies with claimed accuracy better than about 5% (e.g., M31: Ribas et al. 2005; M33: Bonanos et al. 2006). Unfortunately, the stars need to be bright enough (V20) to accomplish this in a reasonable time with current observing facilities. Even though some of our eclipsing binaries have accurate periods and deep eclipses, none of them is brighter than V20.4.
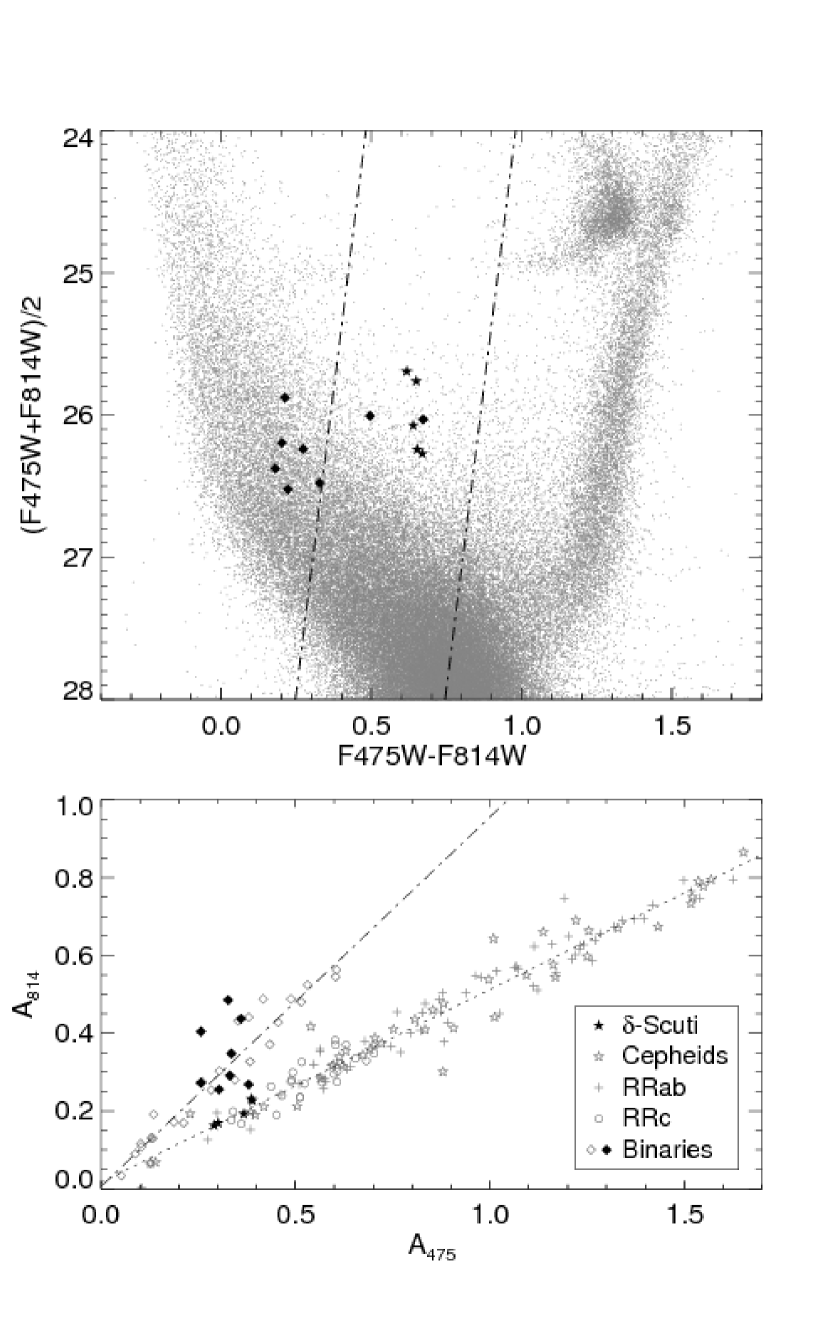
8. Candidate -Scuti stars
Among the candidate variables fainter than the HB that appeared to be periodic variables, most of them were found to be binaries and are described in the previous section. For some of these variables, however, it was possible to obtain a relatively smooth, pulsation-like light-curve (i.e., with a single minimum) with a short period. This was the case for 13 variables, which were flagged as possible -Scuti stars. To further constrain their nature, additional parameters were taken into account. First, we required that their color be within the classical IS, defined approximately by the position of the Cepheids and RR Lyrae stars. The top panel of Fig. 13 shows a zoom-in of the CMD showing the location of the IS, where the 13 possible -Scuti are shown as filled symbols. Eight of these fall within or close to the boundaries of the IS.
Given that the pulsations of the -Scuti stars, like the Cepheids and RR Lyrae stars are driven by the -mechanism, the second criteria was that the amplitude ratio had to be in agreement with that of the other pulsating variables. The bottom panel of Fig. 13 shows the amplitude in F814W versus the amplitude in F475W for Cepheids, RR Lyrae stars, eclipsing binaries with good light-curves, and the possible -Scuti stars. Only 5 satisfy this requirement, and are shown as filled stars in both panels. They also present relatively smooth light-curves with very short periods (0.2 days). Their pulsational properties are summarized in Table 4.
9. Other Variables
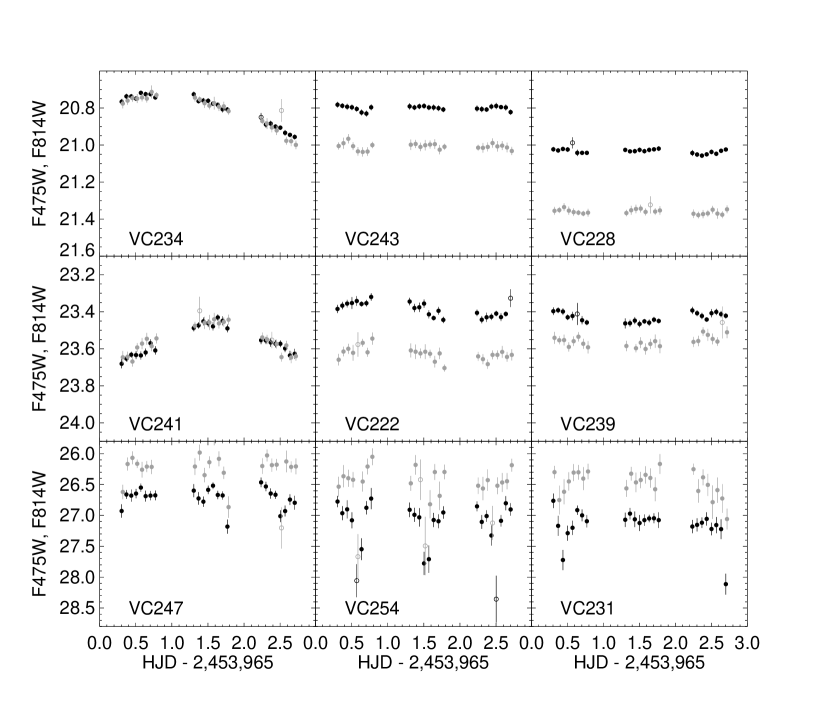
In addition to the classical IS variables and eclipsing binaries presented above, we detected another 77 candidate variables throughout the CMD, for which we could not determine the period because of inadequate temporal sampling. Most of these candidate variables are located on the MS, although five LPV candidates are also present at or close to the TRGB. While the majority of the MS candidates are most likely eclipsing binaries, at least in the brightest part of the MS might there be pulsating variables of the Cephei or Slowly Pulsating B stars types (see, e.g., Diago et al., 2008). A sample of the brightest, intermediate, and the faintest light-curves is shown in Fig. 14.
10. Previously Known Variables
The variable stars in our ACS field in IC 1613 that were already known prior to this work are presented in Table 7. We give their index and period as measured from our data, as well as their identifications and periods in previous catalogs; most of them were discovered during the wide-field survey by the OGLE collaboration. Because of the relatively shallow magnitude limits of the other surveys, all are luminous Cepheids with relatively large amplitude.
Two of them, V124 and V172, were already included in Baade’s catalog (Sandage, 1971) as V11 and V35, respectively. These are the two brightest Cepheids of our sample, although the very long period of the former prevented us from measuring its intensity-averaged magnitude and period. Another candidate variable that was flagged as a possible Cepheid in Sandage (1971) and judged to be an irregular variable in Carlson & Sandage (1990), V41 is constant within 0.02 and 0.05 mag in our F475W and F814W data and was not included in our catalog.
Two other Cepheids appeared in Mantegazza et al. (2001) with periods similar to the ones found here within 0.01 day, while three LPV/Irr variables of their catalog appear constant in our data (V0762C, V1598C, and V1667C). However, all have very long periods (70 days) and/or low amplitude (AWh=0.20) and their variation could have easily been missed in our data due to the short observing run.
The remaining variables were previously observed by OGLE (Udalski et al., 2001). For most of them, the periods determined from our data agree well with theirs. However, the 1.376 day period given by OGLE for V137 cannot phase our data. Our sampling over 3 consecutive days clearly covers only about one cycle, so the period must be very close to P=3 days.
By comparing the number of Cepheids observed by us and the OGLE team in the same field, we can obtain a rough estimate of the completeness of their survey. We found 49 Cepheids over the area of the ACS camera, while their sensitivity limited them to 12 detections. Assuming that the density of Cepheids is uniform in the central region of IC 1613, this means that about 500 Cepheids should be present in the 14x14 field observed by the OGLE collaboration. Given the extent of the galaxy, this value is roughly in agreement with the total number estimated in § 4.
| ID | Period | IDOGLE | POGLE | IDotheraaV11 & V35 from Sandage (1971), V1478C & V1465C from Mantegazza et al. (2001) | Pother |
|---|---|---|---|---|---|
| V008 | 1.69 | 2124 | 1.697 | V1478C | 1.701 |
| V022 | 1.48 | 2197 | 1.459 | - | - |
| V057 | 1.69 | 2818 | 1.661 | - | - |
| V077 | 1.35 | 2909 | 1.309 | - | - |
| V086 | - | 2389 | 2.029 | - | - |
| V093 | 1.75 | - | - | V1465C | 1.741 |
| V106 | 2.13 | 2117 | 2.131 | - | - |
| V124 | - | 1987 | 25.862 | V11 | 25.7719 |
| V137 | 3. | 2751 | 1.376 | - | - |
| V147 | 2.0 | 2342 | 1.972 | - | - |
| V154 | 2.7 | 2760 | 2.712 | - | - |
| V170 | 1.33 | 2771 | 1.329 | - | - |
| V172 | 3.0 | 2240 | 3.074 | V35 | 3.073417 |
11. Distance
In Paper I, we used the photometric and pulsational properties of the RR Lyrae stars to measure the distances to the dSphs Cetus and Tucana, and showed that the values we obtained are in excellent agreement with the distances obtained previously with independent methods. We therefore obtain here a RR Lyrae-based distance for IC 1613 in the same way. Additionally, given the significant number of Cepheids we found in IC 1613 and the high quality of their light-curves, together with their firm classification as fundamental, first-, or second-overtone pulsators, it is possible to calculate accurate distances from their properties as well.
In this section, we use several methods adopted in the literature to calculate the distance based on the photometric and pulsational properties of the Cepheids and RR Lyrae stars. In all cases, the intensity-averaged mean magnitudes in the Johnson bands are used.
11.1. Cepheids
11.1.1 Period-Wesenheit relation for Fundamental and First-Overtone Cepheids
The main distance indicator for star forming galaxies in the nearby universe is the relation between the period and the luminosity of their Cepheids, even though the slope and zero-point of this relation might be slightly dependent on metallicity (e.g., Kennicutt et al., 1998; Sakai et al., 2004; Sandage & Tammann, 2008). However, from the analysis of nonlinear convective pulsations models, Fiorentino et al. (2007) showed that the I-band period-luminosity is not expected to show metallicity dependence at metallicities lower than that of the LMC (Z=0.008), and that the effect of metal-content on the P–MV relation is negligible below Z=0.004. Given the low metallicity of the young stars in IC 1613 (Z0.003), we will therefore assume that it is safe to estimate its distance by comparison with the properties of the Cepheids of the Magellanic Clouds.
Here we chose to derive a new P– (see § 6) relation based on the Cepheids of both MCs instead of using the relations available in the literature for the following reasons: i) first, the domain of validity for the PL relations of the literature starts at about P=2.5 days (log P = 0.4; see e.g., Udalski et al., 1999c; Fouqué et al., 2007), while all our well-measured Cepheids have periods shorter than this value; and ii) the period distribution of the Cepheids in the LMC and SMC are very different from each other, with the peaks in the distribution at P3.2 and 2.1 days for the fundamental and first-overtone Cepheids in the LMC, and at P1.6 and 1.3 days, respectively, in the SMC. While the period distribution of the Cepheids in IC 1613 (with the peaks at P1.6 and 1.1 days) are very similar to those in the SMC, the distances to other galaxies are usually provided relative to a given LMC distance. In addition, the PL relation of the SMC presents a rather large dispersion due to the inclination of the galaxy with respect to the line of sight. We thus combined the Cepheids of both Magellanic Clouds assuming (mM)0=0.510.03 (Udalski et al., 1999c) to improve the period coverage. This also has the advantage of cancelling any small difference in slope that might be present between the PL relations of the LMC and SMC.
In addition, most of the Cepheids we observed in IC 1613 are located at the short-period end of the distribution, so any non-linearity in the PL relation would lead to a different distance had the Cepheids had longer periods. Ngeow et al. (2009) showed that the PL relation in the Wesenheit magnitude is linear over the period range covered by the LMC Cepheids, while it is not in the V&I bands. Finally, the use of also limits the effect of interstellar reddening and thus reduces the scatter in the relation.
We calculate the P– relation from linear regression fits to the combined MC Cepheids from OGLE-II observations (Udalski et al., 1999b, d) over the whole range of periods after rejecting the outliers through sigma-clipping (2.5-, 5 iterations). Assuming an LMC distance of (mM)0=18.5150.085 (Clementini et al., 2003), we found:
WI,F=3.435(0.007) log 2.540(0.006), and
WI,FO=3.544(0.013) log 3.067(0.007)
for the fundamental and first-overtone Cepheids, respectively, with a standard deviation of 0.096 in both cases.
The slope of our fundamental P– relation is marginally different from the slope found by other authors (e.g., WI,F/log =3.3130.008, Ngeow et al. 2009; WI,F/log =3.3200.011, Fouqué et al. 2007) based on the OGLE Cepheids of the LMC only, and may be an indication that this relation deviates from linearity at periods shorter than about 0.3 days. On the other hand, it is intermediate between the slopes found for the LMC and the values obtained for the Cepheids of the MW (e.g., Fouqué et al., 2007, WI,F/log =3.4770.074).

We applied the P– relations derived above to the fundamental and first-overtone Cepheids of IC 1613 shown in Fig. 9 (excluding the two Cepheids located at the midpoint between the dash-dotted and dashed lines, V008 and V093), and found (mM)0=24.500.11 and 24.470.12, respectively. The good agreement between these two values indicates that first-overtone Cepheids can be safely used as distance indicators in the case where the pulsating mode of the Cepheids can be unambiguously identified.
We also calculated the distance to IC 1613 using the PL relation for fundamental-mode Cepheids given by Ngeow et al. (2009) to check if the small differences in slope and zero-point described above would have a significant effect, but found a very similar value ((mM)0=24.550.12) within the uncertainties.
| (mM) | E(BV) | Band | Method | Ref. | |
|---|---|---|---|---|---|
| 24.500.11 | 0.025 | 18.515 | WI | Cep: F PL | 1 |
| 24.470.12 | 0.025 | 18.515 | WI | Cep: FO PL | 1 |
| 24.460.11 | 0.025 | 18.515 | VI | Cep: SO PLC | 1 |
| 24.470.12 | 0.025 | 18.515 | V | RRL: MV-[Fe/H] | 1 |
| 24.440.10 | 0.025 | 18.515 | V | RRL: PLM | 1 |
| 24.55 | 0.03 | B | Cep: F PL | 2 | |
| 24.280.25 | 0.05 | 18.27 | B | Cep: F PL | 3 |
| 24.320.11 | 0.03 | H | Cep: F PL | 4 | |
| 24.270.11 | 0.04 | 18.50 | BVRIH | Cep: F PL | 5 |
| 24.390.14 | 0.04 | 18.50 | WI | Cep: F PL | 5 |
| 24.170.27 | 0.02 | g | RRL: MV-[Fe/H] | 6 | |
| 24.530.13 | 0.03 | 18.50 | V | Cep: F PL | 7 |
| 24.440.13 | 0.03 | 18.50 | I | Cep: F PL | 7 |
| 24.530.12 | 0.03 | 18.50 | J | Cep: F PL | 7 |
| 24.430.08 | 0.03 | 18.50 | H | Cep: F PL | 7 |
| 24.400.09 | 0.025 | I | TRGB | 8 | |
| 24.380.09 | 0.025 | I | Red Clump | 8 | |
| 24.400.16 | 0.025 | V | RRL: MV-[Fe/H] | 8 | |
| 24.310.07 | 0.025 | 18.21 | V | Cep: F PL | 9 |
| 24.240.07 | 0.025 | 18.23 | I | Cep: F PL | 9 |
| 24.240.07 | 0.025 | 18.25 | WI | Cep: F PL | 9 |
| 24.530.10 | 0.02 | I | TRGB | 10 | |
| 24.385 | 0.09 | 18.50 | J | Cep: F PL | 11 |
| 24.306 | 0.09 | 18.50 | K | Cep: F PL | 11 |
| 24.500.12 | 0.024 | 18.54 | BVRI | Cep: F PL | 12 |
| 24.430.05 | 0.025 | I | TRGB | 13 | |
| 24.290.07 | 0.08 | 18.50 | 3.6m | Cep: F PL | 14 |
| 24.280.07 | 0.08 | 18.50 | 4.5m | Cep: F PL | 14 |
References. — (1) This work; (2) Sandage 1971; (3) de Vaucouleurs 1978; (4) McAlary et al. 1984; (5) Freedman 1988; (6) Saha et al. 1992; (7) Macri et al. 2001; (8) Dolphin et al. 2001; (9) Udalski et al. 2001; (10) Tikhonov & Galazutdinova 2002; (11) Pietrzyński et al. 2006; (12) Antonello et al. 2006; (13) Rizzi et al. 2007; (14) Freedman et al. 2009.
11.1.2 Second-Overtone Cepheids and the Period-Luminosity-Color relation
From their theoretical work on second-overtone (SO) Cepheids, Bono et al. (2001) noted that these variables follow a period-luminosity-color relation of the form:
Given the low amplitude of the luminosity variations and the very small temperature width of the SO IS, the standard deviation of this relation is only 0.004. It is thus possible to use it to determine distances with good accuracy. From the SO Cepheids observed in the SMC by Udalski et al. (1999a) and assuming E(BV)=0.054, the authors found a distance of (mM)0,SMC=19.110.08 to the SMC through this relation.
Applying this relation to the two SO Cepheids described in § 6.2, we find a distance modulus of (mM)0=24.540.11. Note, however, that the distance to the SMC used in the previous section to obtain the period-WI relationship was 19.03, assuming an LMC distance of 18.5150.085 and a distance moduli difference of 0.510.03. Taking into account this offset in zero-point, we find that the true distance modulus to IC 1613 from SO Cepheids is 24.460.11, in better agreement with the mean value determined below.

11.2. RR Lyrae stars
Similar to what we did in Paper I, we also calculate the distance to IC 1613 using two methods based on the properties of the RR Lyrae stars, namely the luminosity-metallicity relation, which arises from the knowledge that the intrinsic luminosity of HB stars mainly depends on their metallicity, and the period-luminosity-metallicity (PLM) relation, based on the theoretical location of the instability strip in the period-luminosity plane.
The luminosity-metallicity relation we used in Paper I has the form:
To calculate the mean magnitude of the RR Lyrae stars, we used only the stars for which we could determine accurate intensity-averaged mean magnitudes—RR and RR—and obtained =24.990.01. Assuming a mean metallicity of Z=0.00050.0002 (i.e., [Fe/H]=1.60.2 assuming Z☉=0.0198 (Grevesse & Noels, 1993) and [Fe/H]=log Z+1.70 log(0.638 f + 0.362) (Salaris et al., 1993) with the enhancement factor f set to zero) for the old population from the results of the SFH derived in Skillman et al. (2010, in preparation), we find a luminosity for the HB of MV=0.520.12. The uncertainty was quantified through Monte-Carlo simulations. This gives a distance modulus of 24.470.12, or (mM)0=24.390.12 after correcting for reddening.
The second method we used to determine the distance modulus consists of matching the PLM relation at the first-overtone blue edge (FOBE) of the IS from Caputo et al. (2000, their eq. 3) to the observed RR. Basically, the theoretical limits of the IS are shifted in magnitude until the FOBE coincides with the observed distribution of first-overtone RR Lyrae stars. Figure 15 shows the position of the IS (dashed lines) overplotted on the distribution of observed RR Lyrae stars in the –log P plane.
Adopting the mean metallicity given above (Z=0.0005), we derive a dereddened distance modulus of (mM)0=24.36, for which Caputo et al. (2000) give an intrinsic dispersion of =0.07 mag due to uncertainties associated with the various ingredients of the model. Combined with the errors in metallicity, mean magnitude, and period, we estimate a total uncertainty in this measure of the distance of 0.1.
11.3. Results
Since the distances derived in § 11.1 and 11.2 are consistent with each other and have similar uncertainties, we simply averaged them to obtain our best distance estimate and obtained a dereddened distance modulus of 24.44 (=0.054), corresponding to a distance of 770 kpc.
A summary of the previous distance determination from the literature is given in Table 11.1.1. The columns give the reddened distance modulus, the assumed or calculated reddening and LMC distance modulus, the observation band, and the method used to estimate the distance. We compare these values in Fig. 16, where the reddened moduli as given in the referenced articles are shown as pluses. To make this comparison more meaningful, we also show the distance moduli corrected for a common reddening of E(BV)=0.025 (Schlegel et al., 1998) and LMC distance modulus (mM)0=18.5150.085 (Clementini et al., 2003). The reddening correction was done following the extinction law of Cardelli et al. (1989) with RV=3.1.
The figure shows that all the measurements, independent of the method, are in excellent agreement with each other once set on the same scale. From these values (excluding the Saha et al. (1992) outlier), we find a mean dereddened distance of (mM)0=24.4000.014, where the uncertainty only includes the standard deviation of the different measurements. The vertical lines in Fig. 16 indicate the mean and standard deviation (=0.071) of these values. Therefore, we believe that the largest source of uncertainty on the distance to IC 1613 is systematic rather than statistical, and mostly lies in the calibration of the distance to the LMC.
12. Discussion and Conclusions
We have presented the results of a new search for variable stars in IC 1613 based on high quality HST images. In the ACS field, we found 259 candidate variables, including 90 RR Lyrae stars, 49 Cepheids, and 38 eclipsing binaries, as well as nine RR Lyrae stars and two additional Cepheids in the parallel WFPC2 field. Only thirteen of these variables were known prior to this study, all of them Cepheids.
We find that the mean periods of the RR and RR stars, as well as the fraction of overtone pulsators, place this galaxy in the intermediate regime between the Oosterhoff types, as was already observed for the vast majority of Local Group dwarf galaxies.
From the comparison with Magellanic Clouds Cepheids through the period-luminosity diagram, we find that all our Cepheids are bona fide classical Cepheids, while the Cepheids in the dSph Cetus and Tucana discussed in Paper I were classified as anomalous Cepheids. The lack of classical Cepheids in the latter dwarfs is not surprising given the absence of significant star formation more recent than about 8-10 Gyr (Monelli et al., 2010). On the other hand, the reason for the apparent lack of anomalous Cepheids in IC 1613 is not clear. The star formation histories calculated from deep CMDs (Skillman et al., 2003, 2010, in preparation) indicate that it formed stars fairly constantly over the past 13 Gyr, so unless the formation of anomalous Cepheids is extremely sensitive to the metal content, anomalous Cepheids should also be present in IC 1613.
Gallart et al. (2004) showed that both types of Cepheids were present in comparable numbers in the transition type galaxy Phoenix, and possibly also in Leo A and Sextans A, all of them having very low metallicity (Z0.0008). These authors suggest that the only requirements for the presence of both types of Cepheids in a galaxy are low enough metallicity (Z0.0004) and star formation activity at all ages. At the other end of the dwarf galaxy metallicity spectrum, 83 anomalous Cepheids were discovered in the LMC (Soszyński et al., 2008b), compared to the 3361 classical Cepheids that are present in the same catalog (Soszyński et al., 2008a). This implies about 2.4 anomalous Cepheid per 100 classical Cepheid at the metallicity of the LMC (Z0.008). If this fraction is representative for low metallicity galaxies, about one anomalous Cepheid could be expected in our ACS field-of-view of IC 1613. However, Dolphin et al. (2002) showed how low metallicity galaxies contain many more short-period classical Cepheids than higher metallicity galaxies at a given star formation rate due to morphology of the blue loops: at low metallicity, the blue loops extend further to the blue and thus cross the instability strip at fainter magnitudes. As a result of the stellar initial mass function, the fainter Cepheids are also more numerous. Therefore, the apparent lack of anomalous Cepheids in our field might simply be due to small number statistics. Given the low density of anomalous Cepheids expected in IC 1613, more data covering a large field-of-view are needed to check if anomalous Cepheids are actually present in this galaxy.
Finally, we used the properties of the RR Lyrae stars and Cepheids to estimate the distance to IC 1613, and found excellent agreement with the values previously determined. Combining all the measurements after correction for a common reddening and reference LMC distance, we find a true distance modulus to this galaxy of (mM)0=24.4000.014 (statistical), corresponding to 760 kpc.
Appendix A Comments on Individual Variables
The following comments are based on the careful inspection of the stacked
images, of the light curves, and/or peculiar properties exhibited on one or
more of the plots presented in this work.
V001 — Blend.
V004 — Blend.
V007 — Close to a bright star.
V009 — Blend.
V010 — Possible blend.
V013 — Close to the wing of a very bright star.
V019 — Possible blend.
V020 — Blend.
V022 — Blend.
V027 — Blend.
V029 — Blend.
V030 — Blend.
V032 — Blend.
V034 — Blend.
V036 — Blend and close to a bright star.
V038 — Blend. Very low amplitude RR.
V043 — Possible blend.
V044 — Possible blend.
V046 — Possible blend.
V047 — Blend.
V050 — Possible blend.
V052 — Possible blend.
V057 — Possible blend.
V058 — Blend.
V061 — Blend.
V066 — Blend.
V071 — Close to a very bright star.
V072 — Blend.
V073 — Blend.
V074 — Blend with a background galaxy and bright stars.
V076 — Blend.
V077 — Blend.
V080 — In bad column.
V085 — Blend.
V087 — Blend.
V088 — Blend.
V089 — Possible blend.
V090 — Blend.
V093 — Blend.
V099 — Located close to the edge of chip 1. Some points bad or missing because of dithering.
V102 — Blend.
V106 — Blend.
V108 — Blend.
V114 — Possible blend.
V121 — Blend and located close to the edge of chip 1. Some points bad or missing because of dithering.
V122 — Blend.
V125 — Blend.
V133 — Blend.
V141 — Blend.
V144 — Blend.
V145 — Possible blend.
V148 — Blend.
V149 — Blend.
V152 — Blend.
V153 — Blend.
V161 — Blend.
V167 — Blend.
V170 — Blend.
V171 — Blend.
V175 — Possible blend.
V176 — Blend.
V177 — Blend.
V178 — Blend.
V180 — Blend.
VC202 — Blend.
VC206 — Blend.
VC208 — Saturated in F814W.
VC213 — Possible blend.
VC217 — Blend.
VC223 — Blend.
VC225 — Possible blend.
VC227 — Blend.
VC229 — Blend.
VC231 — Blend.
VC236 — Blend.
VC238 — Blend.
VC239 — Blend.
VC240 — Blend.
VC241 — Blend.
VC243 — Blend.
VC244 — Possible blend.
VC245 — Possible blend.
VC246 — Possible blend.
VC252 — Blend.
VC254 — Blend.
VC257 — Possible blend.
VC259 — Blend.
VC265 — Blend.
VC267 — Blend.
VC268 — Blend.
VC270 — Blend.
Appendix B Finding Charts
The finding charts for the whole sample of variable stars are presented in the electronic version of The Astrophysical Journal (Fig. 17).
References
- Antonello et al. (2006) Antonello, E., Fossati, L., Fugazza, D., Mantegazza, L., & Gieren, W. 2006, A&A, 445, 901
- Antonello & Kanbur (1997) Antonello, E., & Kanbur, S. M. 1997, MNRAS, 286, L33
- Ashman et al. (1994) Ashman, K. M., Bird, C. M., & Zepf, S. E. 1994, AJ, 108, 2348
- Battinelli et al. (2007) Battinelli, P., Demers, S., & Artigau, É. 2007, A&A, 466, 875
- Bernard et al. (2007) Bernard, E. J., Aparicio, A., Gallart, C., Padilla-Torres, C. P., & Panniello, M. 2007, AJ, 134, 1124
- Bernard et al. (2008) Bernard, E. J., et al. 2008, ApJ, 678, L21
- Bernard et al. (2009) Bernard, E. J., et al. 2009, ApJ, 699, 1742 (Paper I)
- Bonanos et al. (2006) Bonanos, A. Z., et al. 2006, ApJ, 652, 313
- Bono (2003) Bono, G. 2003, Stellar Candles for the Extragalactic Distance Scale, 635, 85, arXiv:astro-ph/0305102
- Bono et al. (2001) Bono, G., Caputo, F., & Marconi, M. 2001, MNRAS, 325, 1353
- Caputo et al. (2000) Caputo, F., Castellani, V., Marconi, M., & Ripepi, V. 2000, MNRAS, 316, 819
- Cardelli et al. (1989) Cardelli, J. A., Clayton, G. C., & Mathis, J. S. 1989, ApJ, 345, 245
- Carlson & Sandage (1990) Carlson, G., & Sandage, A. 1990, ApJ, 352, 587
- Cassisi et al. (2007) Cassisi, S., Potekhin, A. Y., Pietrinferni, A., Catelan, M., & Salaris, M. 2007, ApJ, 661, 1094
- Clementini et al. (2003) Clementini, G., Gratton, R., Bragaglia, A., Carretta, E., Di Fabrizio, L., & Maio, M. 2003, AJ, 125, 1309
- Dall’Ora et al. (2006) Dall’Ora, M., et al. 2006, ApJ, 653, L109
- de Vaucouleurs (1978) de Vaucouleurs, G. 1978, ApJ, 223, 730
- Diago et al. (2008) Diago, P. D., Gutiérrez-Soto, J., Fabregat, J., & Martayan, C. 2008, A&A, 480, 179
- Dolphin et al. (2001) Dolphin, A. E., et al. 2001, ApJ, 550, 554
- Dolphin et al. (2002) Dolphin, A. E., et al. 2002, AJ, 123, 3154
- Dolphin et al. (2003) Dolphin, A. E., et al. 2003, AJ, 125, 1261
- Fiorentino et al. (2007) Fiorentino, G., Marconi, M., Musella, I., & Caputo, F. 2007, A&A, 476, 863
- Fouqué et al. (2007) Fouqué, P., et al. 2007, A&A, 476, 73
- Freedman (1988) Freedman, W. L. 1988, ApJ, 326, 691
- Freedman et al. (2009) Freedman, W. L., Rigby, J., Madore, B. F., Persson, S. E., Sturch, L., & Mager, V. 2009, ApJ, 695, 996
- Gallart et al. (2004) Gallart, C., Aparicio, A., Freedman, W. L., Madore, B. F., Martínez-Delgado, D., & Stetson, P. B. 2004, AJ, 127, 1486
- Grevesse & Noels (1993) Grevesse, N., & Noels, A. 1993, Origin and Evolution of the Elements, 15
- Horne & Baliunas (1986) Horne, J. H., & Baliunas,S. L. 1986, ApJ, 302, 757
- Kennicutt et al. (1998) Kennicutt, R. C., Jr., et al. 1998, ApJ, 498, 181
- King (1962) King, I. 1962, AJ, 67, 471
- Layden et al. (1999) Layden, A. C., Ritter, L. A., Welch, D. L., & Webb, T. M. A. 1999, AJ, 117, 1313
- Mack et al. (2007) Mack, J., Gilliland, R. L., Anderson, J., & Sirianni, M. 2007, Instrument Science Report ACS 2007-02, 20 pages, 2
- Macri et al. (2001) Macri, L. M., et al. 2001, ApJ, 549, 721
- Mantegazza et al. (2001) Mantegazza, L., Antonello, E., Fugazza, D., Bossi, M., & Covino, S. 2001, A&A, 367, 759
- McAlary et al. (1984) McAlary, C. W., Madore, B. F., & Davis, L. E. 1984, ApJ, 276, 487
- Monelli et al. (2010) Monelli, M., et al. 2010, ApJ, submitted
- Nemec et al. (1988) Nemec, J. M., Wehlau, A., & Mendes de Oliveira, C. 1988, AJ, 96, 528
- Ngeow et al. (2009) Ngeow, C.-C., Kanbur, S. M., Neilson, H. R., Nanthakumar, A., & Buonaccorsi, J. 2009, ApJ, 693, 691
- Pietrinferni et al. (2004) Pietrinferni, A., Cassisi, S., Salaris, M., & Castelli, F. 2004, ApJ, 612, 168
- Pietrzyński et al. (2006) Pietrzyński, G., Gieren, W., Soszyński, I., Bresolin, F., Kudritzki, R.-P., Dall’Ora, M., Storm, J., & Bono, G. 2006, ApJ, 642, 216
- Ribas et al. (2005) Ribas, I., Jordi, C., Vilardell, F., Fitzpatrick, E. L., Hilditch, R. W., & Guinan, E. F. 2005, ApJ, 635, L37
- Rizzi et al. (2007) Rizzi, L., Tully, R. B., Makarov, D., Makarova, L., Dolphin, A. E., Sakai, S., & Shaya, E. J. 2007, ApJ, 661, 815
- Saha et al. (1992) Saha, A., Freedman, W. L., Hoessel, J. G., & Mossman, A. E. 1992, AJ, 104, 1072
- Sakai et al. (2004) Sakai, S., Ferrarese, L., Kennicutt, R. C., Jr., & Saha, A. 2004, ApJ, 608, 42
- Salaris et al. (1993) Salaris, M., Chieffi, A., & Straniero, O. 1993, ApJ, 414, 580
- Sandage (1971) Sandage, A. 1971, ApJ, 166, 13
- Sandage & Tammann (2008) Sandage, A., & Tammann, G. A. 2008, ApJ, 686, 779
- Schlegel et al. (1998) Schlegel, D. J., Finkbeiner, D. P., & Davis, M. 1998, ApJ, 500, 525
- Sirianni et al. (2005) Sirianni, M., et al. 2005, PASP, 117, 1049
- Skillman et al. (2003) Skillman, E. D., Tolstoy, E., Cole, A. A., Dolphin, A. E., Saha, A., Gallagher, J. S., Dohm-Palmer, R. C., & Mateo, M. 2003, ApJ, 596, 253
- Soszyński et al. (2003) Soszyński, I., et al. 2003, Acta Astronomica, 53, 93
- Soszyński et al. (2008a) Soszyński, I., et al. 2008a, Acta Astronomica, 58, 163
- Soszyński et al. (2008b) Soszyński, I., et al. 2008b, Acta Astronomica, 58, 293
- Stetson (1994) Stetson, P. B. 1994, PASP, 106, 250
- Tikhonov & Galazutdinova (2002) Tikhonov, N. A., & Galazutdinova, O. A. 2002, A&A, 394, 33
- Turner (1997) Turner, A. 1997, Cooking with ALLFRAME version 3.0 (Victoria: Dominion Obs.)
- Udalski et al. (1999a) Udalski, A., Soszyński, I., Szymański, M., Kubiak, M., Pietrzyński, G., Wozniak, P., & Zebrun, K. 1999a, Acta Astronomica, 49, 45
- Udalski et al. (1999b) Udalski, A., Soszyński, I., Szymański, M., Kubiak, M., Pietrzyński, G., Wozniak, P., & Zebrun, K. 1999b, Acta Astronomica, 49, 223
- Udalski et al. (1999c) Udalski, A., Szymański, M., Kubiak, M., Pietrzyński, G., Soszyński, I., Wozniak, P., & Zebrun, K. 1999c, Acta Astronomica, 49, 201
- Udalski et al. (1999d) Udalski, A., Soszyński, I., Szymański, M., Kubiak, M., Pietrzyński, G., Wozniak, P., & Zebrun, K. 1999d, Acta Astronomica, 49, 437
- Udalski et al. (2001) Udalski, A., Wyrzykowski, L., Pietrzyński, G., Szewczyk, O., Szymański, M., Kubiak, M., Soszyński, I., & Zebrun, K. 2001, Acta Astronomica, 51, 221
- van den Bergh (1968) van den Bergh, S. 1968, JRASC, 62, 145
- Welch & Stetson (1993) Welch, D. L., & Stetson, P. B. 1993, AJ, 105, 1813