Imaging the molecular gas in a submm galaxy at : cold mode accretion or a major merger?
Abstract
We present a high resolution (down to ), multi-transition imaging study of the molecular gas in the submillimeter galaxy GN20. GN20 is one of the most luminous starburst galaxy known at , and is a member of a rich proto-cluster of galaxies at in GOODS-North. We have observed the CO 1-0 and 2-1 emission with the VLA, the CO 6-5 emission with the PdBI Interferometer, and the 5-4 emission with CARMA. The H2 mass derived from the CO 1-0 emission is M⊙. High resolution imaging of CO 2-1 shows emission distributed over a large area, appearing as partial ring, or disk, of kpc diameter. The integrated CO excitation is higher than found in the inner disk of the Milky Way, but lower than that seen in high redshift quasar host galaxies and low redshift starburst nuclei. The CO 4-3 integrated line strength is more than a factor of two lower than expected for thermal excitation. The excitation can be modeled with two gas components: a diffuse, lower excitation component with a radius kpc and a filling factor , and a more compact, higher excitation component (radius kpc, filling factor ). The lower excitation component contains at least half the molecular gas mass of the system, depending on the relative conversion factor. The VLA CO 2-1 image at resolution shows resolved, clumpy structure, with a few brighter clumps with intrinsic sizes kpc. The velocity field determined from the CO 6-5 emission is consistent with a rotating disk with a rotation velocity of km s-1 (using an inclination angle of 45o), from which we derive a dynamical mass of within about 4 kpc radius. The star formation distribution, as derived from imaging of the radio synchrotron and dust continuum, is on a similar scale as the molecular gas distribution. The molecular gas and star formation are offset by from the HST I-band emission, implying that the regions of most intense star formation are highly dust-obscured on a scale of kpc. The large spatial extent and ordered rotation of this object suggests that this is not a major merger, but rather a clumpy disk accreting gas rapidly in minor mergers or smoothly from the proto-intracluster medium. Qualitatively, the kinematic and structural properties of GN20 compare well to the most rapid star-formers fed primarily by cold accretion in cosmological hydrodynamic simulations. Conversely, if GN20 is a major, gas rich merger, then some process has managed to ensure that the star formation and molecular gas distribution has not been focused into one or two compact regions.
1 Introduction
Studies of the stellar populations of elliptical galaxies imply that massive ellipticals form the bulk of their stars fairly quickly (timescales Gyr) at early epochs (). Moreover, there is a clear trend with increasing mass such that the more massive the galaxy, the earlier and quicker the star formation (see review by Renzini 2006). This conclusion is supported by studies of specific star formation rates (SFR/stellar mass), indicating ‘downsizing’ in galaxy formation, with active star formation being preferentially quenched in more massive galaxies over cosmic time (Noeske et al. 2007, 2009; Zheng et al. 2007; Pannella et al. 2009), as well as the direct observation of old stellar populations in early type galaxies at , implying formation redshifts (Collins et al. 2009; Kurk et al. 2009, Kotilainen et al. 2009; Papovich et al. 2010). These results imply that there should be a progenitor population of active, clustered star forming galaxies at high redshift.
Bright submm-selected galaxies (SMGs; mJy; see Blain et al. 2002 for a review) are an important class of source in this regard. Although they are relatively rare, with typical space densities of – Mpc-3, they have very high bolometric luminosities ( ), implying the most intense bursts of star formation known ( yr-1). While radio galaxies and quasars can reach similar or higher luminosities (Miley & de Breuck 2007; Solomon & vanden Bout 2006), the latter objects contain bright active galactic nuclei (AGN), and it is possible that some of their far-infrared emission is powered by accretion onto black holes. SMGs, on the other hand, are known to be largely star formation dominated galaxies (Alexander et al. 2005).
The emerging scenario is that SMGs may be the starburst progenitors of massive early type galaxies. These hyper-luminous high-z galaxies often trace high overdensities (Stevens et al. 2003; Aravena et al. 2009; although cf. Chapman et al. 2009), and are likely related to the formation of giant elliptical galaxies in clusters. A key question for the SMGs is: what drives the prolific star formation? Tacconi et al. (2006; 2008) argue, based on CO imaging of a sample of SMGs, that SMGs are predominantly nuclear starbursts, with median sizes (kpc), ’representing extreme, short-lived, maximum star forming events in highly dissipative mergers of gas rich galaxies.’ This conclusion is supported by VLBI imaging of the star forming regions in two SMGs (Momjian et al. 2005; 2009; 2010). We return to this question below.
The discovery of apparently old elliptical galaxies at has pushed the question of starburst progenitors of giant elliptical galaxies to even earlier epochs (Cimatti et al 2004; Wikind et al. 2008; Mobasher et al. 2005; Kriek et al. 2008; Doherty et al. 2009). The redshift distribution for about 50% of the SMG population, namely, the radio detected sources, has been shown to peak around , with most of these sources being between and 3 (Carilli & Yun 2000; Chapman et al. 2003; Wagg et al. 2009). However, there is a low redshift bias in radio-selected samples, and the question remains: is there a substantial () population of SMGs at ? These higher redshift sources would potentially pin-point very early formation of the most massive ellipticals. Early searches for SMGs at (Dannerbauer et al. 2002; 2004; 2008; Dunlop et al. 2004; Younger et al. 2007; 2008; Wang et al. 2007), were unsuccessful. However, recently, a number of SMGs have been found at , including two in the COSMOS field ( and 4.7; Capak et al. 2008; Schinnerer et al. 2008, 2009), GN10 at in GOODS-North (Daddi et al. 2009b), a SMG in the CDF-South (Coppin et al. 2009), a strongly lensed source at (Knudsen et al. 2009), and GN20, the subject of this paper. Daddi et al. (2009a) conclude, based on SMG space densities and duty cycles, that there are likely enough SMGs at to account for the known populations of old massive galaxies at to 3. They also point out that the contribution of SMGs to the comoving cosmic star formation rate density at (SFRD M⊙ yr Mpc-3) is comparable to that of Lyman break galaxies.
2 The case of GN20: an ideal laboratory for studying clustered galaxy formation within 1.5 Gyr of the Big Bang
In this paper, we present the most detailed, multi-transition, high resolution imaging study of CO emission from an SMG to date. Our study focuses on a recently discovered SMG in GOODS North, GN20, at . GN20 was originally detected at 850m by Pope et al. (2006) with a flux density of mJy. The SED from optical through radio wavelengths is well sampled, and a detailed analysis implies a hyper-luminous infrared galaxy with a total IR luminosity (8 to 1000m) of L⊙, and a dust temperature K (Daddi et al. 2009a). The SED is consistent with a star forming galaxy, with a total star formation rate (0.1 to 100 M⊙) of 3000 M⊙ yr-1 (see Section 5.1).
The HST I-band image of GN20 shows diffuse emission about 1.5 in length (Daddi et al. 2009a), although offset from the radio and submm emission by . Daddi et al. (2009a) derive a stellar mass is from IR through optical SED fitting. The rest-frame UV spectrum shows no lines, typical for SMGs, but detailed study of the broadband SEDs are consistent with the observed CO redshift (Daddi et al. 2009a).
GN20 is detected in 1.4GHz continuum emission (Morrison et al. 2009) using the VLA, and a combination of the VLA + MERLIN at higher resolution (Casey et al. 2009). The source is resolved on a scale of , with a total flux density at 1.4GHz of Jy. We re-analyze the 1.4GHz data in Section 4.4 below. High resolution imaging of the 850m emission also shows resolved structure, with a north-south extension possibly as large at 1.5 (Younger et al. 2008; Iono et al. 2006). Again, we return to these data below. The 6.2m PAH spectral feature has been detected in GN20 using Spitzer (Riechers et al. in prep).
GN20 resides in a dense cosmic environment. Most prominent are a pair of SMGs located about 20 to the southwest of GN20, designated GN20.2a and GN20.2b. The total 850m flux density for these two sources is 9.9 mJy. Daddi et al. (2009a) also find 15 B-band dropout galaxies in a 25′′ radius centered on GN20, an overdensity of a factor of 6 compared to the full GOODS-N area, which is significant at the 7 level. A spike in the redshift distribution of galaxies at is observed in all of GOODS-N (13 spectroscopic redshifts in total at this redshift). Lastly, the SMG GN10 at is located about 9′ from GN20 (Daddi et al. 2009b). Therefore, it appears that the GN20 volume has a very significant overdensity, indicating a proto-cluster environment at . Daddi et al. (2009a) estimate a total mass for this structure of . This proto-cluster presents an ideal opportunity to study massive galaxy formation within Gyr of the Big Bang.
GN20 has been detected in CO 4-3 emission, indicating large amounts of molecular gas, the requisite fuel for star formation (Daddi et al. 2009a). GN20 was not detected in CO 7-6 or [CI] 809GHz emission (Casey et al. 2009).
In this paper we present high resolution imaging of the CO emission from GN20. We observed the low order transitions (1-0 and 2-1) with the Very Large Array (VLA) down to 0.18 resolution. The low order transitions are critical for determining the total gas mass, since low redshift conversion factors of CO luminosity to H2 mass are calibrated using the low order transitions. We observed the higher order transitions (CO 6-5 and 5-4) with the Plateau de Bure Interferometer (PdBI) and the Combined Array for Research in Millimeter Astronomy (CARMA). We consider the gas excitation and physical conditions in the molecular gas, and we compare these to low and high redshift galaxies.
3 Observations
3.1 Very Large Array
We observed the GN20 field with the Very Large Array in the B (10km), C (3km), and D (1km) configurations. Observations were made of both the CO 2-1 line and the CO 1-0 line.
Figure 1 shows the spectral coverage of the 2-1 and 1-0 VLA observations relative to the CO 4-3 line profile. The CO 2-1 observations were done using two channels of 50 MHz bandwidth each, and two polarizations each. The two channels were centered at 45.585 and 45.635 GHz. These were the optimal IF settings to cover of the CO line profile, as determined from the 4-3 or 6-5, given the current correlator limitations at the VLA. These IFs miss the two edges of the emission line with this tuning. A total of about 70 hours were spent on-source for the 2-1 observations over the three configurations. About 15% of the time was spent observing the continuum at 43GHz using 100 MHz bandwidth.
The CO 1-0 emission was observed using two channels of 50 MHz bandwidth each, and two polarizations each, with the channels centered on 22.815 GHz and 22.935 GHz in the D array. The total observing time was about 20 hour. The first frequency setting covers most of the emission line (, missing the low frequency edge of the line), as shown in Figure 1. The second setting was used to obtain a sensitive limit to the continuum.
Fast switching phase calibration was employed (Carilli & Holdaway 1999) on timescales between two and three minutes using the VLA calibrator J1302+5748. Data were edited to remove time ranges of poor phase stability. The source 3C286 was used for flux density calibration. The full resolution of the B array at 23 and 45 GHz is 0.4 and 0.2, respectively. By including C and D array data, we have good UV coverage for structures up to scales of 16′′ and 8′′, respectively. After calibration and data editing, we synthesized images at various resolutions to investigate structure over this range in spatial scale. During the image processing, the synthesized beam was deconvolved down to CLEAN residuals in a CLEAN box centered on the galaxy.
3.2 Plateau de Bure Interferometer
We observed the CO 6-5 line toward GN20 in 2009 January and 2008 May, using the PdBI in its B and D configurations. At =4.055, this line is redshifted to 136.7899 GHz. Weather conditions were good for 2 mm observations. The calibration is estimated to be good within 15%.
The 2 mm receivers were tuned to 136.97 GHz to cover both the emission from GN20 and a lower- CO line from a nearby =1.5 galaxy. D configuration observations were pointed close to this nearby galaxy, resulting in a primary beam attenuation (PBA) of 2.24 at the position of GN20. B configuration observations were pointed in between GN20 and its companions, GN20.2a and GN20.2b, resulting in a PBA of 1.076 at the position of GN20. Observations were carried out in dual polarization mode, covering a total bandwidth of 1 GHz. For calibration of the data we observed standard bandpass calibrators (J0418+380, 3C273), phase/amplitude calibrators (J1044+719, J1150+497), and flux calibrators (MWC 349, 3C273).
For data reduction and analysis, the GILDAS package was used. To extract the spectral data, a combined B and D configuration dataset was used to optimize sensitivity. The spectrum was extracted directly from the uv data, fitting a circular Gaussian to the velocity-integrated line emission and then extracting the spectral data over the same area. For imaging, only B configuration data was used to optimize beam shape and resolution. After editing, the uv data were imaged with both natural (NA) and uniform (UN) baseline weightings, leading to resolutions of 0.89′′0.76′′ and 0.84′′0.67′′. The CLEAN algorithm was used for deconvolution, and applied down to 1.5 in a small box centered on the galaxy. The sensitivity achieved with the B&D configuration dataset is 0.41 mJy beam-1 per 25 km s-1 channel (NA). The sensitivity of the B configuration dataset is 0.22 mJy beam-1 per 150 km s-1 channel (UN), and 0.081/0.096 mJy beam-1 per 800 km s-1 channel (NA/UN).
3.3 CARMA
We observed the CO 5-4 transition line toward GN20 on 2009 July 10, using CARMA in E array. At =4.055, this line is redshifted to 113.999 GHz. Weather conditions were good for 3 mm observing. The nearby source 0958+655 was observed every 15 minutes for secondary amplitude and phase calibration. 3C273 was observed for bandpass calibration, and fluxes were bootstrapped relative to MWC349. Pointing was performed every 2 hr on nearby sources, using both radio and optical modes. The resulting calibration is estimated to be accurate within 15–20redshifted line frequency in the upper sideband (USB). The widest correlator mode was used, overlapping the three bands with 15 channels of 31.25 MHz width by 2 edge channels each to improve relative calibration. This leads to an effective bandwidth of 1281.25 MHz per sideband. For data reduction and analysis, the MIRIAD package was used.
4 Results
4.1 CO 1-0
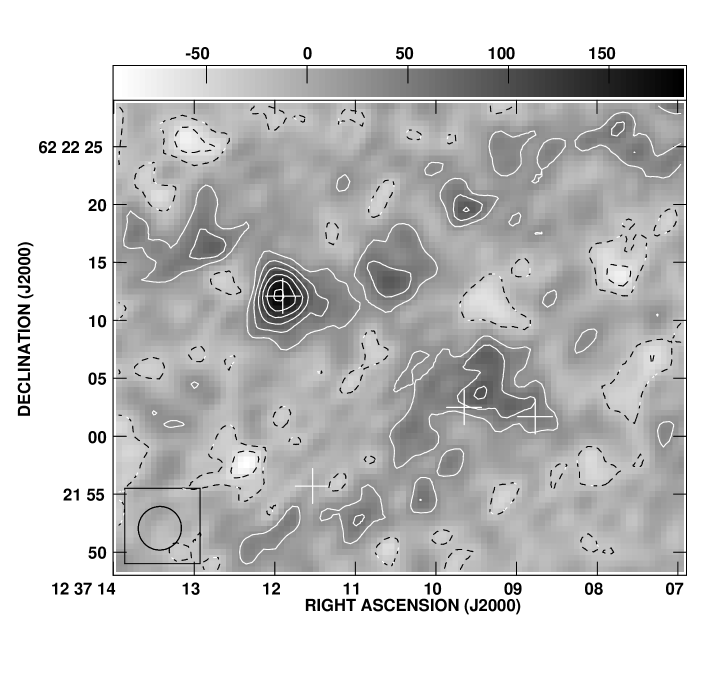
Figure 2 shows the image of the CO 1-0 emission made using the D array data at resolution. The crosses in this image show the optical positions of GN20, GN20.2a, GN20.2b, plus a Lyman-break galaxy J123711.53+622155.7. Results from all of our CO observations are summarized in Table 1.
GN20 is detected in CO 1-0 emission, with a peak surface brightness of mJy beam-1 at J123711.95+622212.2. The error quoted is the rms noise on the image (24Jy) plus a uncertainty in flux calibration estimated from the variation of the bootstrapped flux density of the phase calibrator on subsequent days, added in quadrature. A Gaussian fit to GN20 implies a slightly resolved source, with a total flux density of mJy, and a deconvolved source size FWHM = , with a major axis position angle north-south. There is an interesting diffuse structure extending southwest of GN20, and north of both GN20.2a and b, with a mean surface brightness of about 60 Jy beam-1, or about , over roughly 10. Deeper observations in D array are required to confirm the reality of this diffuse component.
The total velocity range covered is 670 km s-1, and the implied velocity integrated line intensity is Jy km s-1, after correcting for the 25% of the line that falls outside the band.
No continuum emission is seen from GN20 in the off-line 23GHz image to a 1 limit of 30Jy.
4.2 CO 2-1
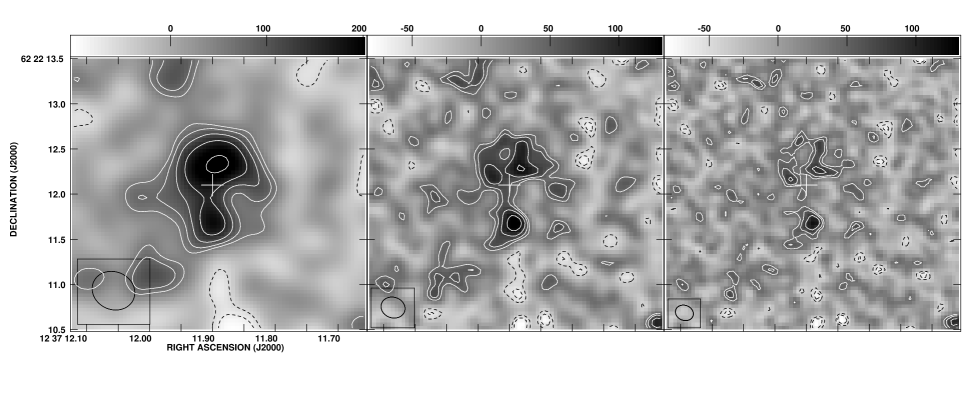
We have synthesized images of CO 2-1 emission from GN20 at three different spatial resolutions in order to investigate structure on scales ranging from up to a few arcsec. Figure 3 shows images made from the B+C+D data using a Gaussian taper of the UV data of 400 k, 900 k, and no taper, from top to bottom. Natural weighting (Cornwell, Braun, & Briggs 1999) was used in all cases. The corresponding resolutions are , , and , respectively.
At resolution (Figure 3a) the source is detected, with a total flux density in the CO 2-1 image of 0.73 mJy. The rms in this image is 36Jy beam-1. The implied velocity integrated line intensity is Jy km s-1, after correcting for the 20% of the line that falls outside the band. The source is well resolved, appearing as an incomplete ring or disk-like structure with a diameter of .
The higher resolution images (Figures 3b, c) show well resolved substructure. A Gaussian fit to the most compact knot in the resolution image, on the southern part of the disk, yields a deconvolved size of , a peak surface brightness of 0.14 mJy beam-1, and a total flux density of 0.24 mJy of the total CO 2-1 emission. The implied rest frame brightness temperature of the clump is 12K. Resolving the structure on these scales has the important implication that the CO emission in GN20 is not dominated by one or two compact ( 1kpc), high brightness temperature regions, but the emission must come from numerous, smaller clouds distributed over the disk. For comparison, recent imaging of the CO2-1 emission at similar resolution in the host galaxy of the quasar BRI 1335-0417 yielded a maximum intrinsic brightness temperature of 60K (Riechers et al. 2008).
No continuum emission is seen from GN20 in the 43GHz image at resolution to a 1 limit of 60Jy beam-1.
4.3 CO 6-5 and 5-4
The Plateau de Bure Interferometer integrated spectrum of the CO 6-5 emission from GN20 is shown in Figure 1. A Gaussian model fit to the spectral profile results in a FWHM km s-1, and an integrated flux of Jy km s-1. However, the profile itself looks more flat-topped than a Gaussian.
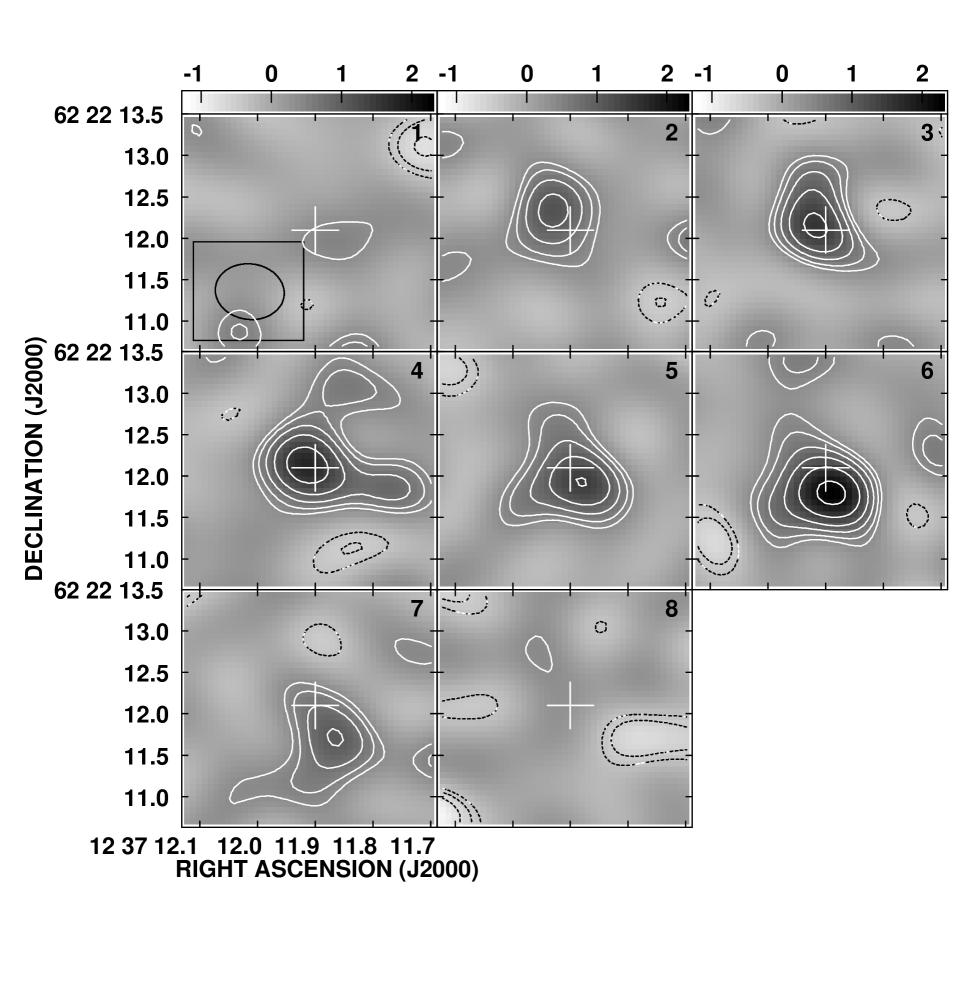
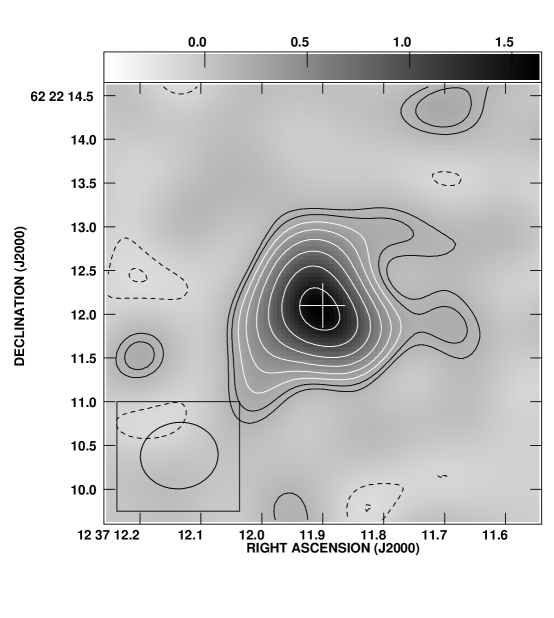
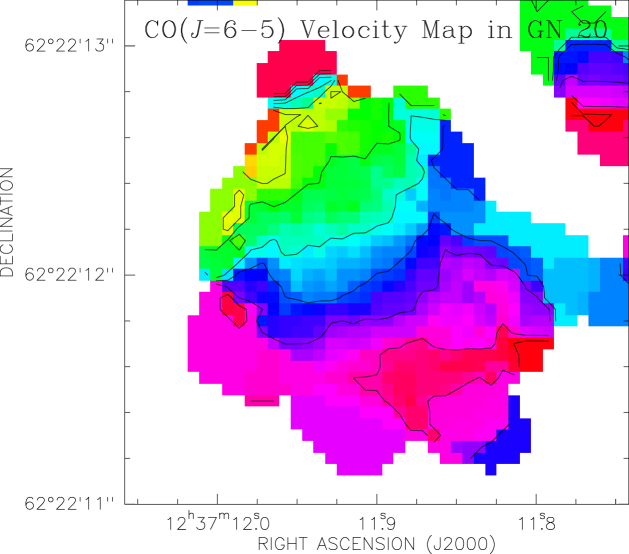
Figure 4 shows the channel images at 150 km s-1 spectral resolution, and 0.8 spatial resolution (UN weighting). Figure 5a shows the total CO 6-5 emission integrated over 800 km s-1 (NA weighting), while Figure 5b shows the moment 1 image (the intensity-weighted velocity centroid; UN weighting). The emission is resolved in space and velocity. A Gaussian fit to the total emission image results in a (deconvolved) source major axis of FWHM . The velocity channels show clear motion from northeast to southwest, with the centroid of the emission moving by about over the 750 km s-1 range.
We have convolved the CO 2-1 emission to the resolution of the 6-5 images. A Gaussian fit to the convolved 2-1 image results in an intrinsic source FWHM , as expected given the disk seen at high resolution (Figure 3). Hence, at matched resolution, the Gaussian fit CO 2-1 source size is about a factor 1.7 larger than CO 6-5. While both the low and high order CO emission is spatially extended, there is evidence that the high order emitting regions are smaller than the low order emitting regions.
We have marginally detected the CO 5-4 emission from GN20 using CARMA. The signal-to-noise is only moderate, but we are able to derive a velocity integrated flux of Jy km s-1 by averaging the channels defined by the 6-5 line profile.
The integrated continuum emission from GN20 at 137 GHz is mJy. The continuum source is resolved, with a Gaussian size of FWHM .
4.4 Comparison to optical and radio imaging
We compare the high resolution CO imaging herein with observations at other wavelengths, and compare the CO 6-5 with the CO 2-1 images.
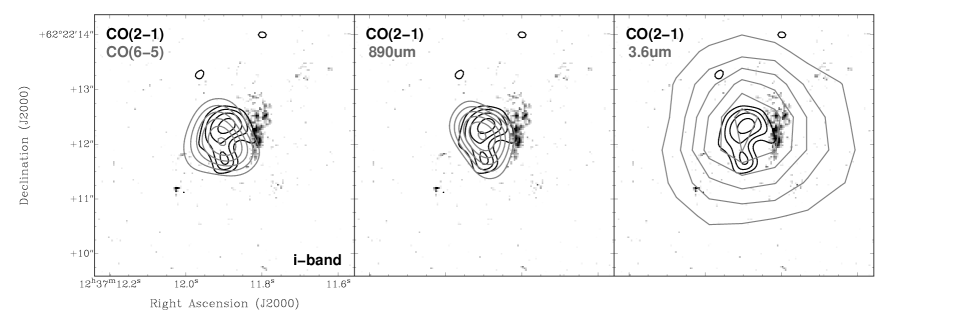
Figure 6a shows an overlay of the CO 2-1, the CO 6-5 emission, and the HST i-band image (Giavalisco et al. 2005). The CO 2-1 emitting region has a major axis area. The optical emission is complex, with a North-South filament centered about west of the CO emission and extending along the western edge of the CO emission for about . Generally, the CO falls in a minimum in the HST image, implying substantial obscuration over a scale kpc. Note that GOODS astrometry relative to the radio imaging has been shown to be accurate to better than (Daddi et al. 2007).
Figure 6b shows the same CO 2-1 and HST images, but with CO 6-5 replaced by the SMA 890m image of the rest-frame FIR continuum (Younger et al. 2008). Again, the FIR continuum emission comes from the CO emitting regions, well-offset from the rest-frame UV emission seen by the HST. The SMA image is lower resolution, but the dust emission appears to be extended in a similar manner to the CO, and fitting to the visibilities by Younger et al. (2008) implies a source that is at least in intrinsic extent, and possibly as large as .
Figure 6c shows the HST I-band and CO 2-1 images along with the IRAC 3.6m image (sampling the rest frame I-band). The IRAC image has a PSF with FWHM . The IRAC peak is offset by from the ACS imaging, and coincident with the CO peak.
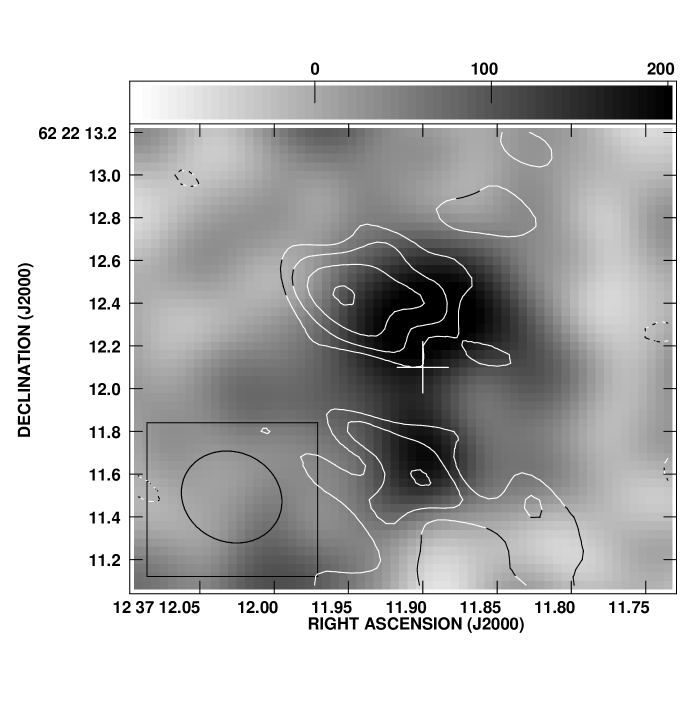
We have reanalyzed the VLA, and VLA+MERLIN, 1.4 GHz images of GN20 (Morrison et al. 2009; Casey et al. 2009). Figure 7 compares the CO 2-1 emission and the 1.4 GHz emission from the combined VLA+MERLIN data, both convolved to 0.45 resolution. A Gaussian fit to the VLA image at resolution implies a resolved source with a peak surface brightness of Jy beam-1 at J123711.885+622211.79 and a total flux density of Jy. The deconvolved source size is roughly circular, with a FWHM .
The combined MERLIN+VLA image has a resolution of FWHM = (Casey et al. 2009). Most of the emission is resolved-out at this high resolution. A Gaussian fit to the brightest knot in the image to the north yields a peak surface brightness of Jy at J123711.941+622212.43, and a total flux density of Jy. While relatively low signal to noise, the 1.4 GHz emission, presumably tracing star formation, shows a similar distribution to the CO 2-1 emission. The brightest radio peak is in the north, close to the CO knot, and showing a similar extension east-west. A second 1.4 GHz peak is seen about 1 to the south, roughly coinciding with southern CO peak. We emphasize that these two ’peaks’ comprise only about 1/3 of the total radio emission, implying that the 1.4GHz emission must be diffuse, and distributed over the disk on a scale .
5 Analysis
The observed and derived parameters for GN20 are listed in Table 1. We discuss these derivations, and other issues, in the sections below.
5.1 Star formation rate and surface density
Daddi et al. (2009a) derive a total IR luminosity from detailed SED fitting of L⊙. The implied total star formation rate is 3000 M⊙ yr-1, using a Chabrier (2003) IMF.111Using a Salpeter IMF from 0.1 to 100 M⊙, which is less top-heavy than the Chabrier IMF, would increase this star formation rate by a factor . This is also consistent with the radio flux density, assuming the standard relationship between radio luminosity and star formation rate (Yun et al. 2001).
Normalizing by the stellar mass gives a specific star formation rate of yr-1, comparable to SMGs, but an order of magnitude higher than LBGs at (Daddi et al. 2009a). The stellar mass in GN20 was derived by Daddi et al (2009a) based on the broad-band SED, including the IRAC photometry, which samples the rest-frame I-band, plus the shorter-wavelength images. In Figure 6c we found that the 3.6m emission was co-spatial with the CO. However, in Figure 6a and b we found the HST-ACS emission was clearly offset from the CO, radio continuum, and dust, ie. from the regions of highest star formation rate. Hence, obscuration clearly affects the SED, in particular at observed optical wavelengths, and caution should be used when deriving the the stellar mass from integrated SED fitting.
Imaging of the molecular gas, radio continuum, and rest-frame thermal dust continuum emission in GN20 are all consistent with the gas and star formation being distributed over a disk between 2.5 kpc and 4.5 kpc in radius. The average star formation rate per unit area is then roughly 60 yr-1 kpc-2, with a peak a factor three higher. This value is well below the Eddington-limited ”maximal starburst rate” of 1000 yr-1 kpc-2, ie. self-limited star formation due to radiation pressure on the dust grains in a self-gravitating gas disk (Thompson 2008). Such a maximal condition has been seen in the star forming cores of Galactic Giant Molecular Clouds (GMCs), the nuclei of nearby Ultraluminous Infrared Galaxies,222ULIRGs are defined as galaxies with L⊙. These galaxies are typically luminous nuclear starbursts (Downes & Solomon 1998) and in high redshift quasar host galaxies (Walter et al. 2009). For comparison, Tacconi et al. (2006) derived a typical value of 120 yr-1 kpc-2 for SMGs (corrected to the Chabrier IMF). Overall, it appears that GN20 is forming stars at a rate comfortably below the value necessary to disrupt the disk due to radiation pressure on dust.
5.2 Gas and dust mass, and surface density
Low order CO transitions are required to obtain an accurate estimate of the total gas mass, since the low redshift conversion factor of CO to H2 mass is based on CO 1-0 emission (Downes & Solomon 1998). We find the velocity integrated CO luminosity for GN20 is: L K km s-1 pc2, or .
Converting L into an H2 mass requires a mass conversion factor, . Unfortunately, this conversion factor varies across different galaxy types, and possibly within a given galaxy. Values for range from M⊙ (K km s-1 pc2)-1 for Milky Way GMCs, to 0.8 M⊙ (K km s-1 pc2)-1 for nearby ULIRGs (Downes & Solomon 1998; Solomon & Vanden Bout 2006; Daddi et al. 2010a). The value is likely a function of metalicity, excitation, and ISM pressure (Leroy et al. 2008; Bigiel et al. 2008). For SMGs, previous studies have uniformly assumed the low redshift ULIRG value, in which case we obtain an H2 mass of for GN20. The gas mass is 57% of the stellar mass estimated by Daddi et al. (2009a), although again, caution is needed when deriving stellar masses in the presence of substantial obscuration.
Our gas masses are higher than those derived by Daddi et al. (2009a) due to the fact that they assumed constant brightness temperature when extrapolating to CO 1-0 from the observed 4-3 luminosity. In the following section we show that the 4-3 line is subthermally excited.
The average gas surface density over the disk is 2400 pc-2, with some (resolved) knots a factor two or so higher. Tacconi et al. (2008) find average values in SMGs of pc-2, while maximum gas surface densities of 10,000 pc-2 are seen in the ULIRGs at low redshift (Wilson et al. 2009). For comparison, the canonical values for gas surface densities for Galactic GMCs are pc-2 on scales pc, and only get as high as 10,000 pc-2 on scales approaching those of dense molecular cores ( pc), directly associated with star formation (Solomon et al. 1987). Gas surface densities as high as 10,000 pc-2 have also been seen in the host galaxies of high redshift quasars (Riechers et al. 2009).
The ratio of total IR to L luminosity in GN20 is 181 L⊙ (K km s-1 pc2)-1. For comparison, nearby spirals typically have ratios between 20 and 100, while nearby low redshift ULIRGs, SMGs, and high redshift quasar host galaxies have ratios between 100 and 1000 (eg. Gao & Solomon 2004; Solomon & Vanden Bout 2005; Carilli et al. 2002; Wang et al. 2009; Daddi et al. 2010b). GN20 falls within the scatter of the FIR – L’CO correlation as presented in eg. Solomon & Vanden Bout (2005).
The dust mass is , derived from the SED fitting, and assuming cm2 g-1 (Hildebrand 1983). The gas to dust mass ratio in GN20 is . This is somewhat higher than the mean value for low redshift ULIRGs, of derived by Wilson et al. (2009), who also quote a typical value in the Milky Way of 150. However, we emphasize that there are significant uncertainties in both and the dust absorption coefficient when deriving the value for GN20.
5.3 CO excitation
Figure 8 shows the CO excitation ladder for GN20. We have fit these data with a standard radiative transfer, large velocity gradient (LVG) model (Scoville & Solomon 1974), ie. a model where photon trapping can be considered strictly a local phenomenon. We use the collision rates from Flower et al. (2001) with an ortho-to-para ratio of 3 and a CO abundance per velocity gradient of [CO]/ (km s-1)-1. The observed line flux densities were compared to the LVG predicted line brightness temperatures as in Weiss et al. (2007). The analysis thus yields not only the gas density and temperature, but also an estimate of the CO source solid angle, , which can be expressed in terms of the equivalent radius , i.e. the source radius if the CO were distributed in a face-on, filled circular disk.
We find that the data are poorly described by a single component fit, under-predicting by a factor two the observed CO 1-0 luminosity. The data are reasonably fit by a two component gas model, including a diffuse, lower excitation component and a more concentrated, higher excitation gas (Figure 8a). For the lower excitation component we constrain the source radius to be 4.5 kpc, based on the CO 2-1 imaging (Section 4.3). For this component, we derive a filling factor of 0.5, an H2 density of 300 cm-3, and a kinetic temperature of 30K. The low density is required to ensure that the diffuse gas does not contribute significantly to the J=4-3 or higher CO transitions. For the higher excitation component, we fix the source radius to be 2.5 kpc, based on the CO 6-5 observations (Section 4.3). We then derive a density of 6300 cm-3, a kinetic temperature of 45 K, and a filling factor of 0.13. The low excitation component contributes about half of the 1-0 emission, with a decreasing contribution to higher order emission. If we assume the same CO 1-0 to H2 mass conversion factor, this would imply about half the gas mass is in the more extended, low excitation component, and the other half is in the more compact component. We can speculate that the lower excitation component may have a higher conversion factor, more typical of the Milky Way, in which case its gas mass would be a factor five higher. However, such a high mass may violate the dynamical constraints below.
We have compared our two component CO excitation model for GN20 to the inner disk of the Milky Way, the starburst regions of NGC 253 (inner few hundred parsecs), and the FIR hyper-luminous ( L⊙) host galaxy of the quasar BR1202-0725 (see Weiss et al. 2005; Riechers et al. 2006 for details). We note that the Milky Way excitation also holds for the CO excitation in normal star forming galaxies at (Dannerbauer et al. 2009; Aravena et al. 2010). Figure 8b shows the fit CO ladder for all the sources normalized to CO 1-0. The excitation of the integrated CO emission from GN20 is higher than the Milky Way, but much lower than high redshift quasar hosts and the nuclear starburst regions of nearby galaxies.
The integrated CO ladder from GN20 implies that the CO 4-3 line strength is more than a factor two lower than expected for thermal excitation, due to a major contribution from the low excitation component at low order. Hence one should use caution before deriving total H2 masses by extrapolating to lower order transitions based on observations of CO 3-2 or higher, and assuming thermal excitation. For example, Tacconi et al. (2006) find typical densities in SMGs at to be cm-3. However, they base this conclusion on LVG fits to CO 3-2 and higher order transitions. The diffuse component in GN20 only becomes dominant in the 2-1 and 1-0 transitions, ie. the Tacconi et al. study is relevant to the compact component for the CO, but can say little about the full molecular gas reservoirs.
5.4 Dynamical mass and timescales
The CO 6-5 velocity channel maps, and moment maps, are shown in Figure 4 and 5. These show a regular velocity gradient across the disk. We interpret this as a rotating disk with an inclination angle , based on Figure 5b, although we emphasize that this estimate is uncertain. From the channel images, the total observed velocity gradient corresponds to 750 km s-1 over (section 4.2 and 4.3). This implies a rotational velocity km s-1 over kpc radius. The dynamical mass is then M⊙.
Admittedly, these numbers are approximate, and the area for the total CO mass may be a bit larger than that over which the rotation curve is measured (Section 4.4). However, it is clear that the gas mass contributes substantially ()) to the total mass of the system within 4 kpc radius. Indeed, there is little room for a much larger CO-to-H2 conversion factor. This high percentage is comparable to the typical value found for SMGs (Tacconi et al. 2006), as well as comparable to what has been found for more normal forming galaxies at (Tacconi et al. 2010; Daddi et al. 2010a), but is considerably larger than the gas fractions seen in nearby ULIRGs. The combined stellar plus gas mass is comparable to (in fact, slightly larger than), the dynamical mass, although, again, the stellar (and gas) masses are derived over a larger area than sampled by the dynamics of the CO 6-5 emission, and there remains the uncertainties of the inclination angle, gas conversion factor, and optical obscuration.
Using the gas mass and star formation rate, the gas consumption timescale ( gas mass/SFR) for GN20 is ) years. The rotational time for the disk is also years. Hence, the gas consumption timescale is comparable to the dynamical timescale in GN20. The SMG sample of Tacconi et al. (2006) have comparable gas consumption timescales to GN20. This compares to the order-of-magnitude longer gas consumption timescales found for normal star forming galaxies at (Tacconi et al. 2010; Daddi et al. 2010a).
6 Discussion
6.1 GN20
We have presented the most detailed imaging analysis to date of the CO emission from an SMG, including imaging the lower order transitions down to 1 kpc resolution. The principle physical parameters resulting from this study are listed in Table 1.
The main result from this work is that the molecular gas and star formation are well resolved on a scale kpc. The high resolution CO 2-1 imaging, in particular, shows a partial ring, or disk, on this scale. The ring shows a few resolved clumps with (deconvolved) sizes kpc, but no single clump dominates the total emission. This is also true for the 1.4 GHz continuum emission, presumably tracing star formation, which has a similar morphology to the CO emission. The higher order CO observations indicate a regular velocity field, consistent with a disk with a rotational velocity of 570 km s-1. The total H2 mass derived from the CO 1-0 emission is , which is roughly 40% of the dynamical mass within 4 kpc radius.
The entire kpc region of active star formation, as traced by the CO, FIR, and radio continuum, is completely obscured in the HST I-band (rest-frame UV) image.
The CO is lower excitation than seen in low redshift nuclear starbursts and high redshift quasar host galaxies, but it is higher than in nearby spiral galaxies and normal star forming galaxies at . The CO emission from GN20 is consistent with a two component model, consisting of a 4.5 kpc radius disk of lower density (300 cm-3), temperature (30K), with a filling factor , and a region of kpc radius with higher density ( cm-3), higher temperature (45K), and lower filling factor (). The mass is roughly equal in each component (assuming the same conversion factor). The gas depletion timescale is comparable to the rotational time of the galaxy ) years. We note that Papadopoulos et al. (2010) have proposed that dust opacity in dense regions can also affect the observed line ratios for CO, when observing very high order transitions (eg. CO6-5). High resolution imaging of the CO6-5 is required to determine the spatial dependence of gas excitation in GN20.
6.2 Star formation in GN20
Two mechanisms have been proposed in recent years for driving active star formation in high redshift galaxies: major gas rich mergers (Narayanan et al. 2009) and cold mode accretion (Dekel et al. 2009; Keres et al. 2009; Keres et al. 2005). The process of fueling nuclear starbursts via major gas rich mergers is well studied in the nearby Universe (eg. Mihos & Hernquist 1996; Barnes & Hernquist 1991). The general idea is that gravitational torques induce strong dissipation and inflow of gas, leading to an increase in the star formation rates by up to two orders of magnitude over quiescent disks on the short timescale of the merger few years. Most of this star formation occurs on scales kpc in the galaxy nuclei, as is seen in nearby ULIRGs (Downes & Solomon 1998). Major gas rich mergers have been invoked to explain the compact, maximal starbursts seen in some high redshift quasar host galaxies (Li et al. 2007; Walter et al. 2009; Riechers et al. 2009). Johansson et al. (2009) point out, if a nuclear starburst is merger-driven, the mass ratio has to be close to unity.
Tacconi et al. (2006; 2008) conclude, based on high resolution CO imaging, that SMGs are nuclear starbursts on scales kpc, driven by major gas rich mergers. However, they base this conclusion on observations of high order CO lines (3-2 and higher at sub-arcsecond resolution). In GN20 we see a more extended, lower excitation molecular gas distribution on a scale kpc, containing at least half the gas mass in the system. Interestingly, a number of other SMGs have been observed in CO 1-0: the submm-bright ERO J16450+4626 (Greve et al. 2003), SMM J13120+4242 (Hainline et al. 2006), and SMM J02399-0136 (Ivison et al. 2010). These galaxies show excess CO 1-0 emission relative to what is expected by extrapolating from higher-order transitions assuming constant brightness temperature, by factors of at least two. Moreover, VLA imaging of J16450+4626 reveals extended CO 1-0 emission on a scale of kpc (Greve et al. 2003), while for J02399-0136 the CO 1-0 emission extends over 25 kpc (Ivison et al. 2010).
An alternative model, known as cold mode accretion (CMA), or stream fed galaxy formation, has recently been proposed to explain secular star formation (ie. on timescales years) in more populous, normal star forming galaxies at (Dekel et al. 2009; Keres et al. 2009). In the CMA model, gas flows into galaxies from the IGM along cool, dense filaments. The flow never shock-heats due to the rapid cooling time, but continuously streams onto the galaxy at close to the free-fall time. This gas forms a thick, turbulent, rotating disk which efficiently forms stars across the disk, punctuated by giant clouds of enhanced star formation on scales few kpc. These star forming regions then migrate to the galaxy center via dynamical friction and viscosity, forming compact stellar bulges (Genzel et al. 2006; Genzel et al. 2008; Bournaud et al. 2008a,b; Elmegreen et al. 2009). The CMA process can lead to relatively steady and active ( M⊙ yr-1) star formation in galaxies over timescales approaching 1 Gyr. The process slows down dramatically as gas supply decreases, and the halo mass increases, generating a virial shock in the accreting gas. Subsequent dry mergers at lower redshift then lead to continued total mass build up, and morphological evolution, but little subsequent star formation (Hopkins et al. 2009; Naab et al. 2009). Observations of intermediate redshift (), normal star forming galaxies support the CMA model (Genzel et al. 2006, 2008; Daddi et al. 2008; 2009b; 2010a; Tacconi et al. 2010).
Davé et al (2009) suggest that a substantial fraction of SMGs could be fed primarily by CMA, and not major mergers. Hydrodyanamic simulations show that quite high gas accretion rates can be achieved in large halos at early epochs, and elevations of SFR over the average accretion rate by a factor 2 to 3 can be frequent owing to (common) minor mergers. While the Davé et al. study focused on , Finlator et al. (2006) studied galaxies in cosmological hydrodynamic simulations at and found two instances (within a comoving Mpc3 volume) of galaxies forming stars at M⊙ yr-1. These galaxies had stellar masses several , very similar to GN20. They were found to be forming stars at to their average rate, owing to their location at the center of the largest potential wells with constantly infalling satellite galaxies, ie. environments comparable to GN20. While their star formation rates are still a factor to 3 lower than GN20, given the uncertainties in conversion from to SFR (eg. the IMF), and uncertainties in the models, there is at least a plausible association of these simulated galaxies with GN20.
The CMA and major merger scenarios might be expected to have different structural and kinematic signatures. The ordered rotation and extended gas distribution would favor a disk that is not being strongly disturbed. The gas distribution (Figure 2) and velocity field (Figure 5) of GN20 are qualitatively similar to that seen in the simulated SMG maps in Figure 5 of Davé et al. (2009), particularly object “B” which is a quiescently star-forming thick disk, though we note that the SFR of this simulated galaxy is substantially lower than GN20. On the other hand, such signatures do not conclusively rule out a merger, as Robertson & Bullock (2008) have shown that ordered rotation of an extended gas disk can be reestablished very shortly after a major merger. Therefore we cannot make firm conclusions about the driver of star formation in GN20, although the simplest interpretation of the molecular gas data favors CMA. A key point is that, if GN20 is an on-going major gas rich merger, then some process has managed to ensure that the star formation and molecular gas distribution has not been focused into one or two compact nuclear regions.
This latter point also begs the question of the progeny of a system such as GN20, since massive (stellar masses M⊙) ’red and dead’ ellipticals at typically show fairly compact stellar distributions, with radii kpc (van Dokkum et al. 2008), although questions have been raised about morphological K-corrections and the presense of an AGN (Daddi et al. 2005). On the other hand, star forming galaxies (SFR M⊙ year-1) of this stellar mass at are often seen to have spatially extended stellar distributions, comparable to the CO size of GN20 (Kriek et al. 2009; Daddi et al. 2008; 2010a). Hence, if GN20 is to evolve into a passive elliptical at , the stellar distribution will have to evolve to a more compact configuration. Conversely, GN20 could remain a star forming galaxy for a long period, although at a substantially lower star formation rate.
A number of key observations are required to untangle the mechanisms driving star formation in GN20. First, high resolution imaging of the millimeter continuum will reveal the distribution of star formation across the disk in greater detail. Second, high resolution imaging of the high order transitions can be used to determine the spatial excitation of the molecular gas. And third, high spectral and spatial resolution imaging of the low order CO emission is required to determine the gas dynamics on both large and small scales, ie. verify the overall rotation, and determine the internal turbulent velocity and stability parameters in the disk. Shapiro et al. (2009) show that such a study of disk kinemetry enables an ’empirical differentiation between merging and non-merging systems’. These latter observations have now become possible with the Expanded Very Large Array.
6.3 Lensing
An open issue remains gravitational lensing, in particular given the partial ring-like morphology of GN20 in CO emission. An Einstein ring has been observed in CO in the strongly lensed, quasar host galaxy J2322+1944 (Carilli et al. 2003; Riechers et al. 2008). Lensing would also help explain the extreme (apparent) luminosity of GN20 (Pope et al. 2006).
To date, there is no evidence for a lensing galaxy in the HST image of GN20. This is unusual, given the depth of the HST data, and the diameter of the ring. For example, the CO Einstein ring in J2322+1944 has a similar diameter as GN20, and the lensing galaxy is seen clearly in the F814W filter image with a magnitude of 21.9. This galaxy would be easily detected in the HST I-band image of GN20. Also, the regular velocity field in the 6-5 line argues against lensing, since caustic structures can lead to complex apparent velocity structures in the image plane, as is the case for J2322+1944 (Riechers et al. 2008). Lastly, the fact that the gas mass and the dynamical mass are comparable (within a factor 2 or so), argues against very strong lensing.
| Source | J123711.89+622211.7a |
|---|---|
| S1.4GHz | Jy |
| S | Jy |
| S | Jy |
| S137GHz | mJy |
| L | |
| SFRe | 3000 yr-1 |
| S(CO 6-5) | mJy |
| FWHM (CO 6-5) | km s-1 |
| I(CO 1-0) | Jy km s-1 |
| I(CO 2-1) | Jy km s-1 |
| I(CO 4-3)f | Jy km s-1 |
| I(CO 5-4) | Jy km s-1 |
| I(CO 6-5) | Jy km s-1 |
| I(CO 7-6)g | Jy km s-1 |
| L(CO 1-0) | |
| L | K km s-1 pc-2 |
| M(H2) | |
| M | |
| M |
aPeak position at 1.4GHz at 1.7 resolution.
bContinuum 2 limit at 23 GHz at 3.5 resolution.
cContinuum 2 limit at 43 GHz at 0.5 resolution.
dThe total IR luminosity inferred from SED fitting (Daddi et al.
2009a).
eTotal star formation rate derived from the SED assuming
a Chabrier (2003) IMF.
fFrom Daddi et al. (2009a).
g2 limit from Casey et al. (2009).
hDynamical mass inside a radius of 4 kpc (Section 5.5)
iStellar mass derived by Daddi et al. (2009a).
Alexander, D., Bauer, F., Chapman, S. et al. 2005, ApJ, 632, 736
Aravena, M., Bertoldi, F., Carilli, C. et al. 2009, ApJL, in press (arXiv:0911.4297)
Aravena, M., Carilli, C., Daddi, E. et al. 2010, ApJ, submitted
Barnes, J. & Hernquist, L. 1991, ApJ, 370, 65
Bigiel, F., Walter, F., Brinks, E. et al. 2008, AJ, 136, 2846
Blain, A., Smail, I, Ivison, R., Kneib, J.-P., Frayer, D. 2002, PhR 369 111
Bournaud, F., Daddi, E., Elmegreen, B. et al. 2008a, A& A, 486, 741
Bournaud, F., Elmegreen, B., Elmegreen, D. 2008b, ApJ, 670, 237
Cornwell, T., Braun, R., Briggs, D. 1999, in ’Synthesis Imaging in Radio Astronomy II,’ eds. G. B. Taylor, C. L. Carilli, & R. A. Perley. ASP Conference Series, Vol. 180, 151
Carilli, C.L. & Holdaway, M. 1999, Radio Science, 34, 817
Carilli C.L. & Yun, M.S. 2000, ApJ, 530, 618
Carilli, C.L., Lewis, G.F., Djorgovski, S.G. et al. 2003, Science, 300, 77
Carilli, C.L, Kohno, K, Kawabe, R. et al. 2002, AJ, 123, 1838
Casey, C.M., Chapman, S., Daddi, E. et al. 2009, MNRAS, in press
Chabrier, G. 2003, PASP, 115, 763
Chapman, S., Blain, A., Ivison, R., Smail, I. 2003 Nature 422 695
Chapman, S., Blain, A., Ibata, R. et al. 2009, ApJ, 691, 560
Cimatti, A., Daddi, E., Renzini, A. et al. 2004, Nature, 430, 184
Collins, D., Stott, J.P., Hilton, M. et al. 2009, Nature, 458, 603
Coppin, K.E., Smail, I., Alexander, D. et al. 2009, MNRAS, 395, 1905
Daddi, E., Renzini, A., Pirzkal, N. et al. 2005, ApJ, 626, 680
Daddi, E., Dickinson, M., Morrison, G. et al 2007, ApJ 670 156
Daddi, E., Dannerbauer, H., Elbaz, D. et al. 2008, ApJ 673 L21
Daddi, E., Dannerbauer, H., Stern, D. et al. 2009a, ApJ, 694, 1517
Daddi, E., Dannerbauer, H., Krips, M. et al. 2009b, ApJ, 695, L176
Daddi, E., Bournaud, F., Walter, F. et al. 2010a, ApJ in press (arXiv:0911.2776)
Daddi, E., Elbaz, D., Walter, F. et al. 2010b, ApJL, submitted
Dannerbauer,H., Lehnert, M., Lutz, D. et al. 2002 ApJ 573 473
Dannerbauer, H., Lehnert, M., Lutz, D. et al. 2004, ApJ, 606, 664
Dannerbauer, H., Walter, F., Morrison, G. 2008, ApJ, 673, L127
Dannerbauer, H., Daddi, E., Riechers, D. et al. 2009, ApJ, 698, L178
Davé, Romeel, Finlator, K., Oppenheimer, B. et al. 2009, MNRAS, in press (arXiv0909.4078)
Dekel, A., Birnboim, Y., Engel, G. et al. Nature 2009, 457, 451
Downes & Solomon 1998 ApJ, 507, 615
Doherty, M., Tanaka, M., de Breuck, C. et al. 2009, A& A, in press
Dunlop, J., McCure, R., Yamada, T. et al. 2004 MNRAS 350 769
Elmegreen, B.G., Elmegreen, D.M., Fernandex, M.X., Lemonias, J.J. 2009, ApJ, 692, 12
Finlator, K., Davé, R., Papovich, C., & Hernquist, L. 2006, ApJ, 639, 672
Flower, D.R. 2001, J. Phys. B; At. Mol. Opt. Phys. 34, 1
Gao, Y., & Solomon, P. 2004, ApJS, 152, 63
Greve, T., Ivison, R., Papadopolous, P. 2003, ApJ, 599, 839
Genzel, R. Tacconi, L. J., Eisenhauer, F. et al. 2006, Nature, 442, 786
Genzel, R., Burkert, A., Bouch , N. et al. 2008, ApJ, 687, 59
Giavalisco, M., Dickinson, M., Ferguson, H. et al. 2004, ApJ, 600, L103
Hainline, L., Blain, A., Greve, T. et al. 2006, ApJ, 650, 614
Hildebrand, R.H. 1983, QJRAS, 24, 267
Hopkins, P., Bundy, K., Murray, N. et al. 2009, MNRAS, 398, 898
Iono, D., Peck, A., Pope, A. et al. 2006, ApJ, 640, L1
Ivison, R., Smail, I., Papadopoulos, P. et al. 2010, MNRAS, in press (arXiv:0912.1591)
Johansson, P, Naab, T., Burkert, A. 2009, ApJ, 690, 802
Keres, D., Katz, N., Fardal, M. et al. 2009, MNRAS, 395, 160 qq Keres, D., Katz, N., Weinberg. D., Davé, R. 2005, MNRAS, 363, 2
Knudsen, K., Kneib, J.-P., Richard, J., Petitpas, G., & Egami, E. 2009, ApJ, in press
Kotilainen, J., Falomo, R., Decarli, R. et al. 2009, ApJ, 703, 1663
Kurk, J., Cimatti, A., Zamorani, G. et al. 2009, A& A, 504, 331
Kriek, M., van der Wel, A., van Dokkum, P. et al. 2008, ApJ, 682, 896
Kriek, M., van Dokkum, P., Franx, M. et al. 2009, ApJ, 705, L71
Leroy, A., Walter, F., Brinks, E. et al. 2008, AJ, 136, 2782
Li, Y., Hernquist, L., Robertson, B. et al. 2007, ApJ, 665, 187
Mihos, C. & Hernquist, L. 1996, ApJ, 464, 641
Miley, G., & de Breuck, C. 2007, A& A Rev. 15, 67
Mobasher, B., Dickinson, M., Ferguson, H. et al. 2005, ApJ, 635, 832
Momjian, E., Riechers, D., Carilli, C. et al. 2009, AJ, in press (arXiv:1002.3324)
Momjian, E., Carilli, C. & Petric, A. 2005, AJ, 129, 1809
Morrison, G. et al. 2009, ApJ, submitted
Naab, T., Johansson, P., Ostriker, J. 2009, ApJ, 699, L178
Noeske, K.G., Weiner, B.J., Faber, S.M. et al. 2007, ApJ, 660, L43
Noeske, K.G., Faber, S.M. Weiner, B.J. et al. 2007, ApJ, 660, L47
Papadopoulos, P., Isaak, K., van der Werf,P. 2010, ApJ, submitted (arXiv:1001.3653)
Pannella, M., Carilli, C.L., Daddi, E. et al. 2009, ApJ, 698, L16
Papovich, C., Momcheva, I., Willmer, C. et al. 2010, ApJ, submitted (arXiv:1002.3158)
Pope, A., Scott, D., Dickinson, M. et al. 2006 MNRAS 370 1185
Renzini, A. 2006, ARAA, 44, 141
Riechers, D., Walter, F., Carilli, C. et al. 2006, ApJ, 650, 604
Riechers, D., Walter, F., Brewer, B. 2008, ApJ, 686, 851
Robertson, B. & Bullock, J. 2008, ApJ, 685, L27
Riechers, D., Walter, F., Carilli, C. 2009, ApJ, 703, 1338
Shapiro, K., Genzel, R., Förster-Schreiber, N. et al. 2009, ApJ, 682, 231
Schinnerer, E., Carilli, C.L., Capak, P. et al. 2008, ApJ, 689, L5
Schinnerer, E., Capak, P., Carilli, C.L. et al. 2009, submitted to A& A
Scoville, N. & Solomon, P. 1974, ApJ, 187, 67L
Solomon & Vanden Bout 2005, ARAA, 43, 677
Solomon, P., Rivolo, A., Barrett, J., & Yahil, A. 1987, 319, 730
Stevens, J, Ivison, R., Dunlop, J. et al. 2003 Nature, 425, 264
Tacconi, L., Neri, R., Chapman, S. et al. 2006, ApJ, 640, 228
Tacconi, L., Genzel, R., Smail, I., et al. 2008, ApJ, 680, 246
Tacconi, L., Genzel, R., Neri, R. et al. 2010, Nature, in press
Thompson, T. 2008, ApJ, 684, 212
Walter, F, Riechers, D., Cox, P. et al. 2009, Nature, 457, 699
Wang et al. 2007 ApJ 670 L89
Wang, R., Carilli, C., Wagg, J, et al. 2009, ApJ, submitted
Wagg, J., Owen, F., Bertoldi, F. et al. 2009, ApJ, 699, 1843
Weiss, A., Walter, F., & Scoville, N. 2005, A& A, 438, 533
Weiss, A., Downes, D., Walter, F., Henkel, C. 2007, ASPC Vol. 375, p. 25
Wiklind, T., Dickinson, M., Ferguson, H. et al. 2008, ApJ, 676, 781
Wilson, C.D. et al. 2009, ApJS, 178, 189
Younger, J., Fazio, G., Huang, J.S. et al. 2007, ApJ, 671, 1531
Younger, J., Fazio, G., Wilner, D. et al. 2008, ApJ, 688, 59
Yun, M.S., Reddy, N., Condon, J. 2001, ApJ, 554, 803
Zheng, X.Z., Bell, E.F., Papovich, C. et al. 2007, ApJ, 661, L1