Hydrogen Lyman emission through the solar cycle
Abstract
We present observations and results of radiance and irradiance studies completed by SOHO–SUMER during the past solar cycle. We find that the cycle variation in Ly irradiance as observed by e.g. UARS–SOLSTICE can not be explained by quiet sun radiance data, and conclude that the explanation must be related to differences in the Ly radiance of various solar features and changes in their fractional distribution over the solar cycle. Consequently, we studied the emission of the hydrogen Ly line in various solar features - for the first time observed by SUMER on disk in full resolution - to investigate the imprint of the magnetic field on line profile and radiance distribution. We also compare quasi-simultaneous Ly and Ly line profiles. Such high-resolution observations - not hampered by geocoronal absorption - have never been completed before.
1MPI für Sonnensystemforschung, 37191 Katlenburg-Lindau, Germany
2School of Earth and Space Sciences, Peking University, China
1. Radiance and Irradiance
The spectral solar irradiance varies with the solar cycle. The variation, which is 0.1 % in visible light, increases significantly at shorter wavelengths. It reaches 15 % at 1600 Å, 50 % at 1216 Å, a factor of 5 around 300 Å, and two orders of magnitude in X-ray (e.g., Fröhlich 2009). The variation of 50 % is also seen in SUMER Ly data; during ’Sun as a star’ observations, the spectrometer slit was pointed far off-disk many times through the solar cycle to let the spectrometer analyze the scattered light (Lemaire et al. 2005). These data are irradiance measurements, since the entire disk contributes to the scattered light (although not at an equal share).


Right: Radiance of the Lyman continuum in the quiet Sun during the rise of solar cycle 23 (cf. for details, Schühle et al. 2000).
In order to track the responsivity of the SUMER instrument and to allow intercalibration with other instruments, relatively large, standardized rasters of quiet Sun were completed until the year 2000 (so-called intercal JOPs), when it became clear that – with SUMER not doing rasters anymore – it was difficult to obtain data representative of the average quiet Sun. The results from these observations were presented by Schühle et al. (2000). If at all, only a small uptrend is seen in Fig. 2 of that paper. We assume that some of the rasters were contaminated by bright points or plage pixels, since during solar maximum large enough patches of quiet Sun were scarce and conclude, that the radiance of the average quiet Sun is more-or-less unchanged over the cycle. The variation seen in irradiance data seems to be related to the fact, that during maximum the percentage of quiet Sun regions goes down and quiet Sun is replaced by brighter stuff. It is therefore essential to study the variation of Ly radiances for different solar disk features. This was, however, not possible with standard observations, because Ly is much too bright and would saturate the detector. In 2008 SUMER found a way to overcome this problem and started unconventional observations, where 80 % of the aperture is vignetted by the partially opened door. Some of the results found so far are described below.
2. Ly and Ly comparison
Several of these rasters were completed at various angles in June, July and September 2008, when the Sun was very quiet. In April 2009 also coronal hole data was obtained. In some of the rasters, the wavelength mechanism was switched back and forth between Ly and Ly, so that quasi-simultaneous data could be recorded for those lines. The elapsed time between the exposure start of consecutive frames was only 25.3 s, and we assume only minor temporal variations of the emitting plasma; for observational details see Curdt et al. (2008 b); Tian et al. (2009 a, 2009 b). In the same exposure, we also recorded a transition region line as velocity indicator. In the case of Ly, the Doppler flow in each pixel has been determined from the 1206 Si iii line; negative values stand for upflows. The complex profile of the Ly line – the central depression leaving red and blue peaks – does not allow Doppler neasurements. We sort the Ly profiles by the Doppler flow in each pixel and define six equally spaced velocity bins. The profiles of each bin are displayed in Fig.2, left panel. The blue peak is always stronger than the red peak. Both peaks and the central reversal are offset towards the red with increasing downflow, and the asymmetry rises with increasing redshift. Similarly, we display in Fig.2, right panel the profiles of Ly. Although there is an obvious correspondence between asymmetry and downflows for both lines, it is also clear that the asymmetries of Ly and Ly are reversed. This last, not obvious, result is only slightly reproduced by Fontenla s 2002 model with stronger downflow. The relationship between asymmetry and downflows and the comparison with models would, thus, indicate the presence of a persistent downflow like that in optically thin transition region lines.
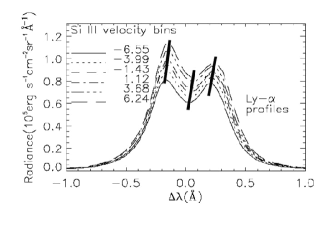
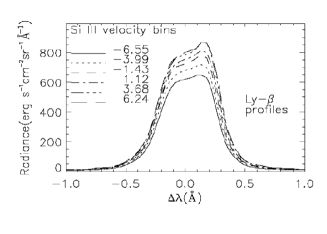
This surprising result is the combined effect of opacity and transition region downflow and has a straightforward empirical explanation: Both lines are optically thick, but the opacity in Ly is much less than that in Ly. In Ly, we can still see the redshifted footpoints shining through, and its behavior is similar to that of a transition region line, which is redshifted because of the (statistical) redhift-radiance relationship (Dammasch et al. 2003). The opacity of Ly is so high, that any directional information is lost through the partial redistribution (PRD) process. In contrast to Ly and all the higher Lyman lines, which are still dominated by redshifted emission (which narrows the blue peak), Ly is dominated by redshifted absorption (which suppresses the red peak).
We are convinced that this is the correct interpretation, and as a proof we take our recent observations in a coronal hole.
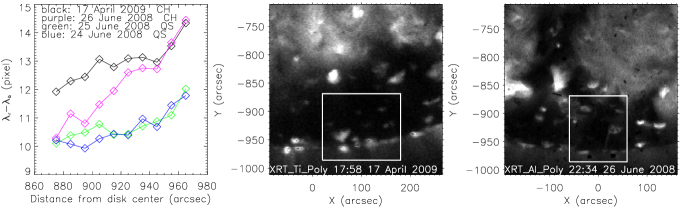
In the coronal hole we found the largest peak separation in the Ly profile (cf., Fig. 3) and the deepest self-revearsals in the Ly profile, in both cases indication of extremely high opacity (Tian et al. 2009 b). It is so high that now – similar to Ly – also Ly is observed with blue-peak asymmetry. Xia 2003 already found in his PhD work, that in coronal holes the fraction of profiles with blue-peak dominance is increased, but his results did not allow a consistent interpretation.
The photon ratio of both Lyman lines varies between 132 and 255 without a clear correspondence to the network pattern. The scatter plot of Ly versus Ly photons (not displayed here) shows a linear relationship with a slope of 188 1. This value is much higher than those reported in literature so far. It can also be used to constrain the intercalibration of both the Ly and the O vi channel of the UVCS instrument (Kohl et al. 1997).
3. The Ly profile and the magnetic field
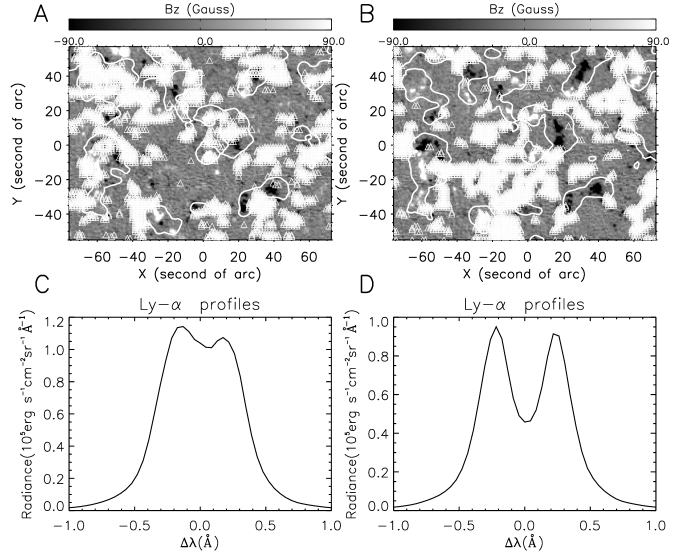
Magnetograms in grey, overlaid with Ly brightness contours (white) nicely
outline the network as shown in Fig.4. Before starting a more detailed analysis
of the profiles we applied a smooth-3 operator to the profiles in each
spatial pixel. This helped to reduce the noise and to
improve the statistics. We have sorted the pixels by the depth of their
self-revearsal, , and defined four bins separated by the quartiles,
, , and . In Fig.4, pixels in the extreme bins are marked by
white triangles111A better readable coloured version of this figure is available
under
., patches with deep
revearsal on the right side and patches with a flat profile on the left side.
It is obvious, that the deeply reversed profiles cluster in the cell interior
and the more flat profiles in the network.
This suggests a lower opacity in the network funnels made of high-lying loops
as compared to the low-lying loops in the cell interior. As mentioned before
in coronal hole spectra signatures of even higher opacity were found. Higher
opacity is equivalent to more neutral hydrogen. This could mean that the network
funnels in coronal holes do not open as wide as they do in the quiet Sun.
But also a temperature decrease would affect the degree of ionization and the
population of the ground level of neutral hydrogen.
4. Conclusion
We claim that this surprising result is not just a curiosity, but the manifestation of a fundamental mass transportation process in the quiet solar atmosphere, which Foukal (1978) introduced as the ’coronal convection’. In the ’blue branch’ material is lifted up in open or quasi-open structures. McIntosh & de Pontieu (2009) argue that this may be related to ubiquitious spicular activity. To some part this material gets trapped in bipolar loops, from where it rains down at both loop footpoints, which appear bright and redshifted. This ’red branch’ is well documented in Dammasch et al. (2003); Curdt et al. (2008 b); Marsch et al. (2008), and is also seen in it Hinode–EIS data (Tripathi et al. 2009). During phases of higher solar activity a larger portion of quiet chromospheric network is being replaced by bright plage, which consequently results in increased irradiance values.
Acknowledgments.
The SUMER project is financially supported by DLR, CNES, NASA, and the ESA PRODEX Programme (Swiss contribution). SUMER and MDI are instruments onboard SOHO, a mission operated by ESA and NASA.
References
- Curdt et al. (2008 a) Curdt, W., Tian, H., Teriaca, L., Schühle, U. & Lemaire, P. 2008 a A&A 492, L9
- Curdt et al. (2008 b) Curdt, W., Tian, H., Dwivedi, B.N., & Marsch, E. 2008 b, A&A 491, L13
- Dammasch et al. (2003) Dammasch, I.E., Curdt, W., Dwivedi, B.N., & Parenti, S. 2008, Ann. Geophys. 26, 2955
- Foukal (1978) Foukal, P. 1978, ApJ 223, 1046
- Fröhlich (2009) Fröhlich, C. 2009, A&A 501, 27
- Fontenla et al. (2002) Fontenla, J. M., Avrett, E. H., & Loeser, E. 2002, ApJ 572, 636
- Lemaire et al. (2005) Lemaire, P., Emerich, C., Vial, J.-C., Curdt, W., Schühle, U., & Wilhelm, K. 2005, AdSpR 35, 384
- Lemaire (2009) Lemaire, P. (2009), private communication
- Marsch et al. (2008) Marsch, E., Tian, H., Sun, J., Curdt, W., & Wiegelmann, T. 2008, ApJ 685, 1262
- McIntosh & de Pontieu (2009) McIntosh, S. & de Pontieu, B., 2009, ApJ, in press
- Kohl et al. (1997) Kohl, J., Noci, G., Antonucci, E., Tondello, G., et al. 1997, Sol. Phys. 175, 613
- Schühle et al. (2000) Schühle, U., Hollandt, J., Pauluhn, A., & Wilhelm, K. 2000, in proc. Solar and Space Weather Euroconference, Santa Cruz de Tenerife, ed. A. Wilson, ESA SP-463, 427
- Tian et al. (2009 a) Tian, H., Curdt, W., Marsch, E., & Schühle, U. 2009 a, A&A 504, 239
- Tian et al. (2009 b) Tian, H., Teriaca, L., Curdt, W., & Vial, J.-C. 2009 b, ApJ 703, L152
- Tripathi et al. (2009) Tripathi, D., Mason, H.E., Dwivedi, B.N., & del Zanna, G. 2009, ApJ 694, 1256
- Xia (2003) Xia, L. 2003, PhD thesis, Georg-August-Universität Göttingen