11email: sbritzen@mpifr-bonn.mpg.de 22institutetext: Department of Physics, Huazhong University of Science and Technology, Wuhan 430074, P.R. China 33institutetext: National Centre for Radio Astrophysics/TIFR, Post Bag 3, Pune University Campus, Pune, 411007, India 44institutetext: Aryabhatta Research Institute of observational sciencES (ARIES), Manora Peak, Naini Tal 263 129, India 55institutetext: Astronomy Department, University of Michigan, Ann Arbor, MI 48109-1042, USA
Understanding BL Lac objects
Abstract
Context. We present evidence that parsec-scale jets in BL Lac objects may be significantly distinct in kinematics from their counterparts in quasars.
Aims. A detailed study of the jet components’ motion reveals that the standard AGN paradigm of apparent superluminal motion does not always describe the kinematics in BL Lac objects. We study 0735+178 here to augment and improve the understanding of the peculiar motions in the jets of BL Lac objects as a class.
Methods. We analyzed 15 GHz VLBA (Very Long Baseline Array) observations (2cm/MOJAVE survey) performed at 23 epochs between 1995.27 and 2008.91. We then compared the jet kinematics with the optical and radio light curves available for this BL Lac object and point out some striking correlations between the properties of the radio knots and the features in the light curves.
Results. We found a drastic structural mode change in the VLBI jet of 0735+178, between 2000.4 and 2001.8 when its twice sharply bent trajectory turned into a linear shape. We further found that this jet had undergone a similar transition sometime between December 1981 and June 1983. A mode change, occurring in the reverse direction (between mid-1992 and mid-1995) has already been reported in the literature. These structural mode changes are found to be reflected in changed kinematical behavior of the nuclear jet, manifested as an apparent superluminal motion and stationarity of the radio knots. In addition, we found the individual mode changes to correlate in time with the maxima in the optical light curve.
Conclusions. We found for this BL Lac object a drastic change in the kinematics of the nuclear jet, i.e, transition from ’typical superluminal’ to an unusual ’stationary’ state. Interestingly, we found that this change is accompanied with a mode change in the nuclear jet’s morphology. The long sequences of VLBA images reported here for this BL Lac object do not support the commonly assumed connection between radio flux-density outbursts and the ejection of new VLBI components.
Key Words.:
BL Lacertae objects: individual: PKS 0735+178 – Radio continuum: galaxies – Techniques: interferometric1 Introduction
The strong radio source PKS 0735+178 is an optically bright classical BL Lac
object, highly variable at radio/optical wavelengths (e.g., Goyal et al.
2009 and references therein). Based on an absorption feature in the optical
spectrum, a lower redshift limit of 0.424 was established (Abraham, et al. 1991;
Stickel et al. 1993; Scarpa et al. 2000).
This is consistent with the non detection of the optical host in the HST
snapshot imaging survey by Sbarufatti et al. (2005). A companion (possible
absorber) has been detected at a projected separation of 22 kpc (Pursimo et
al. 1999). Extensive monitoring of this blazar in the radio and optical
bands revealed variability on different timescales. Periodic features of
13.8-14.2 years were found by applying the Jurkevich method to about a
century long optical monitoring data (Fan et al. 1997; Qian & Tao 2004).
Ciprini et al. (2007) reported possible detection of several shorter
time scales. In their search for intra-night optical variability on 17 nights
between 1998 and 2008, Goyal et al. (2009) did not detect on any occasion intra-night variability with an amplitude 3%, though such
amplitudes are typical for radio selected BL Lacs (Gopal-Krishna et al. 2003).
Gupta et al. (2008) claimed detection of optical variability with an
amplitude of 4.9% on one night, but since that light curve remains steady,
any such variability must be of the flicker type and not on hour-like time scale.
In the radio band, an unusual property highlighted for this BL Lac is its
remarkably flat radio spectrum, termed as “cosmic conspiracy” (Cotton et al.
1980).
1.1 Radio morphology: kpc- to pc-scale
PKS 0735+178 has been observed with radio interferometers at various
frequencies. The 1.64 GHz VLA (Very Large Array) observations by Murphy et al. (1993) revealed
a rather compact structure, slightly elongated at a position angle of
160 deg. The 5 GHz MERLIN (Multi-Element Radio Linked Interferometer Network) image taken in 1983 is dominated by a
core and also shows a very weak component to the southeast (Bth
& Zhang 1991). The core-to-component flux density ratio is 200:1 and the
position angle of the component is 160 deg - in agreement with the
VLA observations by Murphy et al. (1993). These observations established
a large misalignment between the kpc-scale and pc-scale structures of
this source by 90-100 deg.
PKS 0735+178 has been a favorite target of VLBI monitoring programs,
and striking changes in its nuclear jet are revealed from the more
than two decades of its VLBI monitoring.
Bth & Zhang (1991) imaged the source at 5 GHz with global VLBI
arrays at four epochs between 1979 and 1984. The large structural changes
thus found were interpreted by them in terms of relativistic 8)
motion of the radio knots along a curly path with a steadily decreasing
viewing angle. Particularly instructive are their VLBI images of the inner
5 mas region, taken at the epochs 1981.9 and 1983.5, which (despite
modest resolution) reveal a clear changeover from a kinky staircase
profile in 1981.9 to a straight mode in 1983.5 (see below). This
morphological transition, first noted in the present work, is discussed
in Sect. 3.
Gabuzda et al. (1994) observed the source with the VLBA at the epochs 1987.41 (5 GHz), 1990.47 (8.4 GHz), and 1992.44 (5 GHz). In all these
observations, the source revealed a straight jet extending to the northeast.
Gmez et al. (2001) present VLBA observations at 8.4 and 43
GHz between August 1996 and May 1998. Between March 1996 and May 2000 Agudo
et al. (2006) observed the source using the VLBA at frequencies between 5
and 43 GHz. The observations by Gmez et al. and Agudo et al.
show a twisted jet with two sharp apparent bends of 90 within two
milli-arcseconds of the core. Below we call this trajectory staircase mode. Between mid-1992 and mid 1995, the jet trajectory
changed again drastically from straight to staircase
(Gmez et al. 2001).
Unfortunately, no VLBI observations documenting this second transition
are available.
From early VLBI observations of this BL Lac object Bth & Zhang (1991) estimated bulk Lorentz factors of up to for the knots in the VLBI jet, moving from the core towards a stationary component located millisecond northeast of the core. A subsequent paper by Gabuzda et al. (1994) reports an apparent superluminal motion of 7.4 of one knot. After mid-1995 the components show a tendency to cluster near several jet positions, remaining stationary in time (Sects. 3 and 4.2).
1.2 The present work
The extensive VLBA coverage of this blazar at 15 GHz during 1995-2009
under the MOJAVE program allowed us to undertake a detailed probe
of structural transitions in the nuclear jet of this BL Lac object
(Sect. 3). Thus, in addition to the last documented mode change in
the pc-scale trajectory (Gmez et al. 2001), we found
clear evidence for another mode change between 2000.4 and 2001.8.
We find that from the staircase mode observed since mid 1995 the
jet trajectory has reverted to a straight morphology during the time
interval covered by our VLBA data analysis, so that the
timing of this morphological change can be pinned down to an uncertainty
of merely 1.6 years. In comparison, the uncertainty for the mode change
inferred from the data of Gmez et al. was 3 years.
According to them, the morphological transitions are most likely caused by
pressure gradients in the external medium through which the jet
propagates. We discuss this hypothesis with regard to the mode transitions
found by us. We further examine these mode transitions gleaned from the
VLBI data, as mentioned above, with regard to the observed trends in the
radio and optical light-curves of this intensively monitored blazar.
This paper is organized in the following way: we first present the results of our analysis of the archival VLBA data (MOJAVE) and point out the newly noticed correlations between the morphological and flux-density variations of this source. We then discuss our findings in the context of previously reported information about this blazar. In particular, we explore the connection between the peculiar mode changes and kinematics of its nuclear jet. Apparent transverse velocities () in this paper were calculated with the one-year WMAP (Wilkinson Microwave Anisotropy Probe) data (Spergel et al., 2003); the values adopted are ; ; . The one-year and three-year WMAP parameters are less than for mas yr-1 out to ; this is small with respect to the formal uncertainties in the apparent velocities.
2 Data analysis
We analyzed the VLBA observations for 23 epochs, taken at 15 GHz under the 2cm/MOJAVE survey between 1995 and 2009. The data were model-fitted with the difmap model-fitting routine. To each epoch’s VLBA image we attempted to fit the minimum number of components needed to describe the structure adequately to facilitate a least ambiguous component identification from epoch to epoch. For each image the model-fitting process started with a point-like source model. In order to keep the comparison of the images for different epochs simple and credible, we assumed the components to be circular; highly elliptical components are not likely anyway.
2.1 Estimation of the uncertainties
Although the use of VLBA data generally ensures a high quality, considerable variation can occur between the epochs in both the amount of data and its quality. The uncertainties were determined individually for each epoch by comparing the model-fit parameters for the sets with different numbers of components (1). For the uncertainties of the flux-density we assumed a minimum error of 5%. The positional uncertainty was determined by averaging 1/5th of the beam size and the value determined by comparing several model-fit results. For the size we adopted an uncertainty of 10%. The model fit parameters and their uncertainties are given in Tables 3 and 4. We also list there the epoch of observation, the flux-density of each fitted component and its separation from the core, the corresponding position angle, and the component size.
3 Results
Figures 6 and 7 show the images derived by us,
with the model-fit components superimposed. It is evident that the jet’s
morphology undergoes a drastic change during the time span covered by
our observations. In Fig. 6 the jet shows the twice bent
structure - the staircase mode, whereas in Fig. 7 the
jet structure is seen to have become straight.
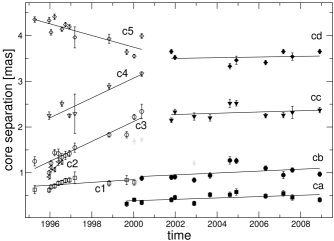
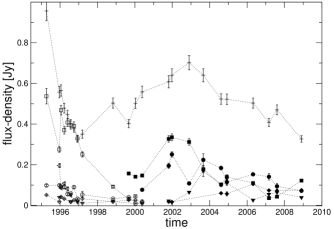
Figure 1 a) shows the variation
of core separations between the epochs 1995.27 and 2008.91 for the different components.
Striking variations in the jet kinematics are seen during
the period 1995 – 2000.4. Four jet components clearly show outward directed
motion with apparent superluminal speeds, while one component shows an
inward motion (directed towards the core) also with an apparent superluminal
speed. The apparent speeds derived from linear regressions to the
component positions are given in Table 1. From 2001.8 on, only
four components can be identified in the VLBI jet,
and the jet components are found to be stationary (Figs. 6 and
7).
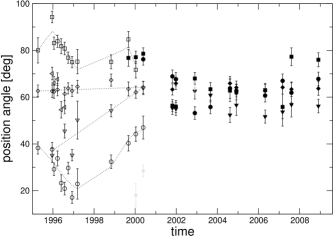
Figure 1 b) presents the position angle
(relative to the core) at different epochs for each component. Again we find a significant
change to have occured between 2000.4 and 2001.8. Between 1995 and 2000 the
position angle distribution is quite broad with values ranging from
10∘–100∘, which amounts to a wide spread of
over 90∘. After 2000.4, the position angle distribution is seen to become much narrower, with a total spread of
just about 20∘ around a mean value of 65∘.
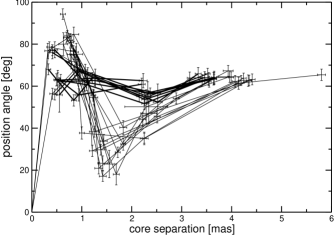
In Fig. 1 c) the relation between the core separation and
position angle is plotted for each of the 23 epochs. This plot more clearly depicts the two contrasting trends present in the VLBI images. Thus, a
different pattern is observed for the epochs before 2000.4 and after
2000.4. Prior to 2000.4 all the jet ridge lines show a similar form, with a
clear minimum at a core separation of 1.5mas, where the position angle
drops to . After 2000.4, the form of the jet ridge lines
becomes almost linear.
Thus, both the jet morphology and kinematics are found to change remarkably
between 1995 and 2009, as summarized below:
-
1.
In the staircase jet mode five radio knots/components move with apparent superluminal speeds either away from the core (four components), or towards it (one component). The position angle distribution is broad (). The jet ridge lines for all epochs before 2000.4 are similar, with a clear minimum in position angle.
-
2.
In the straight jet mode, separations of all four VLBI components from the core remain essentially unchanged; their apparent speeds are sub-luminal. The position angle distribution is narrow ().
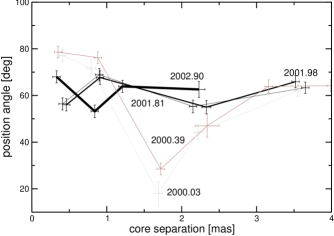
In Fig. 1 d) we present the same information as in Fig. 1 c), but for selected epochs only: the two epochs before the mode change and the first three epochs following the mode change (2001.81, 2001.98 and 2002.90). Here the different jet ridge lines for the two modes are seen more clearly. Figure 1 e) displays the evolution of flux-densities of the individual components and the core; again significant changes are observed.
| mode | Component | [mas/year] | [] |
|---|---|---|---|
| staircase | c1 | 0.03 0.01 | 0.77 0.26 |
| c2 | 0.46 0.16 | 11.87 4.16 | |
| c3 | 0.22 0.02 | 5.68 0.52 | |
| c4 | 0.22 0.04 | 5.68 1.03 | |
| c5 | -0.13 0.03 | -3.36 0.77 | |
| straight | ca | 0.01 0.01 | 0.26 0.26 |
| cb | 0.02 0.02 | 0.52 0.52 | |
| cc | 0.01 0.02 | 0.26 0.52 | |
| cd | 0.01 0.02 | 0.26 0.52 |
3.1 Morphological transitions and flux-density variability
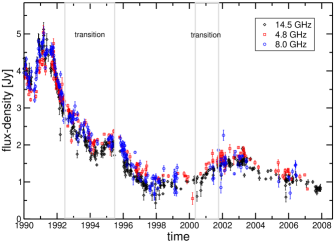
The BL Lac 0735+178 is known for its pronounced flux variability in both optical and radio bands (Ciprini et al. 2007; Goyal et al. 2009). The origin of this variability, however, is still debated. To check for a possible correlation between the optical/radio flux-density variability and the morphological transitions witnessed in the VLBI observations, we show the light curves (Figs. 1 f, 2) with the epochs of the observed mode transitions indicated by pairs of grey and black lines, respectively.
3.1.1 Radio flux variability
In Fig. 1 f) the intergrated flux-densities at 4.8, 8.0, and 14.5 GHz are plotted, monitored under the University of Michigan programme (UMRAO). The grey stripes denote the two most recent mode transition events. Based on the VLBI images reported here and in the literature (see above), one can deduce that the first of these mode transitions (straight to staircase) occured sometime between mid-1992 and mid-1995, and hence its time-scale must be less than three years. Likewise, the latest mode transition (staircase to straight) we report in this paper took less than two years. The time interval between the two transitions is 7.5 years.
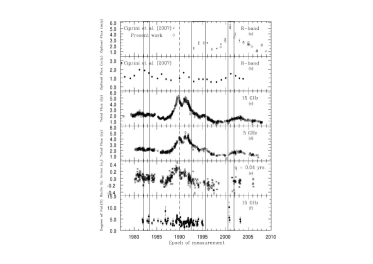
In Fig. 2 we show a plot adopted from Goyal et al. (2009) and
indicate in it all three known mode transitions within pairs of vertical
black lines. The 2001 transition occured shortly before a clear radio flare. The 1994 transition occured shortly
before a clear modest radio flare. The 1983 mode transition cannot be
related to a significant radio flare. While the corelation between the times of the transititons and
the optical flaring is convincing, the case is not so clear with regard to a possible correlation with radio flares. It seems that
for the last two transitions the radio flares are delayed with regard to the
optical flare, which could be explained by propagation effects within the source. Unfortunately only one VLBI
observation - the observation by Gabuzda et al. (1994) from 1990.47 - is available
for the time of the most prominent radio flaring around 1990. This would help to understand the relation
between the radio flaring and the morphological changes. A simultaneous monitoring of the radio and optical
flux in combination with multi radio frequency VLBI observation is required for a better understanding of the emission processes.
3.1.2 Correlation with optical flux variability
In Fig. 2(a, b) we reproduce the optical light curves from Goyal
et al. (2009), on which we have marked the three known mode transitions
mentioned above. Both staircase to straight mode changes
clearly take place near the brightness maxima. The optical flares coincident
with these two transitions
are more prominent compared to the middle flare coincident with the
opposite mode transition. We thus find that
a strong correlation exists between the structural change in
the parsec-scale jet and the optical light curve. To our knowledge, such a
correlation has not been pointed out earlier for any jet, and this
underscores the importance of long-term, coordinated VLBI and optical
monitoring of blazars.
The origin of this conspicuous correlation in this source needs to be
investigated in greater detail. This correlation could be explained
by a small change in the direction to the line of sight. This would change the
amplification of intrisinc jet bending and also allow for a more direct view into the
inner regions of the AGN. This “geometric” explanation should be explored
further.
While more subtle interpretations are possible, a simple possibility
to understand this correlated radio-optical behavior is that the
optical flare manifests an impulse by which a large amount of
kinetic power (momentum flux) is injected by the central engine into the
nuclear jet, as a result of which the jet gets stretched into a linear shape.
This explanation is related to the question of higher stability of powerful jets and the
collimation process of jets in general (e.g., Nakamura & Meier 2009).
The observed time lag between the optical flare and the disappearance
of the jet’s kink could in fact be quite small ( 1 yr), since the jet
flow in blazars is directed close to the line-of-sight, which is also the
direction of
propagation of the optical signal recorded. An alternative scenario is
presented in Sect. 4.4. Either of these two possible models will also be
required to explain the disappearance of superluminal motion following the mode
transition to a straight jet.
The proposed energetic impulse that straightens the kinky jet
could originate from the core. Assuming that 0735+178 is a helical jet,
whose components are therefore seen at different viewing angles at the times
of different mode transitions, then this could explain the connection to the
radio flares as well.
The radio flare would then not be caused by the ejection of a new component -
which is usually assumed - but by the Doppler factor changing with the
viewing angle.
4 Discussion
4.1 Morphological mode transitions
PKS 0735+178 showed a kinky jet trajectory in the VLBI observations in
December 1981 and a straight jet trajectory in June 1983. Therefter,
sometime between mid-1992 and mid-1995, the morphology changed back to
kinky with two sharp bends of (staircase mode),
within 2 msec of the core.
Between 2000.4 and 2001.8 the jet trajectory changed once again to the
straight mode, as found in the present work. Thus, three clear
mode changes of the pc-scale trajectory of this jet were observed.
The time gaps between these transitions are about 11.3 years and 7.2 years.
A simple scenario for the mode transition from kinky to straight jet
was outlined in the previous section, taking a clue from the
observed coincidences of the morphological transition events
(kinky to straight jet) with the optical flares of this blazar. Below
we present a kinematic model for the latest mode transition revealed
by our analysis of the VLBI observations taken at 23 epochs between
1995 to 2009 (Sect. 4.4).
4.2 Jet kinematics
During the staircase mode, outward and inward apparent superluminal
motion is observed. During the straight mode, the separations
of various knots/components from the core remained essentially unchanged.
Whether these components are the same or different, cannot be
decided with absolute certainty. However, should the mode transition be
caused by a changing viewing angle - a possibility argued below - the
components could be the same.
A similar phenomenon - rather stationary components relative to the core,
but moving perpendicular to the jet ridge line - was studied by us
in the two prominent BL Lac objects, 1803+784 (Britzen et al., 2009) and
0716+714 (Britzen et al., 2009). Over a time of 20 years we do find
rather slow apparent motion or stationarity for nearly all of the components
in the pc-scale jet of 1803+784. However, the components are seen to move
significantly in position angle measured from the core. The entire ridge
line of the jet thus evolves in the transverse direction, changing from a
straight line to an almost sinusoidal form and back again to a straight
line. These significant jet ridge-line changes occur
on a timescale of 8 years. A similar phenomenon was studied
by us in the highly variable BL Lac 0716+714. Here again we find rather
stationary components that do, however, show motion in position angle
and, once again, the jet’s ridge line evolves. We expect that the stationary components can be explained in terms of a geometric origin. In the past, various mechanisms were proposed to explain slow or subluminal apparent motions. Smaller apparent speeds can be obtained by a flux-weighted integration of the apparent motions
over the entire jet width (Gopal-Krishna et al. 2004). For a brief review we refer to Britzen et al. (2008) and references therein.
Different studies have reached opposite conclusions on whether BL Lac objects typically have slow or fast jet components (e.g., Gabuzda et al. 1994; Wehrle et al. 1992; Ghisellini et al. 1993; Jorstad et al. 2001). The CJF (Caltech-Jodrell Bank Flat-Spectrum) survey of 293 AGN (Britzen et al. 2008) shows some tendency for smaller apparent velocities of BL Lac objects compared to quasars. However, the small size of the BL Lac sample handicaps the comparison.
4.3 A “hybrid” between quasars and BL Lac objects?
As noted in the previous subsection, there has been an ongoing debate in recent years whether BL Lac objects and Quasars reveal similar kinematic properties or whether the apparent speeds differ significantly. According to the general picture of the AGN paradigm, fast apparent speeds with values up to 30c can be observed (e.g., Piner et al. 2006) and in almost all cases the motion is directed away from the assumed stationary core. This is in contrast to what we find in a growing number of BL Lac objects. Based on our analysis of 0735+178 presented here and the detailed studies of 1803+784 and 0716+714, it is possible that the kinematic properties are significanlty different. 0735+178 is a “hybrid” with regard to the mode changes and the accompanying kinematics - it shows ‘quasar’-like fast apparent motions at certain periods of time and then again ‘slow’ motion (as we find in BL Lac objects) at other times. Thus this source switches between the different states that we tend to associate with quasars or BL Lac objects. Due to this atypical behavior, 0735+178 can help us to understand the difference between these two types of AGN. It is often assumed that the basic difference between these two classes is based on a different line of sight to the object, with the BL Lacs being seen under the smallest angle to the line of sight (Unified Schemes). Within this scheme, it is then quite conceivable that the mode changes are caused by small changes in the angle to the line of sight, e.g., the jet bends slightly towards or away from us. Undoubtedly, 0735+178 is an extreme object since these changes of the angle can not be very considerable in the source frame. Thus, 0735+178 might already be oriented in a critical angle towards us. This would explain why this is the only source so far where these mode fluctutations have been observed.
4.4 Helix or pressure gradients in the external medium?
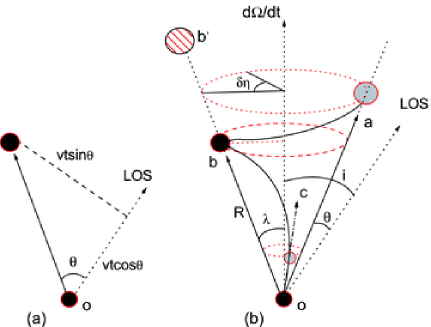
Gong (2008) proposed a non-ballistic model (see Fig. 3), in which a continuous jet produces discrete hotspots via the interaction of the relativistic outflow with the ambient medium. Thereby significant bulk energy of the jet is transferred to the swept up material. The precession of the jet axis results in the motion of hotspots at different directions along the precession cone, which resembles a hotspot moving along a ring-like trajectory. Significant bulk energy loss may occur repeatedly for a continuous jet with a fixed axis, leading to several distinct hotspots at different distances from the core. The precession of such a continuous jet results, on the other hand, in the motion of hotspot at different rings and with different precession phases (a detailed analysis is in preparation).
Under this scenario, the rectangular structure is just a state of the motion of these hotspots in different rings, which can appear and disappear depending on the precession phases of these hotspots and their projections on the sky plane. Thus, conceivably, the non-ballistic model of Gong (2008) can provide a fairly simple explanation for the appearance of the staircase mode.
Figure 4 shows the observation of the BL Lac object 0735+178 at 8.4 GHZ by Gmez et al. (2001) as well as the curves fitted to the data. The inner components K8, K6 and K5 - as defined in Gmez et al. (2001) - are fitted within the non-ballistic model (Gong 2008) by three solid curves (corresponding to ring 1, ring 2 and ring 3, respectively) at different distances to the core. The evolution of the three curves is clockwise, all of them start in 1988.47 and end in 2002.97.
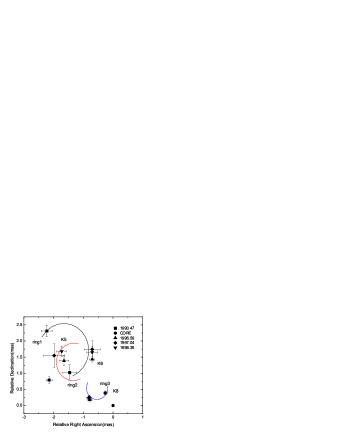
Under the simplest treatment, the non-ballistic model just gives the same opening angle for the precession cone for the three rings, . However, in this case the morphology of PKS 0735+178 cannot be fitted well.
Thanks to the scenario of the pressure gradients in the external medium through which the jet propagates (Gmez et al. 2001), it is reasonable to assume that , , can deviate from each other by a few degrees. Under these circumstances, the evolution of the staircase mode can be well fitted, as shown in Fig. 4. The input parameters to this model are given in Table 2.
| i | |||||
|---|---|---|---|---|---|
| 15.0 | 9.8 | 225.6 | 3.5 | 3.0 | 4.6 |
| 165.2 | 21.7 | -53.0 | 14.0 | 11.1 | 4.5 |
The precession speed, , is in units of deg/yr, the distance of a hotspot to the core, , is in units of mas, and all other parameters are in units of degree. is the inclination angle between the jet’s rotation axis and the line of sight; is the coordinate transformation angle; is the opening angle of the precession cone; is the initial phase.
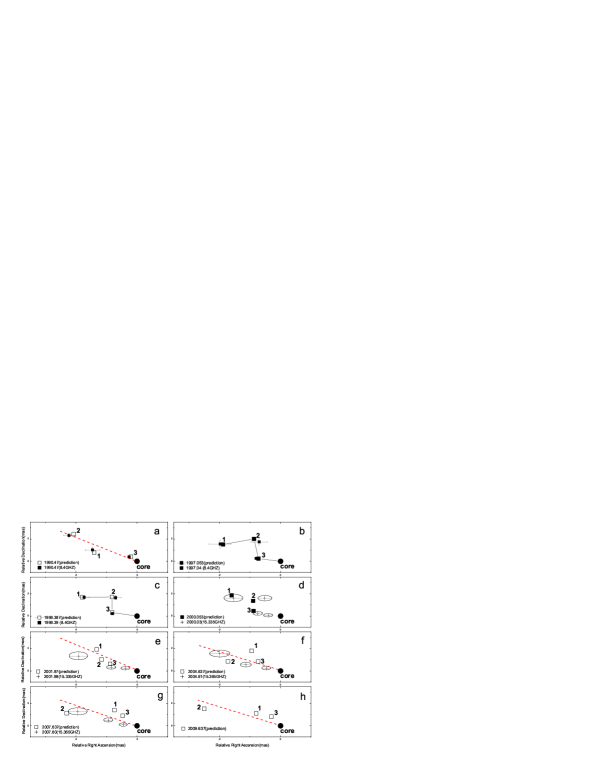
Although Fig. 5 shows the fit to the 8.4 GHz observations of Gmez et al. (2001), the theoretical trajectory (Fig. 5 h) can be extended to up to 2009.63. By doing this, the disappearance of the staircase observed at 15.335 GHz and 15.365 GHz (symbolized by the ellipses) at the end of 2001 can also be explained as shown in Fig. 5. This figure shows the evolution of the jet ridge line based on the observed morphology (filled filled squares and ellipses) and the model (open squares). For the time of 2009.637 the model prediction is shown in the last panel of this figure. This figure distinctly shows the different morphological phases of the jet ridge line as they are observed and how well they can be reproduced within the model.
Consequently, the staircase mode occurs when the hotspot precesses to certain phases so that the projected appearance is rectangular. Likewise, the staircase mode disappears when the hotspot precesses to other phases where the projection deviates from the rectangular image. Obviously, the precession of a hotspot varies the angle of the jet axis from the line of sight. This leads to a varying Doppler boosting, which explains the observed radio flux-density changes. The non-ballistic model, as outlined before, can explain the observed phenomena. When interpreted in the context of the ballistic model, the two sharp apparent bends of 90 deg should move outward as a whole relative to the core. Since each component in the staircase mode corresponds to a knot ejected previously, it should not have remained stationary. The staircase mode may induce pressure gradients in the medium through which the jet propagates, triggered by its own interaction with the ambient medium. In this case, gradual changes in the position and curvature of the jet bends near K8 and K6 with time can be expected (Gmez et al. 2001). Plausibly, such a scenario could be responsible for the small angle variations of the jet. However, to explain the two 90 degree bends would require very special conditions in the ambient medium, making it hard to understand why such an ambient medium existed only during 1992-2000, but was absent before mid-1992 and again after 2001. As pointed out by Gmez et al. (2001), the moving-component scenario suggests very non-ballistic trajectories for K5 and K6. But there are still unanswered questions concerning the origin of these non-ballistic trajectories. Are they caused by continuous or discret ejection events, and what role, if any, is played by the jet precession? Further detailed investigations and modeling is required to answer these questions.
4.5 Timescales: Flux-density variability and mode change
The three drastic mode changes are clearly correlated
with maxima in the optical light-curve. Thus we assume that the optical
emission (most likely emergent from the core) causes the change in the
trajectory. In two cases, a major long-term radio flux outburst occurs
shortly after a mode change has appeared and this can be explained within
the non-ballistic motion scenario of hotspots outlined in the previous
subsection. In the optical emission, Fan et al. (1997) and Qian & Tao (2004)
found periodic features of 13.8-14.2 years. This is roughly twice the
time interval we find here between the two mode transitions. A physical
connection between the morphological changes (mode changes) and the flux
variability in the radio and the optical regime is thus likely.
According to conventional wisdom, radio outbursts are explained as correlated with the ejection of a new radio component from the core.
However, in PKS 0735+178 we found a similar number of components over a
time span of roughly 14 years and no new components were unequivocally detected during this period. In addition, we find a correlation
with the morphological
changes described as mode changes. Furthermore, we are able to explain
the flux-density changes within the model by Gong et al. (2008) of
non-ballistically moving hotspots. Thus, it can be inferred
that in PKS 0735+178
ejection of VLBI components from the core is not required to explain
the observed (quasi-periodic) radio flaring.
We found similar results for the other well-known blazars, 1803+784 and 0716+714 - the long-term radio variability can be correlated with morphological changes in the nuclear jet and is hence also likely to be of geometric origin. We thus find in three BL Lac objects supporting evidence for a correlation between long-term radio variability and morphological changes that are likely to be of geometric origin. Additional contribution to morphological changes, particularly the more abrupt ones, could come from short bursts of power injected into the jet by the central engine, manifested by the optical flaring events.
5 Conclusions
-
•
We report a third (and the most clear) event of structural mode transition in the nuclear jet of the BL Lac object PKS 0735+178. In particular, we find that the twice sharply bent trajectory of the nuclear jet transformed into a straight jet sometime between 200.4 and 2001.8.
-
•
From a literature search we further found that a similar transition from a kinky to a straight jet is present in the VLBI observations of this source performed at 5 GHz in December 1981 and June 1983.
-
•
Contrasting kinematic properties are found associated with the two morphological modes of the nuclear jet: in the staircase mode apparent superluminal motion of the knots in the jets is observed, either directed away from the core or towards it. In the straight mode, however, the knots remain fairly stationary relative to the core. Their position angle distribution is broad in the former case ( 90∘) and narrow in the latter ( 20∘).
-
•
The time interval between the mode changes is 11.3 years between the first two mode changes and 7.2 years between the last two mode changes.
-
•
Both mode changes, from kinky to straight jet, are found to coincide with individual, well-defined peaks in the optical light-curve. This points to a causal connection between the optical flaring and the structural changes in the nuclear jet.
-
•
The last two mode changes are seen to occur shortly before major radio outbursts.
-
•
Remarkably, no new radio knot/component was observed during the entire time span (1995.27 to 2008.91) covered by the VLBI images presented in this study - the components in the staircase-mode are fairly unambiguously identifiable with the set of components witnessesd in the straight mode. A smooth transition was shown in this paper, which could be explained by a (most likely curling) jet with a changing viewing angle.
-
•
The kinematics of the VLBI knots were modeled within the non-ballistic motion scenario (Gong et al. 2008).
-
•
The long-term radio flux variability can be explained by Doppler boosting effects arising from the precession of the nuclear jet.
-
•
The model of non-ballistic motion of hotspots explains the variability of flux-density and morphology, the significant morphological changes and the unusual kinematics of the nuclear jet in PKS0735+178.
-
•
Similar kinematic properties - fairly stationary components - and a correlation between periodic ridge line changes and the long-term radio outbursts were found by some of us for two other well-known blazars: 1803+784 and 0716+714.
Acknowledgements.
This research made use of data from the MOJAVE database that is maintained by the MOJAVE team. This research made use of data from the University of Michigan Radio Astronomy Observatory, which is supported by the National Science Foundation and by funds from the University of Michigan. This research made use of the NASA/IPAC Extragalactic Database (NED) which is operated by the Jet Propulsion Laboratory, California Institute of Technology, under contract with the National Aeronautics and Space Administration. The National Radio Astronomy Observatory is a facility of the National Science Foundation operated under cooperative agreement by Associated Universities, Inc. The research of the authors Biping Gong and J.W.Zhang is supported in part by the National Natural Science Foundation of China, under grands 10778712.References
- (1) Abraham, R.G., McHardy, I.M., & Crawford, C.S. 1991, MNRAS, 252, 482
- (2) Agudo, I., Gmez, J.L., Gabuzda, D.C., et al. 2006 A&A, 453, 477
- (3) Bth, L.B. & Zhang, F.J. 1991, A&A, 243, 328
- (4) Britzen, S., Vermeulen, R.C., Campbell, R.M., et al. 2008, A&A, 484, 119
- (5) Britzen, S., Kudryavtseva, N.A., Witzel, A., et al. 2010, A&A, in press
- (6) Britzen, S., Kam, V.A., Witzel, A., Agudo, I., et al. 2009, A&A, 508, 1205
- (7) Ciprini, S., Takalo, L.O., Tosti, G., et al. 2007, A&A, 467, 465
- (8) Cotton, W.D., Wittels, J.J., Shapiro, I.I., Marcaide, J., et al. 1980, ApJ, 238, L123
- (9) Fan, J.H., Xie, G.Z., Lin, R., et al. 1997, A&AS, 125, 525
- (10) Gabuzda, D.C., Wardle, J.F.C., Roberts, D.H., et al. 1994 ApJ, 435, 128
- (11) Gmez, J.L., Guirado, J.C., Agudo, I., et al. 2001 MNRAS, 328, 873
- (12) Gong, B.P. 2008, MNRAS, 389, 315
- (13) Gopal-Krishna, Stalin, C.S., Sagar, R., Wiita, P.J. 2003, ApJ, 586, L25
- (14) Gopal-Krishna, Dhurde, S., Wiita, P.J. 2004, ApJ 615, L81
- (15) Goyal, A., Gopal-Krishna, Anupama, C., et al. 2009, MNRAS, 399, 1622
- (16) Gupta, A.C., Fan, J.H., Bai, J.M., Wagner, S.J. 2008, AJ, 135, 1384
- (17) Lister et al., 2009 AJ, 137, 3718
- (18) Nakamura, M., Meier, D.L. 2009. Proceedings of: Approaching Micro-Arcsecond Resolution with VSOP-2: Astrophysics and Technology, Y. Hagiwara, E. Fomalont, M. Tsuboi, and Y. Murata (eds.), ASP Conference Series, Vol. 402, 357
- (19) Piner, Bhattarai, D., Edwards, P. G., Jones, D. L. 2006, ApJ 640, 196
- (20) Pursimo, T., Nilsson, K., Sillanp, A., Takalo, L.O. 1999. In: Proceedings of the BL Lac Phenomenon Conference, eds. L.O. Takalo & A. Sillanp, ASP Confernence Series, 159, 385
- (21) Qian, B. & Tao, J. 2004, 2004, PASP, 116, 161
- (22) Sbarufatti, B., Treves, A., Falomo, R. 2005, ApJ, 635, 173
- (23) Scarpa, R., Urry, C.M., Falomo, R., Pesce, J.E., & Treves, A. 2000, ApJ, 532, 740
- (24) Spergel, D.N., Verde, L., Peiris, H.V., et al. 2003, ApJS, 148, 175
- (25) Stickel, M., Fried, J.W., & Kühr, H. 1993, A&AS, 98, 393


| Epoch | Flux-density [Jy] | core sep. [mas] | pos. a. [deg] | Maj. a. [mas] | Id. |
|---|---|---|---|---|---|
| 1995 Apr 7 | 0.956 0.047 | 0.00 0.00 | 0.0 0.0 | 0.170.02 | k |
| 0.537 0.038 | 0.63 0.09 | 80.0 5.4 | 0.370.04 | c1 | |
| 0.098 0.005 | 1.25 0.10 | 38.3 2.6 | 0.960.10 | c3 | |
| 0.051 0.003 | 4.35 0.06 | 62.7 2.5 | 1.470.15 | c5 | |
| 1995 Dec 15 | 0.557 0.028 | 0.00 0.00 | 0.0 0.0 | 0.190.02 | k |
| 0.275 0.014 | 0.62 0.05 | 94.3 2.5 | 0.320.03 | c1 | |
| 0.196 0.010 | 0.91 0.05 | 70.1 2.7 | 0.330.03 | c2 | |
| 0.099 0.005 | 1.00 0.05 | 37.7 2.9 | 0.730.07 | c3 | |
| 0.040 0.002 | 2.25 0.08 | 35.1 3.0 | 1.180.12 | c4 | |
| 0.018 0.001 | 4.33 0.07 | 62.6 2.7 | 0.740.07 | c5 | |
| 1996 Jan 19 | 0.565 0.028 | 0.00 0.00 | 0.0 0.0 | 0.150.02 | k |
| 0.468 0.023 | 0.69 0.05 | 83.1 2.6 | 0.430.04 | c1 | |
| 0.085 0.004 | 1.12 0.05 | 66.1 2.7 | 0.230.02 | c2 | |
| 0.093 0.005 | 1.21 0.06 | 29.2 2.7 | 0.870.09 | c3 | |
| 0.042 0.002 | 4.07 0.06 | 62.3 2.8 | 1.420.14 | c5 | |
| 1996 Mar 22 | 0.478 0.024 | 0.00 0.00 | 0.0 0.0 | 0.150.02 | k |
| 0.370 0.019 | 0.71 0.05 | 83.9 2.6 | 0.440.04 | c1 | |
| 0.109 0.005 | 1.07 0.05 | 67.7 2.7 | 0.280.03 | c2 | |
| 0.090 0.006 | 1.44 0.07 | 33.8 3.2 | 0.990.10 | c3 | |
| 0.033 0.002 | 4.41 0.06 | 63.2 2.6 | 1.340.13 | c5 | |
| 1996 May 27 | 0.446 0.022 | 0.00 0.00 | 0.0 0.0 | 0.000.10 | k |
| 0.408 0.020 | 0.77 0.05 | 81.8 3.2 | 0.380.04 | c1 | |
| 0.081 0.010 | 1.24 0.08 | 54.6 3.5 | 0.480.05 | c2 | |
| 0.055 0.006 | 1.42 0.10 | 23.3 3.5 | 0.730.07 | c3 | |
| 1996 Jul 27 | 0.402 0.020 | 0.00 0.00 | 0.0 0.0 | 0.110.10 | k |
| 0.395 0.020 | 0.79 0.05 | 80.8 2.7 | 0.480.05 | c1 | |
| 0.049 0.003 | 1.23 0.05 | 55.7 2.8 | 0.350.04 | c2 | |
| 0.058 0.003 | 1.34 0.08 | 20.9 2.7 | 0.620.06 | c3 | |
| 0.019 0.001 | 2.51 0.06 | 45.5 3.0 | 1.120.11 | c4 | |
| 0.017 0.001 | 4.14 0.05 | 61.4 2.9 | 0.520.05 | c5 | |
| 0.012 0.001 | 5.80 0.08 | 65.4 2.7 | 0.860.09 | c6 | |
| 1996 Sep 27 | 0.379 0.019 | 0.00 0.00 | 0.0 0.0 | 0.100.10 | k |
| 0.391 0.020 | 0.83 0.05 | 76.9 2.4 | 0.530.05 | c1 | |
| 0.090 0.005 | 1.38 0.09 | 29.7 2.5 | 1.030.10 | c3 | |
| 0.026 0.001 | 4.24 0.05 | 63.8 2.4 | 1.070.11 | c5 | |
| 1996 Dec 06 | 0.327 0.016 | 0.00 0.00 | 0.0 0.0 | 0.120.10 | k |
| 0.329 0.016 | 0.84 0.05 | 75.0 2.4 | 0.620.06 | c1 | |
| 0.033 0.002 | 1.42 0.07 | 17.1 2.5 | 0.550.06 | c3 | |
| 0.017 0.001 | 2.25 0.04 | 35.2 2.4 | 0.730.07 | c4 | |
| 0.021 0.001 | 4.19 0.05 | 62.7 2.4 | 0.570.06 | c5 | |
| 1997 Mar 10 | 0.350 0.020 | 0.00 0.00 | 0.0 0.0 | 0.220.02 | k |
| 0.251 0.013 | 0.89 0.13 | 75.2 5.2 | 0.660.07 | c1 | |
| 0.053 0.016 | 1.55 0.10 | 22.9 6.5 | 0.760.08 | c3 | |
| 0.011 0.002 | 2.29 0.43 | 50.2 8.1 | 0.390.04 | c4 | |
| 0.033 0.006 | 3.96 0.23 | 64.5 2.7 | 1.430.14 | c5 | |
| 1998 Oct 30 | 0.503 0.025 | 0.00 0.00 | 0.0 0.0 | 0.170.02 | k |
| 0.092 0.005 | 0.77 0.06 | 75.1 3.0 | 0.820.08 | c1 | |
| 0.033 0.002 | 1.83 0.05 | 32.4 2.9 | 1.030.10 | c3 | |
| 0.019 0.003 | 2.89 0.06 | 54.2 2.6 | 0.900.09 | c4 | |
| 0.018 0.002 | 3.93 0.10 | 67.3 2.6 | 1.010.10 | c5 | |
| 1999 Sep 1 | 0.402 0.020 | 0.00 0.00 | 0.0 0.0 | 0.170.02 | k |
| 0.157 0.008 | 0.32 0.06 | 76.8 3.6 | 0.190.02 | ca | |
| 0.031 0.006 | 0.84 0.10 | 84.7 3.4 | 0.430.04 | c1 | |
| 0.040 0.002 | 1.83 0.07 | 40.3 3.3 | 1.200.12 | c3 | |
| 0.027 0.001 | 3.64 0.06 | 63.5 3.0 | 1.100.11 | c5 | |
| 2000 Jan 11 | 0.502 0.025 | 0.00 0.00 | 0.0 0.0 | 0.100.10 | k |
| 0.141 0.007 | 0.41 0.04 | 77.1 2.6 | 0.310.03 | ca | |
| 0.045 0.003 | 0.79 0.06 | 71.7 3.5 | 0.520.05 | c1 | |
| 0.009 0.002 | 1.69 0.06 | 18.0 5.0 | 0.500.05 | x | |
| 0.009 0.001 | 2.22 0.06 | 44.2 3.1 | 0.540.05 | c3 | |
| 0.026 0.001 | 3.55 0.04 | 62.1 2.6 | 1.060.11 | c5 |
| Epoch | Flux-density [Jy] | core sep. [mas] | pos. a. [deg] | Maj. a. [mas] | Id. |
|---|---|---|---|---|---|
| 2000 May 20 | 0.558 0.028 | 0.00 0.00 | 0.0 0.0 | 0.140.01 | k |
| 0.147 0.008 | 0.35 0.05 | 78.6 2.5 | 0.310.03 | ca | |
| 0.077 0.004 | 0.88 0.05 | 76.2 2.5 | 0.510.05 | cb | |
| 0.009 0.001 | 1.72 0.05 | 28.5 2.5 | 0.770.08 | x | |
| 0.018 0.010 | 2.34 0.16 | 47.0 4.9 | 0.980.10 | c3 | |
| 0.007 0.002 | 3.16 0.05 | 63.9 2.8 | 0.500.05 | c4 | |
| 0.016 0.001 | 3.99 0.05 | 64.2 2.6 | 0.980.10 | c5 | |
| 2001 Oct 22 | 0.608 0.030 | 0.00 0.00 | 0.0 0.0 | 0.190.02 | k |
| 0.327 0.016 | 0.41 0.05 | 56.4 2.6 | 0.260.03 | ca | |
| 0.195 0.013 | 0.90 0.05 | 68.9 2.7 | 0.660.07 | cb | |
| 0.022 0.001 | 2.15 0.05 | 55.3 2.7 | 1.210.12 | cc | |
| 0.018 0.001 | 3.65 0.05 | 63.3 2.4 | 1.090.11 | cd | |
| 2001 Dec 23 | 0.640 0.032 | 0.00 0.00 | 0.0 0.0 | 0.180.10 | k |
| 0.335 0.017 | 0.46 0.05 | 56.0 2.6 | 0.250.03 | ca | |
| 0.251 0.013 | 0.91 0.05 | 67.7 2.9 | 0.780.08 | cb | |
| 0.015 0.001 | 2.33 0.06 | 55.0 2.8 | 0.980.10 | cc | |
| 0.017 0.001 | 3.52 0.05 | 65.9 2.6 | 1.260.13 | cd | |
| 2002 Nov 23 | 0.702 0.035 | 0.00 0.00 | 0.0 0.0 | 0.090.10 | k |
| 0.312 0.016 | 0.33 0.05 | 68.0 2.6 | 0.190.02 | ca | |
| 0.108 0.005 | 0.84 0.05 | 53.2 2.7 | 0.300.03 | cb | |
| 0.214 0.011 | 1.21 0.05 | 63.9 2.6 | 0.680.07 | x | |
| 0.065 0.004 | 2.23 0.08 | 62.6 3.4 | 1.630.16 | cc | |
| 2003 Aug 28 | 0.640 0.032 | 0.00 0.00 | 0.0 0.0 | 0.160.02 | k |
| 0.178 0.009 | 0.52 0.05 | 63.4 2.9 | 0.310.03 | ca | |
| 0.224 0.030 | 0.94 0.06 | 55.8 2.9 | 0.560.06 | cb | |
| 0.169 0.027 | 2.20 0.07 | 60.9 2.9 | 1.610.16 | cc | |
| 2004 Aug 9 | 0.523 0.026 | 0.00 0.00 | 0.0 0.0 | 0.170.02 | k |
| 0.103 0.008 | 0.52 0.06 | 62.8 4.7 | 0.220.02 | ca | |
| 0.184 0.009 | 1.27 0.08 | 63.8 4.3 | 0.710.07 | cb | |
| 0.101 0.008 | 2.52 0.09 | 52.4 3.2 | 1.540.15 | cc | |
| 0.060 0.003 | 3.33 0.06 | 65.9 3.0 | 0.950.10 | cd | |
| 2004 Dec 2 | 0.522 0.026 | 0.00 0.00 | 0.0 0.0 | 0.170.02 | k |
| 0.140 0.011 | 0.58 0.07 | 62.2 3.4 | 0.320.03 | ca | |
| 0.115 0.012 | 1.26 0.06 | 62.7 2.6 | 0.850.09 | cb | |
| 0.112 0.014 | 2.52 0.06 | 56.6 4.4 | 1.440.14 | cc | |
| 0.057 0.010 | 3.46 0.09 | 64.1 2.8 | 0.970.10 | cd | |
| 2006 Apr 28 | 0.503 0.025 | 0.00 0.00 | 0.0 0.0 | 0.190.02 | k |
| 0.110 0.006 | 0.49 0.05 | 63.0 2.9 | 0.360.04 | ca | |
| 0.153 0.008 | 1.10 0.05 | 60.7 2.8 | 0.650.07 | cb | |
| 0.026 0.001 | 2.25 0.05 | 51.7 2.8 | 1.580.16 | cc | |
| 0.105 0.005 | 3.41 0.05 | 62.7 2.8 | 1.300.13 | cd | |
| 2007 Mar 2 | 0.408 0.020 | 0.00 0.00 | 0.0 0.0 | 0.170.02 | k |
| 0.036 0.005 | 0.55 0.06 | 55.8 8.2 | 0.040.10 | ca | |
| 0.141 0.016 | 0.95 0.08 | 67.0 2.9 | 0.660.07 | cb | |
| 0.055 0.003 | 2.26 0.06 | 53.7 2.9 | 1.110.11 | cc | |
| 0.074 0.004 | 3.65 0.05 | 64.2 2.9 | 1.390.14 | cd | |
| 2007 Aug 9 | 0.470 0.024 | 0.00 0.00 | 0.0 0.0 | 0.200.02 | k |
| 0.043 0.003 | 0.46 0.06 | 77.3 3.8 | 0.300.03 | ca | |
| 0.094 0.014 | 1.06 0.05 | 61.9 4.3 | 0.580.06 | cb | |
| 0.064 0.013 | 2.32 0.13 | 56.8 5.3 | 1.480.15 | cc | |
| 0.072 0.006 | 3.54 0.08 | 63.4 3.1 | 1.370.14 | cd | |
| 2008 Nov 26 | 0.327 0.016 | 0.00 0.00 | 0.0 0.0 | 0.140.10 | k |
| 0.122 0.006 | 0.41 0.05 | 76.0 3.0 | 0.290.03 | ca | |
| 0.072 0.004 | 0.97 0.05 | 67.8 2.9 | 0.530.05 | cb | |
| 0.039 0.002 | 2.37 0.06 | 56.2 2.9 | 1.600.16 | cc | |
| 0.075 0.004 | 3.65 0.05 | 63.7 2.9 | 1.420.14 | cd |