Further constraining Galaxy evolution models through the Size Function of SDSS Early-type galaxies
Abstract
We discuss how the effective radius function (ERF) recently worked out by Bernardi et al. (2009) represents a new testbed to improve the current understanding of Semi-analytic Models of Galaxy formation. In particular, we here show that a detailed hierarchical model of structure formation can broadly reproduce the correct peak in the size distribution of local early-type galaxies, although it significantly overpredicts the number of very compact and very large galaxies. This in turn is reflected in the predicted size-mass relation, much flatter than the observed one, due to too large ( kpc) low-mass galaxies (), and to a non-negligible fraction of compact ( kpc) and massive galaxies (). We also find that the latter discrepancy is smaller than previously claimed, and limited to only ultracompact ( kpc) galaxies when considering elliptical-dominated samples. We explore several causes behind these effects. We conclude that the former problem might be linked to the initial conditions, given that large and low-mass galaxies are present at all epochs in the model. The survival of compact and massive galaxies might instead be linked to their very old ages and peculiar merger histories. Overall, knowledge of the galactic stellar mass and size distributions allows a better understanding of where and how to improve models.
keywords:
galaxies: structure – galaxies: formation – galaxies: evolution – cosmology: theory1 Introduction
The formation and evolution of early-type galaxies, characterized by a dominant central stellar bulge component, is still a matter of debate. The seminal paper by Eggen et al. (1962), postulated that stars are formed in a single burst of star formation from gas falling towards the center, and the evolution is passive thereafter. Such a simple scenario might be difficult to reconcile with the standard cosmological paradigm of structure formation, in which dark matter halos grow hierarchically through merging. The most advanced and up-to-date Semi-analytical models (SAMs) of galaxy formation (e.g., Cole et al., 2000; Benson et al., 2003; Granato et al., 2004, 2006; Menci et al., 2004; Cirasuolo et al., 2005; Khochfar & Burkert, 2005; Vittorini et al., 2005; Bower et al., 2006; Cattaneo et al., 2006; Croton et al., 2006; De Lucia et al., 2006; Hopkins et al., 2006; Lapi et al., 2006; Shankar et al., 2006; Monaco et al., 2007; Somerville et al., 2008; Cook et al., 2009; Fontanot et al., 2009) still do not completely agree on the type of evolution undergone by massive galaxies (see also Dekel et al. 2009), on the fraction of stellar mass formed in the initial, gas-rich burst of star formation, and on the role played by the late evolution driven by major and minor mergers. Nevertheless, all models agree that galaxies must have been much more compact at the epoch of formation, owing to a denser universe, larger gas fractions in the progenitors, and more dissipation. The latter prediction has been confirmed by a number of deep observations of high redshift galaxies (e.g., Trujillo et al., 2006; van Dokkum et al., 2008; Cimatti et al., 2008; Saracco et al., 2008), which have independently found early-type, high-redshift, massive galaxies to be a factor of a few more compact than local counterparts of the same stellar mass. Note, however, that several observational biases might limit the quality and reliability of some of these measurements (e.g., Hopkins et al., 2009d; Mancini et al., 2009; van Dokkum et al., 2009).
It is still debated how these compact galaxies have evolved from high-redshifts increasing their sizes in a way to fall on the size-mass relation we observe today. As already extensively discussed by, e.g., Shen et al. (2003), Shankar & Bernardi (2009), Shankar et al. (2009a), the scatter around the local, median - relation decreases with increasing mass and, at high stellar masses, is nearly independent of the age of the galaxies, a challenge for most galaxy evolution models. In particular, older galaxies are observed to have a steeper size-mass relation than younger systems.
One possible model put forward to explain the strong size evolution of the red, massive high- galaxies is a sequence of minor, dry mergers. Such dynamical events can “puff-up” galaxies by adding mass in their outskirts, efficiently increasing their sizes, although limiting the growth of the stellar mass within a factor of (e.g., Khochfar & Silk, 2006b; Ciotti, 2009; Bernardi, 2009; Bezanson et al., 2009; Cimatti, 2009; Hopkins et al., 2009a; Naab et al., 2009; van der Wel et al., 2009). Recent numerical simulations have however shed doubts on the actual efficiency of mergers in significantly puffing-up compact galaxies, and coherently bringing them along the rather tight structural relations observed in the local Universe (Nipoti et al., 2009). Moreover, hierarchical models suffer from the serious problem of failing in fully reproducing the local size-luminosity relation (see González et al. 2009, Shankar et al. 2009a, and references therein). Another model proposed in the recent Literature to increase the sizes of massive galaxies is by Fan et al. (2008). They postulate that the evolution of compact galaxies undergoes a two-phase expansion: a first one caused by the sudden mass loss via quasar feedback, and a second one due to the slow mass loss via stellar winds during which the system slowly evolves towards a new equilibrium. Their model is broadly consistent with the data on the local size-mass relation.
Given the large degree of freedom and significant uncertainties in current models of galaxy formation, it is necessary to look for other ways to test the validity of a given theory and/or discern ways to improve it. The aim of this paper is to provide such tests. We will show that the combined comparison with the size and mass distribution function of local galaxies can reveal interesting information on how to improve models of galaxy formation. In particular, in this work we will use a detailed hierarchical model of galaxy formation, show its failures and successes against available data, and discuss ways to improve it.
We start in § 2 describing the data set we used. In § 3 we describe the hierarchical model adopted in this paper, and present its predicted size and mass distributions for spheroid-dominated galaxies. We will discuss in some detail the origin of the discrepancies between model predictions and the data, and possible ways to improve the model. We further discuss other aspects of the model in § 4, and conclude in § 5.
2 DATA
The sample was extracted from the Data Release 4 of the Sloan Digital Sky Survey (SDSS; York et al. 2000) with parameters updated to the Data Release 6. The sample is magnitude limited to -band deVaucouleur apparent magnitude . Spheroid-dominated objects were selected by requiring the concentration index to be larger than 2.86 (Nakamura et al. 2003). In the following we will take this dataset as our reference sample for early-type galaxies to compare the models with. This sample contains galaxies and it extends over a redshift range , which corresponds to a maximum lookback time of 3 Gyr. The effective radii and magnitudes computed by the SDSS reduction pipeline system were corrected for sky subtraction problems following Hyde & Bernardi (2009a). However, as detailed in Bernardi et al. (2009), a sample selection based solely on concentration, inevitably contains some S0 and Sa galaxies. More careful cuts that provide cleaner samples are however possible (Hyde & Bernardi, 2009a, b). Therefore, in the following we will also discuss the comparison with the Hyde & Bernardi (2009a) sample dominated by ellipticals. The comparison with the latter sample is particularly meaningful for our purposes of understanding the evolution of the high-, spheroid-dominated, compact, red and dead galaxies discussed in § 1.
3 HIERARCHICAL MODELS OF GALAXY FORMATION
3.1 OVERVIEW OF THE MODEL
Bernardi et al. (2009) showed that the method applied to the samples discussed in § 2, yields the filled and open squares shown in Figure 4 for the SDSS early-type galaxies with concentration111Defined to be the ratio of the scale which contains 90% of the Petrosian light in the -band, to that which contains 50%. (top panels) and those which satisfy the Hyde & Bernardi (2009a) selection criteria (bottom panels). The left panels of Figure 4 (discussed in § 3.3) show the functions (ERF hereafter), while the right panels the stellar mass functions (SMF hereafter) of the two samples. We defer the reader to Bernardi et al. (2009) for full details on the statistical and systematic uncertainties in computing a reliable estimate of the size and stellar mass functions of early-type galaxies. We just stress here that the method is one of the most appropriate and widely used techniques to compute the statistical distribution of galaxies of a given property (either luminosity, size, or velocity dispersion) among a flux-limited sample (see, e.g., also Sheth et al. 2003). For example, as detailed in Appendix A, computing the ERF via some convolution of the luminosity function or the velocity dispersion function, provides consistent, although not as accurate, descriptions of the ERF.
We compare our empirical determination of the ERF with the predictions of the Bower et al. (2006) hierarchical model (the ‘Durham’ model). We will also briefly mention some characteristics of the De Lucia et al. (2006, the ‘MPA model’) model, although we will not compare directly with their predictions as no available measure of the spheroid sizes are available from their catalogs at the moment of writing. These models (see Parry et al. 2008 for a detailed description and comparison) follow the cosmological co-evolution of dark matter halos, subhalos, galaxies and supermassive black holes within the concordance CDM cosmology. Both models have been implemented on top of the large, high-resolution cosmological N-body simulation MILLENNIUM RUN (Springel 2005). The simulation follows the evolution of dark matter particles of mass , within a co-moving box of size Mpc on a side and force resolution of 5 , from to the present. The cosmological parameters adopted (, , , , , and ), are consistent with the combined analysis of the 2dFGRS (Colless et al. 2001) and first year WMAP data (Spergel et al. 2003). The high mass and spatial resolution of the Millennium Simulation allows to track the motion of dark matter substructures inside massive halos, making it possible to construct merging history trees of all the dark matter halos and subhalos inside the simulation box (Springel 2005). The dynamical evolution of all satellite galaxies is followed until tidal truncation and stripping disrupt their host dark matter subhalos. Then a residual survival time is estimated by computing the dynamical friction formula.
To populate the dark matter subhalos with galaxies and black holes, both models adopt a set of equations to describe the radiative cooling of gas, the star formation, metal enrichment and supernovae feedback, the growth and feedback of supermassive black holes, the UV background reionization, and the effects of galaxy mergers. A full description of the MPA and Durham models and a comparison between their main predictions with observations can be found in Bower et al. (2006), Croton et al. (2006), De Lucia et al. (2006); De Lucia & Blaizot (2007), Malbon et al. (2007), Marulli et al. (2008). In the following, we will briefly summarize the main physical assumptions about the formation and evolution of spheroidal galaxies.
In both models the morphology of a galaxy is determined by the bulge-to-total ratio of its absolute, rest frame luminosity. Usually, a galaxy is classified as early type if it has , where and are the -band magnitude of the bulge and of the whole galaxy, respectively. The star formation is assumed to be proportional to the galaxy cold gas mass. Stellar winds and supernovae reheat a gas mass proportional to the mass of the stars, increase the metallicity of the disk material and inject substantial amounts of energy into their surroundings. Both models use the stellar population synthesis model of Bruzual & Charlot (2003) to describe the stellar population properties.
The evolution of early type galaxies is then regulated by galaxy mergers, disk instabilities and AGN feedback. It is assumed that galaxy major mergers () disrupt any stellar disk present and produce a spheroidal remnant, which contain all the stars of its progenitor galaxies. The gas present in the merging galaxies forms stars in a burst, which are then added to the new spheroid. In the case of a minor merger (), the disk of the primary galaxy survives, and the stars and the gas of the satellite are added to the bulge and to the disk of the primary galaxy, respectively. While in the MPA model starbursts occur in all minor mergers, in the Durham model there is a burst only if and if the primary galaxy has . In both models AGN feedback in the radio mode further reduces or even stops late cooling flows in the halo centers. This behavior plays a key role in reproducing the exponential cut-off in the bright end of the local galaxy luminosity function, and in determining the bulge-dominated morphologies and old stellar ages of the most massive galaxies in clusters.
One key ingredient of hierarchical galaxy formation models of relevance for this paper, is how massive spheroids grow in size after they form. We here recap some of the basic model assumptions and refer to, e.g., González et al. (2009) for further details. The radius of the merger remnant is computed from energy conservation. Assuming virial equilibrium, the radius of the remnant is estimated solving the equation , with and the total internal energies of the two merging progenitors, and their orbital energy. Each galaxy is characterized by its mass and radius, estimated assuming a profile, with usually assumed for early-type galaxies. The energy of each galaxy is simply written as , with the total mass within its radius, a constant depending on the profile, and the half-mass radius. From the virial condition, the radius of the remnant obeys the condition
| (1) |
with parameterizing the (uncertain) orbital energy of the progenitors (e.g., Cole et al., 2000).
3.2 THE GROWTH OF EARLY-TYPE GALAXIES IN THE MODEL
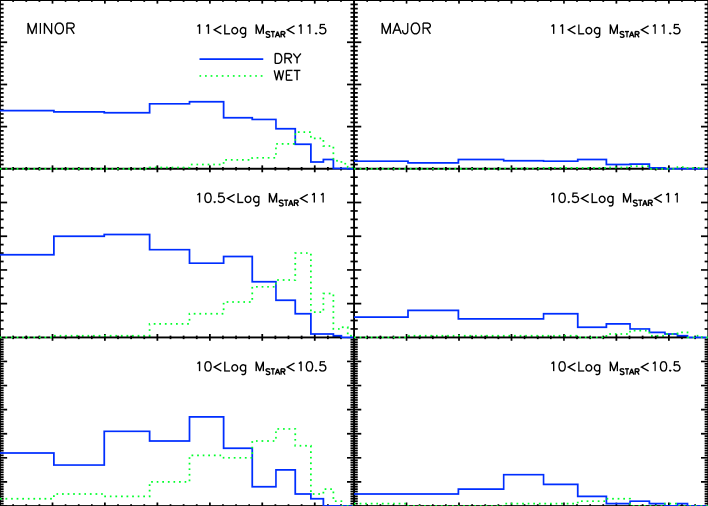
One of the main drivers for the strong evolution of bulge-dominated galaxies in size and stellar mass in hierarchical models is mergers (see also discussions in, e.g., De Lucia et al. 2006; De Lucia & Blaizot 2007; Parry et al. 2008). Figure 1 shows the mean number of wet and dry mergers per Gyr a galaxy had since its formation epoch as a function of lookback time . Each row shows the mean merger history, averaged over 100 realizations of the merger trees in the Bower et al. (2006) catalog, of galaxies with stellar mass at residing in the mass bin indicated at the top of each panel, as labeled. In the left column we plot the mean number of minor mergers, with mass ratio , while the right column shows the mean number of major mergers with mass ratio . The dotted and solid lines refer to the mean number of wet and dry mergers defined to have a cold gas-to-total mass fraction in the progenitors higher and lower than 0.15, respectively. On average, the number of dry mergers grows with final stellar mass, and galaxies that end up with tend to undergo significantly more numerous merging events than galaxies with lower final stellar mass.
We can sketch a general trend for the evolution of massive early-type galaxies in hierarchical models. A large portion of early-type galaxies is usually formed at high redshifts through a wet merger of gas-rich disk progenitors and then continued accreting stellar mass mainly through minor, dry mergers. Therefore, the epoch of formation is generally identified to be at high-, when the first starburst event took place and the central potential well was settled. We also find that a significant fraction of massive bulges is also formed through instability of gas-rich disk galaxies. Even in this case the initial size of the newly formed bulge is set by virial equilibrium and energy conservation, adopting a condition very similar to Eq. 1 (see Cole et al. 2000 for details). Irrespective of their exact formation process, most of the massive spheroids in the model kept on accreting mass and increasing their sizes through dry mergers, largely extending the epoch of stellar mass assembly. The Bower et al. (2006) model predicts that all massive early-type galaxies, on average, undergo minor mergers and major dry mergers since their formation epoch (i.e., identified as the epoch of the major wet merger among the gas-rich disk progenitors).
These late evolutionary features are a general trend for most hierarchical models. For example, we have checked that the De Lucia et al. (2006) model (see also Guo & White 2008) predicts a similar pattern for the growth of early-type galaxies, first characterized by a wet, formation phase peaked at high-redshifts, and a subsequent evolution dominated by a series of minor, dry mergers. The latter model similarly also predicts a rate of mergers increasing with increasing final stellar mass.
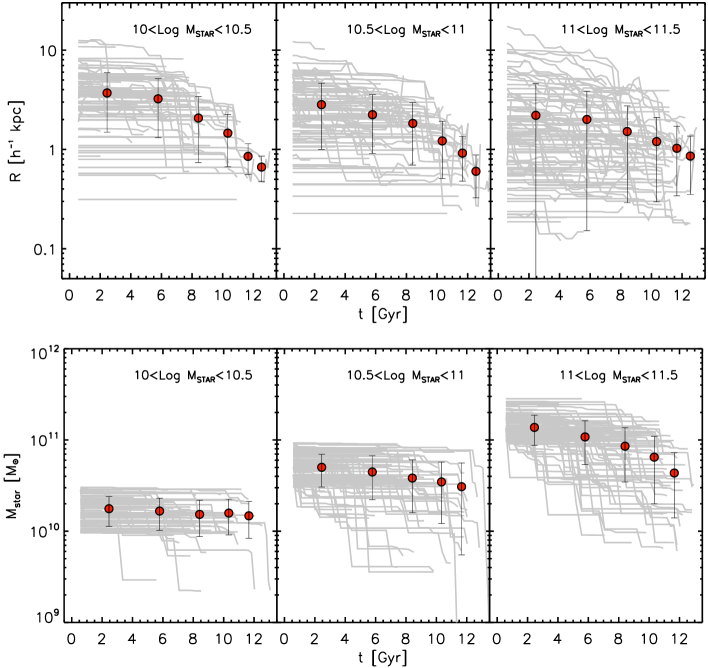
The grey lines in the upper and lower panels of Figure 2 show how the sizes and masses, respectively, change for a hundred merger histories drawn from the Bower et al. (2006) catalog, so that the final stellar mass at will fall within the mass bin labeled at the top of each panel. In each case the trees are followed back in time, choosing the most massive early-type progenitor, until this is no longer possible. We have checked that our randomly selected bulge-dominated galaxies in the model have mainly grown in mass through mergers, with disk instabilities increasing the spheroid masses by only , decreasing to for the most massive galaxies. This is clearly visible from the lower panels of Figure 2, where most of the stellar mass accretion histories remain almost flat most of the time and have sudden jumps in correspondence of merging events.
Figure 2 shows that only a small fraction of low mass objects (with ) were early-types 10 Gyrs ago, but their mass has changed little since they first became early types (%). The sizes of this population of galaxies, however, have grown by at least a factor of three over this time, as expected if their evolution is driven by minor mergers. In contrast, a larger fraction of massive galaxies had formed 10 Gyrs ago; however, whereas the mass of the population has grown by about a factor of three since then (with most of the growth occurring at lookback times greater than about 6 Gyrs), the sizes have grown by a smaller factor (). Indeed, the models predict that a substantial fraction of massive galaxies (with ) have not changed in size for a long time. More specifically, in the highest mass bin considered, we find that about 21% of the galaxies have efficiently increased their sizes by a factor greater than 3, a significant fraction of 22% remains instead extremely compact (although still growing in mass), and the rest undergoes a milder evolution with a size increase contained within a factor . We have verified that while most () of the mass growth is added via major mergers, most () of the size growth, where this actually happens, is via minor mergers. As extensively discussed in § 3.3, the survival of a non-negligible fraction of compact and massive galaxies until the present epoch is at variance with the SDSS distribution of early-type galaxies (with B/T ), and we will discuss possible causes and improvements to this problem in § 3.4.3. However, we will also show that when restricting the analysis to spheroid-dominated systems (with B/T), the predicted number density of ellipticals with size kpc is consistent with the data.
3.3 COMPARISON WITH THE SIZE AND STELLAR MASS DISTRIBUTIONS
In this section we compare the data on the size and mass distributions of SDSS early-type galaxies with the predictions of SAMs. As partly explained above, it is beyond the scope of the current paper to build an ab initio complete hierarchical model able to predict the sizes, stellar masses and velocity dispersions of early-type galaxies, which we postpone to future work. Instead, the aim here is to show the what we can learn from the simultaneous comparison with the size and mass distribution of early-type galaxies.
3.3.1 THE PREDICTED SIZE-MASS RELATION
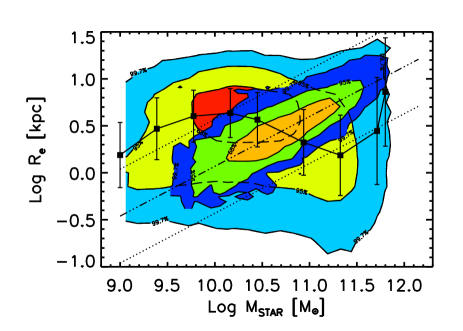
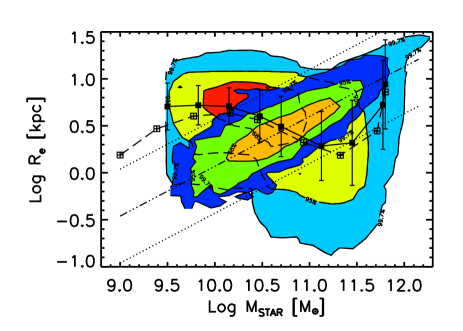
The orange, green, and blue contour levels in Figure 3 indicate the region of the size-mass plane containing 68%, 95%, and 99.7% of the whole SDSS sample of local early-type galaxies, respectively. All the contour levels have been weighted by the appropriate , as in Bernardi (2009) and Shankar & Bernardi (2009). The cyan, yellow, and red contour levels contain the 99.7%, 95% and 68% of the corresponding mock sample of local early-type galaxies from Bower et al. (2006). Figure 3 plots the Hyde & Bernardi (2009a) sample, and therefore, for consistency, we only adopt mock galaxies with . We have also checked that the mean trend and scatter in the predicted size-mass relation does not change significantly when adopting lower limits of the bulge component, such as . The solid squares with error bars show the predicted median and variances of the sizes at fixed stellar mass for the models. We find that the model predicts an increasing size when moving from the lower to the highest masses up to . However, as seen in the Figure, at stellar masses above , at variance with the data the model predicts a strong flattening in the predicted size-mass relation, while at , the sizes start increasing again with increasing stellar mass. Similar findings were also recently discussed by González et al. (2009).
Not only the observed and predicted size-mass distributions differ in slope and zero point, but also the predicted scatter (in size at fixed stellar mass or vice versa), is much larger than the observed one. Figure 3 clearly highlights the problem in the predicted size-mass relation, already noticed by some previous studies (e.g., González et al. 2009, Shankar et al. 2009a). We will show below that despite some possible improvements towards reproducing the size and mass functions, the full match to the size-mass relation remains an extremely non-trivial task for the model.
3.3.2 THE PREDICTED SIZE FUNCTION
The blue area in Figure 4a shows the Bower et al. (2006) predicted size distribution for early-type galaxies computed by counting the number of sources within a given bin of size divided by the volume of the Millennium simulation, (500 Mpc on a side, where we set to get the number density in units of Mpc3). Following González et al. (2009), we further correct the half-mass radius by a factor of 1.35, assuming that all galaxies strictly follow a de Vaucouleurs profile (see González et al. 2009 and references therein). We further divide the sizes by a factor of 0.7 to scale from the units of kpc in the model to kpc in the data. We also divide the masses in units of by 0.7 and increased them by 0.05 dex to account for the slightly different initial mass functions adopted in the model (Kennicutt 1983) and the data (Chabrier 2003; see Table 2 in Bernardi et al. 2009). We then select from the Bower et al. (2006) catalog all those galaxies with a total stellar mass above , consistent with our sample, and a prominent bulge component. The blue area in Figure 4a includes all galaxies with (lower limit) and (upper limit), which corresponds to the subsample of galaxies with a bulge-to-total stellar mass ratio of (see, e.g., Cole et al. 2000, Laurikainen et al. 2009 and references therein). As extensively discussed in González et al. (2009), a cut in the mock catalog of is equivalent to a cut in concentration of , the one adopted by Bernardi et al. (2009) to classify early-type galaxies in the sample shown with solid, filled squares in Figures 4a,b.
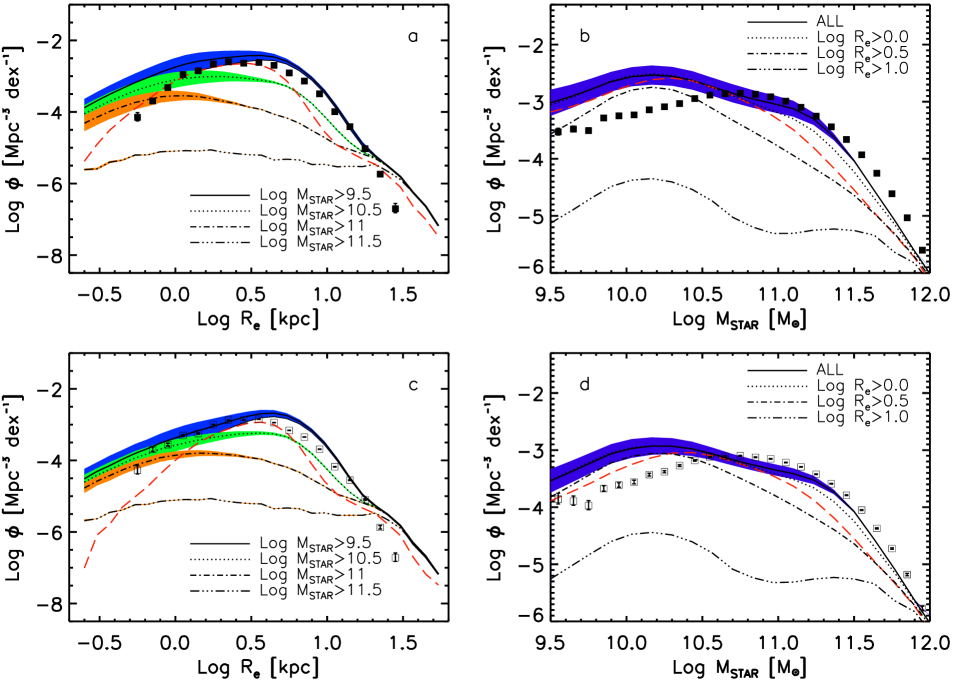
Overall, the model predicts a nearly Gaussian-shaped size distribution, with a peak around kpc, which quite closely resembles the observed one. In particular, the model predicts a sufficiently large number of intermediate-size and large galaxies ( 1 kpc) in broad agreement with data. Such a result is not trivial. The outputs of hierarchical models concerning the sizes of galaxies have been discussed several times in the Literature (see § 1). However, emphasis has been usually put on the tendency of the models to predict too many compact ( kpc) galaxies, but not much was discussed about larger galaxies. We confirm indeed that, with respect to the data, the hierarchical model considered here (see solid line in Figure 4a), shares this common feature of predicting too many, up to a factor of higher, early-type galaxies with sizes below kpc and stellar mass . On the other hand, it also predicts the number density of larger galaxies to be somewhat in better agreement with SDSS measurements, although it still overpredicts by a factor the number density of galaxies with sizes between kpc, and even more that of ultra-large galaxies with kpc. These outcomes of the model would obviously not have been evident a priori by just plotting the size-mass relation, which predicts a rather flat distribution in the median sizes, and it lends support on the importance of comparing model outputs with size distributions as well as mass functions.
Bernardi et al. (2009) showed that the sample has a significant contribution from S0 galaxies (). The latter class of galaxies has light profiles best-fitted by a combination of an exponential and a de Vaucouleurs’ profile (e.g., de Vaucouleurs 1959), which yields somewhat larger effective radii (by dex) than a pure profile. This in turn might bias the result of Figure 4a, because by assuming a pure profile for all early-type galaxies, we could have overpredicted the number of compact galaxies. We have however checked that even after increasing the sizes of all S0 mock galaxies (those with ) by 0.1 dex to match the results of Bernardi et al. (2009), the predicted ERF is very similar. We therefore conclude that the overproduction of early-type galaxies at small scales is real and inherent in the model itself.
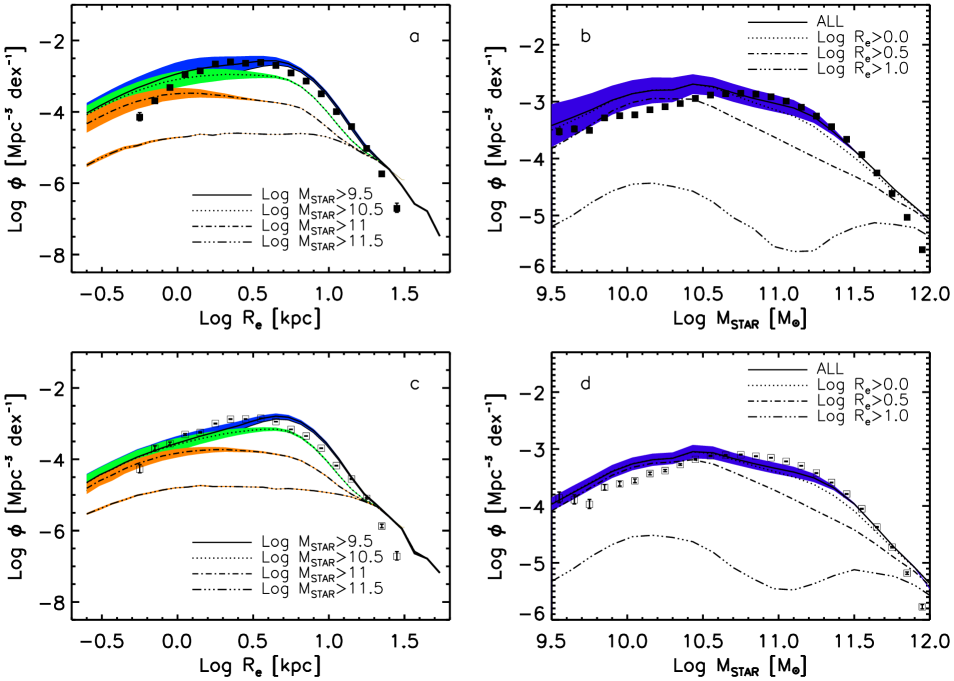
Interestingly, Figure 4c shows that when comparing to the elliptical-dominated sample by Hyde & Bernardi (2009a), characterized by a minimal contribution from S0 and Sa galaxies (open squares), the overproduction of compact galaxies is significantly reduced, and possibly confined to only ultracompact ( kpc) galaxies. For this comparison we used mock galaxies with , roughly the minimum in the Hyde & Bernardi (2009a) sample (solid line with blue area). When moving from the to the Hyde & Bernardi (2009a) sample, the shapes of the observed and predicted ERF are similar: while the observed ERF only slightly decreases in normalization, the predicted size function significantly drops below kpc, better matching the data.
Trujillo et al. (2009) (see also Taylor et al. 2009) have recently claimed that in the SDSS Data Release 6, only a tiny fraction () of compact ( kpc) and massive () systems is present in the local Universe (). Trujillo et al. (2009) also claim that this estimate is actually an upper limit, given that most of these galaxies are metal-rich and relatively young ( Gyr). They therefore conclude that the nearly complete absence of very compact and old galaxies in the nearby Universe, is at variance with predictions of detailed hierarchical models that grow galaxies through mergers. The result discussed in Figure 4a,c are in broad agreement with the Trujillo et al. (2009) findings, that hierarchical models, or at least the one considered here, tend to produce too many compact galaxies. However, we find that such a discrepancy is not as strong as claimed before, and we also add that the difference is morphology-dependent, i.e., significantly reducing with increasing B/T.
On the other hand, when moving to more spheroid-dominated galaxies, the model tends to produce an higher fraction of galaxies with kpc, predicting up to a factor of higher number density of super-large galaxies (with kpc). This overproduction of large galaxies with mass around is one of the major causes, together with the overproduction of compact and massive galaxies, for the flattening of the size-mass relation seen in Figure 3.
3.3.3 THE PREDICTED STELLAR MASS FUNCTION
Figures 4b,d show the corresponding comparison between model predictions and SDSS data on the SMF for the sample (panel b) and the Hyde & Bernardi (2009a) sample (panel d). It is apparent that the model provides a poorer match to the SMF, irrespective of the sample considered. More noticeably, at variance with the data the model predicts a “bump” in the number density of early-type galaxies around , and falls short by a factor of in producing enough galaxies with mass . We have checked that the model by De Lucia & Blaizot (2007), possibly due to the different treatment of dynamical friction timescales (see, e.g., Parry et al. 2008; Seek Kim et al. 2009), indeed produces a flatter distribution in the number density of early-type galaxies, in better agreement with the data.
3.4 LOOKING INTO THE MODEL
3.4.1 INCREASING THE SATELLITE-CENTRAL MERGER RATE
A very preliminary test to improve on the flatness of the predicted size-mass relation would be to simply remove from the mock catalog the large and less massive galaxies ( kpc and ), and the compact and massive ones ( kpc and ). One simple way to do this would be to assume that those galaxies which are strong outliers with respect to the observed local size-mass relation in Figure 3, should be considered as irregulars and/or disk-dominated galaxies instead of spheroids (e.g., Hopkins et al. 2009c, and references therein). The region in the - plane within the dotted lines in Figure 3 roughly defines the “region of acceptance” at a level. All the mock galaxies which lie below and above those lines can be safely considered as outliers. Recomputing the predicted ERF and SMF only considering the subsample of galaxies within the dotted lines, yields the red long-dashed lines in Figures 4a,b,c,d. It is clear that, irrespective of the actual physical basis motivating such drastic cut in the mock catalog of early-type galaxies, this is not a satisfactory solution, as it severely further underpredicts the number density of massive galaxies, without significantly reducing the bump around , and also worsens the match to the ERF.
We have checked that a significant fraction of the outlier galaxies are satellites. Therefore, one possible way to remove the outlier galaxies might be to simply assume a higher rate of mergers with the central galaxy in the same parent halo. Figure 5 shows the model predictions modified by assuming that all satellite galaxies with stellar mass below have merged with their respective centrals. It is apparent how this hypothetical increase in the merger rate of the less massive spheroids yields a considerably better agreement with the observed SMF, lowering the number density at low masses, and increasing it at higher masses.
Although the simple improvement proposed here for this model yields outputs in better agreement with the data, it requires a valid physical explanation and several independent tests (such as clustering). Some hints that may motivate a revision of the merger rates in the model have already been discussed in the Literature. First of all, there is the observational fact that the frequently assumed minor merger rate of massive galaxies seems to be lower than what suggested by recent observations (Jogee et al. 2009). Second, although the galaxy merger rates broadly follow the high-resolution merger rates of the dark matter halos and subhalos in the Millennium simulation, the actual computation of the former may still not be accurate enough. In fact, baryons can affect their surrounding halos because of, e.g., adiabatic contraction (e.g., Tissera et al. 2009, and references therein), leading to a denser subhalo, which would not be as easily tidally stripped, hence allowing for a faster merger. More recently, several groups working with the same model considered here, have shown that an increased galaxy merger rate produces better fits to the luminosity function for different Hubble types (Benson & Devereux 2009) and for the clustering (Seek Kim et al. 2009).
When merging the satellite galaxies, we have also updated the sizes of the centrals following Eq. (1) and setting . However, as shown in Figure 5a,c, at variance with the SMF, the comparison to the observed ERF does not significantly improve. Note that using lower values of would yield larger sizes for the remnants, thus further worsening the match to the data. The model continues to predict too many large and ultra-large galaxies, with respect to those observed. More importantly, we find that the resulting size-mass relation for this kind of model still presents similar discrepancies with respect to the data, as shown in Figure 6. Low-mass galaxies still have too large sizes, while a non-negligible fraction of the massive galaxies still have too compact sizes, thus preserving the flattening of the relation.
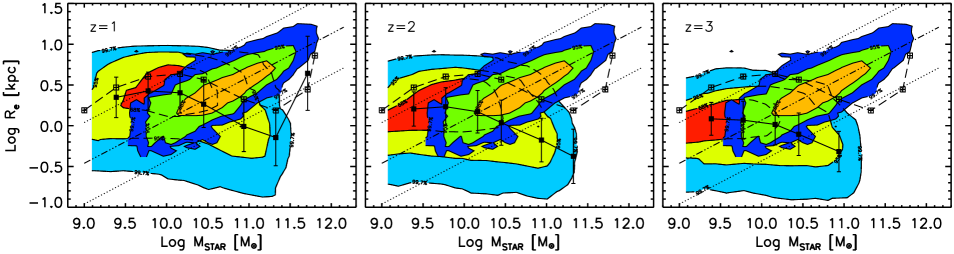
3.4.2 THE SIZE-MASS RELATION AT HIGHER REDSHIFTS
Figure 7 shows the size-mass relation for ellipticals (B/T ) at different redshifts, as labeled. It is evident that the flattening discussed above is present at all epochs (see also Figure 5 in Shankar et al. (2009a)). At fixed stellar mass, galaxies with , tend to shrink by a factor of at higher redshifts. At higher masses, although a large fraction manages to grow (at ) in size by a significant amount enough to saturate (and actually overproduce) the number counts of large galaxies in the local Universe, still a large portion of it remains compact, as we further discuss in the following section.
We here note that, with respect to observations, low mass galaxies tend to be already quite large ( kpc) close to their formation epoch. As reviewed by Mancini et al. (2009), most of the low-mass galaxies observed so far in deep surveys, have in fact on average a factor of smaller sizes than the ones predicted here at the same redshifts. This is due a combination of several processes. Some of the spheroids are generated by strong disk instabilities in the progenitor. The exact treatment of instabilities and of the energy conservation between the progenitor disk and the final bulge, have been discussed by Cole et al. (2000) and Bower et al. (2006), and are still subject to significant uncertainties that might require some closer comparison with hydro-simulations to provide more reliable answers. The spheroids formed instead through the merging of disk dominated, gas-rich progenitors, could possibly be more compact than currently assumed in the present model, as more gas in the progenitors effectively produces more compact sizes than the ones estimated from dissipationless virial relations of the type given in Eq. 1 (e.g., Hopkins et al. 2009d, and references therein). The second problem of the formation and survival of compact and massive galaxies is a problem of possibly different nature and we discuss it in some detail below.
3.4.3 COMPACT AND MASSIVE GALAXIES
As discussed above, Figures 4a,b reveal that the model tends to predict a larger number of compact ( kpc) and massive () early-type galaxies, with respect to the data. Such a result persists even after allowing for an increased rate of mergers for central-satellite galaxies required to improve the match to the observed SMF (Figure 5a,b). The extreme compactness of massive galaxies plays a considerable role in the flattening of the predicted size-mass relation shown in Figure 3. We here attempt to explore possible reasons responsible for producing smaller sizes, or suppressing their later growth, in massive galaxies.


First of all, we note that model galaxies tend to be significantly older than similar galaxies in SDSS. Figure 8 shows normalized age distributions for model (solid lines) and SDSS (long-dashed lines), massive and compact galaxies, as labeled. Here the ages in SDSS are from the spectral analysis of Gallazzi et al. (2005), and, although they might be biased by a systematic 1.5 Gyr with respect to mass-weighted ages (e.g., Jimenez et al. 2007), they are still systematically lower than the predicted ones. We recall that the analysis carried out by Shankar & Bernardi (2009) and Shankar et al. (2009a), showed that, on statistical grounds, the trends of age with stellar mass and size do not significantly depend on the exact choice for the age estimator, although different methods might yield significantly different ages on an object-by-object basis. We find that while galaxies in SDSS peak at ages around Gyr () and have a rather broad distribution with a significant number of older and younger galaxies (see the more detailed analysis in Shankar et al. 2009a), model galaxies are, on average, older, peaked around Gyr (), and have a narrower distribution. This result holds irrespective of the exact bulge fraction cut considered in the model (i.e., the discrepancy is present for both S0 and pure elliptical galaxies). The difference in formation epoch might be, at least in part, responsible for producing a larger number of extremely compact galaxies at low redshifts. The model in fact produces, at fixed stellar mass, more compact galaxies at higher redshifts (see Figure 5 in Shankar et al. 2009a), as naturally expected if older galaxies are born from gas-richer events.
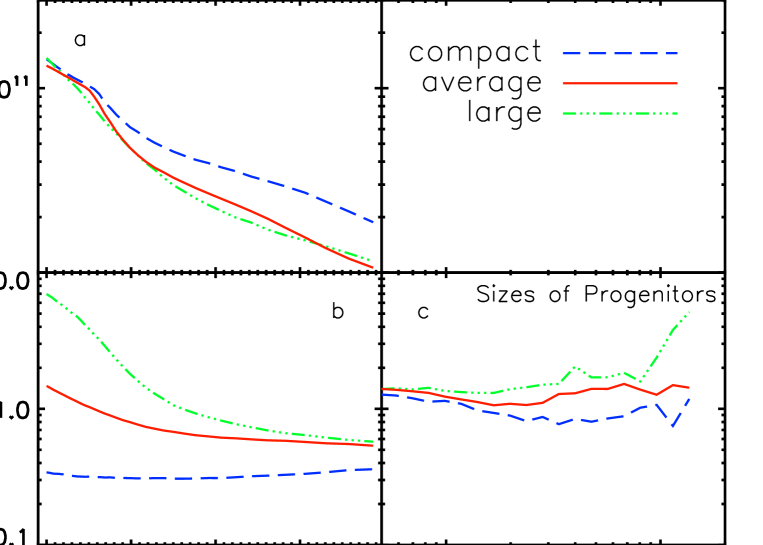
To further test the origin of the suppressed size evolution in a fraction of massive galaxies, we randomly select three samples of compact, average, and large bulge-dominated galaxies from the Bower et al. (2006) model at with stellar mass of , and a median size of =0.4, 1.5, and 8 kpc, respectively. Figure 9 shows the comparison among the median and as a function of redshift (panels a and b, respectively) for three samples, showing that the compact galaxies start off as more massive galaxies at high redshifts but do not evolve, on average, their original sizes, even if, surprisingly, they can grow in mass by up to a factor of . In Figure 9c we plot the overall median size-mass relation for the full set of progenitors of the galaxies examined in panels a and b. The galaxies included in Figure 9c are all the progenitors merging onto the main branch. In other words, we exclude both galaxies along the main branch and those that merge with other galaxies that will subsequently merge onto the main branch. It is apparent that the compact galaxies have “progenitors” always characterized by sizes a factor of a few smaller than average, which we believe is one of the main causes for the negligible growth in their sizes. In fact, from the virial condition given in Eq. (1), it is clear that setting and , we get
| (2) |
Therefore, if the merging progenitors have comparable sizes, i.e., , then this translates into , irrespective of the value for , while progenitors with will efficiently puff-up the size of the remnant by a factor . Another possible concurrent reason for the very compact remnants can be possibly associated with the choice of in Eq. 1. Cosmological N-body simulations show in fact that merging dark matter halos mostly do so on approximately parabolic orbits (e.g., Khochfar & Burkert, 2006), implying values of , and hence larger remnant sizes.
Overall, we conclude that, within the hierarchical framework of the Bower et al. (2006) model, allowing the compact, high- galaxies to be born at more recent epochs and to possibly merge with more massive and larger progenitors, should in principle allow them to grow more in size yielding better agreement with the low portion of the observed ERF. We therefore confirm that the discrepancy between model predictions and data regarding the presence of compact and massive galaxies is real and it causes the flattening of the predicted size-mass relation. Nevertheless, the model can efficiently increase in size and mass a large fraction of spheroids, in a way to actually significantly overproduce the number of local, large galaxies, at least above kpc.
4 DISCUSSION
In the previous sections we showed that hierarchical models are characterized by a two-stage evolution, a fast wet, high-redshift phase, followed by a much longer assembly phase dominated by minor mergers (see Figure 1). A fraction () of the stellar mass of the spheroids is mainly formed through wet, high- merging events among gas-rich, disk dominated subunits, while the rest of the stellar mass is added via later dry mergers222We stress that the growth of the bulge stellar mass via disk instability in the massive spheroids considered here is not more than 10%, and only for the galaxies with final stellar mass .. This kind of evolution may be connected with the fast and slow accretion phases of single dark matter halos seen in high resolution numerical simulations (e.g., Zhao et al., 2003; Lu et al., 2006; Diemand et al., 2007; Ascasibar & Gottlöber, 2008; Vass et al., 2009). These studies support a scenario in which during a first, fast, and chaotic phase, the halo builds up the central potential well, while during a second, much longer phase, matter is accreted in a smoother way. The latter phase could resemble a sequence of minor mergers, although the total amount of stellar mass carried towards the central regions during this longer phase is still unclear (e.g., Boylan-Kolchin et al., 2008; Kazantzidis et al., 2008; Purcell et al., 2008; Drory & Alvarez, 2008; Pérez-González et al., 2008, and references therein). An increasing stellar mass with time may be actually going on in disk-dominated galaxies, where the break radius in the light profiles has been observed to increase by a factor of 1.3 since (Azzollini et al., 2008; Bakos et al., 2008).
Minor mergers might also be at the origin of the boxy and disky early-type dichotomy (e.g., Cappellari et al., 2007; Emsellem et al., 2007; Kang et al., 2007; Pasquali et al., 2007, and references therein). Assuming that wet and dry mergers are actually responsible for determining the disky and boxy nature of stellar orbits in ellipticals, then the results in Figure 1 would imply that older galaxies, which have undergone more dry mergers since their formation epoch, would end up, on average, with boxier isophotes with respect to younger galaxies (e.g., Khochfar & Burkert 2006; Khochfar & Silk 2006a). The recent study by Kormendy et al. (2008) actually confirms that older galaxies appear boxier. Almeida et al. (2007) also discussed that several other correlations, including the velocity dispersion, size and luminosity are reproduced by the Bower et al. (2006) model with no extra tuning of the parameters.
During the wet phase, the correlations between the central black hole mass and their host galaxy potential wells, characterized by their , might have also been settled, especially in AGN feedback-constrained galaxy evolution models (e.g., Granato et al. 2004; Hopkins et al. 2006; Monaco et al. 2007; but see also, e.g., Miralda-Escudé & Kollmeier 2005). If most of the black hole mass was already in place at the end of the wet phase, but only about half of the host galaxy mass was assembled, the hierarchical models considered here would then naturally imply an higher black hole mass to stellar mass ratio with respect to the local one, i.e., a positive evolution in the normalization of the - relation. On the other hand, given that the host halo potential well is rapidly built during the fast accretion phase, it is also reasonable to expect the - relation to possibly already be fully established at the epoch of the wet phase (e.g., Granato et al., 2004; Marulli et al., 2008; Hopkins et al., 2009b). Some empirical works have, in fact, found only marginal evidence for evolution in the - relation, and possibly only in the more massive systems, (e.g., Shields et al., 2006; Gaskell, 2009; Shankar et al., 2009b, and references therein). However, minor dry mergers are expected to have some impact on the initial velocity dispersion (e.g., Ciotti 2009; Naab et al. 2009). Also, late black hole re-activations (e.g., Menci et al. 2004, Vittorini et al. 2005), and/or black hole mergers (e.g., Volonteri et al. 2005, Malbon et al. 2007), might have increased the black hole masses since the wet epoch, further influencing the evolution in the scaling relations between black holes and their host galaxies. Overall, the dynamical evolution of galaxies and their central black holes, tested against the local velocity dispersion function (Sheth et al. 2003, Bernardi et al. 2009) and fundamental plane of early-type galaxies, should provide valuable additional insights into our understanding of galaxy evolution.
5 CONCLUSIONS
In this paper we make use of the data sets derived from SDSS DR6 by Bernardi et al. (2009) and Hyde & Bernardi (2009a), used to derive the size and stellar mass functions for a sample of early-type galaxies with concentration , comprised of both ellipticals and S0 galaxies, and a sample dominated by ellipticals, respectively.
We compare these statistical distributions with the hierarchical model by Bower et al. (2006). The aim of this exercise is to show how the simultaneous comparison of the size and mass distributions can reveal interesting insights on how to improve the performance of theoretical models of galaxy evolution.
We find, in agreement with previous studies, that this hierarchical model provides a poor match to the size-mass relation of local galaxies, irrespective of the exact sample we compare it with. In particular, the model tends to produce a much flatter relation than the one actually observed. This flattening is mainly produced by the combined effects of having, with respect to the local data, too large ( kpc) low-mass galaxies (), and of having a non-negligible fraction of compact galaxies ( kpc) at high masses ().
Such discrepancies are reflected in the predicted size distribution. Although the model produces a size distribution in broad agreement with the data, it tends to overproduce the number of large galaxies beyond the peak ( kpc), and the number of very compact galaxies ( kpc). We discussed that the former issue is present at all epochs, and it might therefore be linked to how spheroids are formed in the first place, either from not properly treating initial disk instabilities and/or computing the sizes of remnants in gas-rich mergers.
Regarding the overproduction of compact and massive () galaxies with respect to the data, already pointed out in the recent Literature, we find it to be less prominent than previously claimed, and confined to only ultracompact galaxies ( kpc) when considering only ellipticals. We discuss two possible reasons behind the survival of such compact galaxies until the present epoch. First, we find that model early-type galaxies tend to be significantly older than those in SDSS. This in turn might induce more compact galaxies at fixed stellar mass, given that galaxies formed at higher redshifts are more compact (see Shankar et al. 2009a). We also find that model early-type compact galaxies underwent peculiar merging histories characterized by extremely compact progenitors, that could prevent them to efficiently grow their sizes.
Acknowledgments
FS acknowledges support from the Alexander von Humboldt Foundation and partial support from NASA Grant NNG05GH77G. MB is supported by NASA grant LTSA-NNG06GC19G and NASA ADP/NNX09AD02G. We thank Guinevere Kauffmann, Ravi Sheth, Andrew Benson, Luigi Danese, Rosalind Skelton, Simon White, Qi Guo, and Volker Springel for various discussions. We finally thank the referee for several useful suggestions that improved the presentation of the paper.
References
- Almeida et al. (2007) Almeida C., Baugh C. M., Lacey C. G., 2007, MNRAS, 376, 1711
- Ascasibar & Gottlöber (2008) Ascasibar Y., Gottlöber S., 2008, MNRAS, 386, 2022
- Azzollini et al. (2008) Azzollini R., Trujillo I., Beckman J. E., 2008, ApJ, 684, 1026
- Bakos et al. (2008) Bakos J., Trujillo I., Pohlen M., 2008, ApJ, 683, L103
- Benson et al. (2003) Benson A. J., Frenk C. S., Baugh C. M., Cole S., Lacey C. G., 2003, MNRAS, 343, 679
- Benson & Devereux (2009) Benson, A. J., & Devereux, N. 2009, MNRAS, 1955
- Bernardi (2009) Bernardi M., 2009, MNRAS, 395, 1491
- Bernardi et al. (2009) Bernardi, M., Shankar, F., Hyde, J. B., Mei, S., Marulli, F., & Sheth, R. K. 2009, arXiv:0910.1093
- Bernardi et al. (2008) Bernardi M., Hyde J. B., Fritz A., Sheth R. K., Gebhardt K., Nichol R. C., 2008, MNRAS, 391, 1191
- Bernardi et al. (2006a) Bernardi M., Nichol R. C., Sheth R. K., Miller C. J., Brinkmann J., 2006a, AJ, 131, 1288
- Bernardi et al. (2006b) Bernardi M. et al., 2006b, AJ, 131, 2018
- Bezanson et al. (2009) Bezanson R., van Dokkum P. G., Tal T., Marchesini D., Kriek M., Franx M., Coppi P., 2009, ApJ, 697, 1290
- Bower et al. (2006) Bower R. G., Benson A. J., Malbon R., Helly J. C., Frenk C. S., Baugh C. M., Cole S., Lacey C. G., 2006, MNRAS, 370, 645
- Boylan-Kolchin et al. (2008) Boylan-Kolchin M., Ma C.-P., Quataert E., 2008, MNRAS, 383, 93
- Bruzual & Charlot (2003) Bruzual G., Charlot S., 2003, MNRAS, 344, 1000
- Cappellari et al. (2007) Cappellari M. et al., 2007, MNRAS, 379, 418
- Cattaneo et al. (2006) Cattaneo A., Dekel A., Devriendt J., Guiderdoni B., Blaizot J., 2006, MNRAS, 370, 1651
- Chabrier (2003) Chabrier, G. 2003, ApJ, 586, L133
- Cimatti (2009) Cimatti A., 2009, ArXiv:0901.1457
- Cimatti et al. (2008) Cimatti A. et al., 2008, A&A, 482, 21
- Ciotti (2009) Ciotti L., 2009, Nuovo Cimento Rivista Serie, 32, 1
- Cirasuolo et al. (2005) Cirasuolo M., Shankar F., Granato G. L., De Zotti G., Danese L., 2005, ApJ, 629, 816
- Cole et al. (2000) Cole S., Lacey C. G., Baugh C. M., Frenk C. S., 2000, MNRAS, 319, 168
- Colless et al. (2001) Colless M. et al., 2001, MNRAS, 328, 1039
- Cook et al. (2009) Cook M., Lapi A., Granato G. L., 2009, ArXiv:0903.2390
- Croton et al. (2006) Croton D. J. et al., 2006, MNRAS, 365, 11
- Dekel et al. (2009) Dekel, A., Sari, R., & Ceverino, D. 2009, ApJ, 703, 785
- De Lucia & Blaizot (2007) De Lucia G., Blaizot J., 2007, MNRAS, 375, 2
- De Lucia et al. (2006) De Lucia G., Springel V., White S. D. M., Croton D., Kauffmann G., 2006, MNRAS, 366, 499
- de Vaucouleurs (1959) de Vaucouleurs, G. 1959, Handbuch der Physik, 53, 311
- Diemand et al. (2007) Diemand J., Kuhlen M., Madau P., 2007, ApJ, 667, 859
- Drory & Alvarez (2008) Drory N., Alvarez M., 2008, ApJ, 680, 41
- Eggen et al. (1962) Eggen O. J., Lynden-Bell D., Sandage A. R., 1962, ApJ, 136, 748
- Emsellem et al. (2007) Emsellem E. et al., 2007, MNRAS, 379, 401
- Fan et al. (2008) Fan L., Lapi A., De Zotti G., Danese L., 2008, ApJ, 689, L101
- Fontanot et al. (2009) Fontanot F., De Lucia G., Monaco P., Somerville R. S., Santini P., 2009, ArXiv:0901.1130
- Fukugita et al. (1995) Fukugita M., Shimasaku K., Ichikawa T., 1995, PASP, 107, 945
- Gallazzi et al. (2005) Gallazzi A., Charlot S., Brinchmann J., White S. D. M., Tremonti C. A., 2005, MNRAS, 362, 41
- Gaskell (2009) Gaskell, C. M. 2009, arXiv:0908.0328
- González et al. (2009) González, J. E., Lacey, C. G., Baugh, C. M., Frenk, C. S., & Benson, A. J. 2009, MNRAS, 397, 1254
- Granato et al. (2004) Granato G. L., De Zotti G., Silva L., Bressan A., Danese L., 2004, ApJ, 600, 580
- Granato et al. (2006) Granato G. L., Silva L., Lapi A., Shankar F., De Zotti G., Danese L., 2006, MNRAS, 368, L72
- Guo & White (2008) Guo Q., White S. D. M., 2008, MNRAS, 384, 2
- Hopkins et al. (2009a) Hopkins P. F., Bundy K., Murray N., Quataert E., Lauer T., Ma C.-P., 2009a, ArXiv:0903.2479
- Hopkins et al. (2006) Hopkins P. F., Hernquist L., Cox T. J., Di Matteo T., Robertson B., Springel V., 2006, ApJS, 163, 1
- Hopkins et al. (2009b) Hopkins P. F., Hernquist L., Cox T. J., Keres D., Wuyts S., 2009b, ApJ, 691, 1424
- Hopkins et al. (2009c) Hopkins P. F. et al., 2009c, ArXiv:0901.4111
- Hopkins et al. (2009d) Hopkins, P. F., Bundy, K., Hernquist, L., Wuyts, S., & Cox, T. J. 2009d,, MNRAS, 1635
- Hyde & Bernardi (2009a) Hyde J. B., Bernardi M., 2009a, MNRAS, 394, 1978
- Hyde & Bernardi (2009b) —, 2009b, MNRAS, 396, 1171
- Jimenez et al. (2007) Jimenez, R., Bernardi, M., Haiman, Z., Panter, B., & Heavens, A. F. 2007, ApJ, 669, 947
- Jogee et al. (2009) Jogee S. et al., 2009, ApJ, 697, 1971
- Kang et al. (2007) Kang X., van den Bosch F. C., Pasquali A., 2007, MNRAS, 381, 389
- Kazantzidis et al. (2008) Kazantzidis S., Bullock J. S., Zentner A. R., Kravtsov A. V., Moustakas L. A., 2008, ApJ, 688, 254
- Kennicutt (1983) Kennicutt, R. C., Jr. 1983, ApJ, 272, 54
- Khochfar & Burkert (2005) Khochfar S., Burkert A., 2005, MNRAS, 359, 1379
- Khochfar & Burkert (2006) —, 2006, A&A, 445, 403
- Khochfar & Silk (2006a) Khochfar S., Silk J., 2006a, ApJ, 648, L21
- Khochfar & Silk (2006b) —, 2006b, MNRAS, 370, 902
- Kormendy et al. (2008) Kormendy J., Fisher D. B., Cornell M. E., Bender R., 2008, ArXiv e-prints
- Lapi et al. (2006) Lapi A., Shankar F., Mao J., Granato G. L., Silva L., De Zotti G., Danese L., 2006, ApJ, 650, 42
- Laurikainen et al. (2009) Laurikainen E., Salo H., Buta R., Knapen J. H., 2009, ArXiv:0901.0641
- Lu et al. (2006) Lu Y., Mo H. J., Katz N., Weinberg M. D., 2006, MNRAS, 368, 1931
- Malbon et al. (2007) Malbon R. K., Baugh C. M., Frenk C. S., Lacey C. G., 2007, MNRAS, 382, 1394
- Mancini et al. (2009) Mancini, C., et al. 2009, MNRAS, 1721
- Marulli et al. (2008) Marulli F., Bonoli S., Branchini E., Moscardini L., Springel V., 2008, MNRAS, 385, 1846
- Menci et al. (2004) Menci N., Cavaliere A., Fontana A., Giallongo E., Poli F., Vittorini V., 2004, ApJ, 604, 12
- Miralda-Escudé & Kollmeier (2005) Miralda-Escudé J., Kollmeier J. A., 2005, ApJ, 619, 30
- Monaco et al. (2007) Monaco P., Fontanot F., Taffoni G., 2007, MNRAS, 375, 1189
- Naab et al. (2009) Naab T., Johannson P. H., Ostriker J. P., 2009, ArXiv:0903.1636
- Nakamura et al. (2003) Nakamura O., Fukugita M., Yasuda N., Loveday J., Brinkmann J., Schneider D. P., Shimasaku K., SubbaRao M., 2003, AJ, 125, 1682
- Nipoti et al. (2009) Nipoti, C., Treu, T., Auger, M. W., & Bolton, A. S. 2009, ApJ, 706, L86
- Parry et al. (2008) Parry O. H., Eke V. R., Frenk C. S., 2008, ArXiv:0806.4189
- Pasquali et al. (2007) Pasquali A., van den Bosch F. C., Rix H.-W., 2007, ApJ, 664, 738
- Pérez-González et al. (2008) Pérez-González P. G. et al., 2008, ApJ, 675, 234
- Purcell et al. (2008) Purcell C. W., Kazantzidis S., Bullock J. S., 2008, ArXiv e-prints
- Saracco et al. (2008) Saracco P., Longhetti M., Andreon S., 2008, MNRAS, 1367
- Schechter (1976) Schechter P., 1976, ApJ, 203, 297
- Seek Kim et al. (2009) Seek Kim H., Baugh C. M., Cole S., Frenk C. S., Benson A. J., 2009, ArXiv:0905.4723
- Shankar & Bernardi (2009) Shankar F., Bernardi M., 2009, MNRAS, 396, L76
- Shankar et al. (2009) Shankar F., Marulli F., Bernardi M., Dai X., Hyde J. B., Sheth R. K., 2009a, MNRAS, in press, ArXiv:0912.0012
- Shankar et al. (2009b) Shankar F., Bernardi M., Haiman Z., 2009b, ApJ, 694, 867
- Shankar et al. (2006) Shankar F., Lapi A., Salucci P., De Zotti G., Danese L., 2006, ApJ, 643, 14
- Shankar et al. (2004) Shankar F., Salucci P., Granato G. L., De Zotti G., Danese L., 2004, MNRAS, 354, 1020
- Shen et al. (2003) Shen S., Mo H. J., White S. D. M., Blanton M. R., Kauffmann G., Voges W., Brinkmann J., Csabai I., 2003, MNRAS, 343, 978
- Sheth et al. (2003) Sheth R. K. et al., 2003, ApJ, 594, 225
- Shields et al. (2006) Shields, G. A., Menezes, K. L., Massart, C. A., & Vanden Bout, P. 2006, ApJ, 641, 683
- Somerville et al. (2008) Somerville R. S., Hopkins P. F., Cox T. J., Robertson B. E., Hernquist L., 2008, MNRAS, 391, 481
- Spergel et al. (2003) Spergel D. N. et al., 2003, ApJS, 148, 175
- Springel (2005) Springel V., 2005, MNRAS, 364, 1105
- Taylor et al. (2009) Taylor E. N., Franx M., Glazebrook K., Brinchmann J., van der Wel A., van Dokkum P. G., 2009, ArXiv:0907.4766
- Tissera et al. (2009) Tissera, P. B., White, S. D. M., Pedrosa, S., & Scannapieco, C. 2009, arXiv:0911.2316
- Trujillo et al. (2009) Trujillo I., Cenarro A. J., de Lorenzo-Caceres A., Vazdekis A., de la Rosa I. G., Cava A., 2009, ArXiv e-prints
- Trujillo et al. (2006) Trujillo I. et al., 2006, MNRAS, 373, L36
- van der Wel et al. (2009) van der Wel A., Bell E. F., van den Bosch F. C., Gallazzi A., Rix H.-W., 2009, ArXiv:0903.4857
- van Dokkum et al. (2008) van Dokkum P. G. et al., 2008, ApJ, 677, L5
- van Dokkum et al. (2006) van Dokkum P. G. et al., 2006, ApJ, 638, L59
- van Dokkum et al. (2009) van Dokkum, P. G., et al. 2009, arXiv:0912.0514
- Vass et al. (2009) Vass I. M., Valluri M., Kravtsov A. V., Kazantzidis S., 2009, MNRAS, 395, 1225
- Vittorini et al. (2005) Vittorini V., Shankar F., Cavaliere A., 2005, MNRAS, 363, 1376
- Volonteri et al. (2005) Volonteri, M., Madau, P., Quataert, E., & Rees, M. J. 2005, ApJ, 620, 69
- York et al. (2000) York D. G. et al., 2000, AJ, 120, 1579
- Zhao et al. (2003) Zhao D. H., Mo H. J., Jing Y. P., Börner G., 2003, MNRAS, 339, 12
Appendix A PREDICTING THE SIZE FUNCTION FROM CONVOLUTION METHODS
The filled squares in Figure A1 represent the Bernardi et al. (2009) estimate of the ERF obtained from the method for our sample of early-type galaxies selected with concentration .
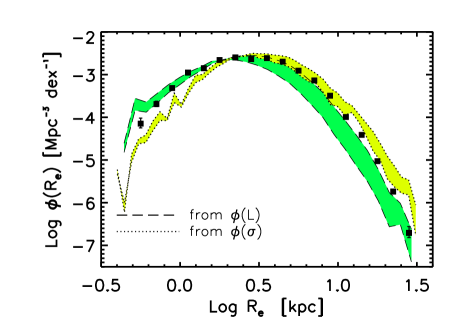
For consistency, we here show that the -based ERF is consistent, within the errors, with the one obtained from the convolution of the luminosity function or velocity dispersion function with the bivariate distribution of points in the plane. More specifically, following the methods outlined in Sheth et al. (2003) and Shankar et al. (2004), we have convolved the luminosity function with the bivariate distribution of and ,
| (3) |
Here is the fraction of sources in the sample with effective radius and luminosity , normalized to the total number of sources with luminosity . The luminosity function has been computed from the method by Bernardi et al. (2009) for the same sample of galaxies, and we refer the reader to that paper for analytical fits and detailed discussions of the sample. The result of Eq. (3) is shown in Figure A1 with long-dashed lines, which bracket the statistical uncertainties in the luminosity function fit parameters. We have also used the bivariate distribution in equation (3) applied to the velocity dispersion function , again derived by Bernardi et al. (2009) for this same sample, and with the weights now computed from the distribution of sources in the plane. The result is shown with dotted lines in the same Figure, again bracketing the statistical uncertainties in the velocity dispersion function fit parameters.
This exercise proves that, as expected, convolutions of other statistical distributions with their appropriate scaling relations , provide consistent results. However, it also shows that the accuracy of the results relies on the accuracy of the input weights , that in turn proves the importance of directly adopting the method to derive a more precise estimate of the ERF.