Wide-field HST/ACS images of M81: The Population of Compact Star Clusters
Abstract
We study the population of compact stellar clusters (CSCs) in M81, using the HST/ACS images in the filters F435W, F606W and F814W covering, for the first time, the entire optical extent of the galaxy. Our sample contains 435 clusters of FWHM less than 10 ACS pixels (9 pc). The sample shows the presence of two cluster populations, a blue group of 263 objects brighter than mag, and a red group of 172 objects, brighter than mag. Based on the analysis of colour magnitude diagrams and making use of simple stellar population models, we find the blue clusters are younger than 300 Myr with some clusters as young as few Myr, and the red clusters are as old as globular clusters. The luminosity function of the blue group follows a power-law distribution with an index of , typical value for young CSCs in other galaxies. The power-law shows unmistakable signs of truncation at mag ( mag), which would correspond to a mass-limit of if the brightest clusters are younger than 10 Myr. The red clusters have photometric masses between to for the adopted age of 5 Gyr and their luminosity function resembles very much the globular cluster luminosity function in the Milky Way. The brightest GC in M81 has mag, which is mag brighter than Cen, the most massive GC in the Milky Way.
keywords:
catalogs – galaxies: individual (M81) – galaxies: spiral – galaxies: star clusters1 INTRODUCTION
With the advent of the HST (Hubble Space Telescope) a new class of stellar clusters have been identified: the Compact Star Clusters (CSCs) with typical masses of to and sizes between 1 and 6 pc (Meurer, 1995). CSCs have been found in several environments, including violent star forming regions within interacting galaxies (Whitmore et al., 1999). The similarity between the compactness and mass of the CSCs and that of the globular clusters (GC) is a reason to think of an evolutionary connection between them. Moreover, the compact stellar clusters are unique laboratories for studying diverse star formation processes related to the star formation history of the host galaxy. The detailed studies of globular clusters — with ages comparable to the age of the Universe — have revealed the early formation history of nearby galaxies and the Milky Way (Harris, 1996; Barmby, 2003), whereas the studies of younger CSCs — ages Gyr — delineate the recent star formation history, that in some cases are related to interactions with neighbouring galaxies (Holtzman et al., 1992; Whitmore et al., 1999; Mayya et al., 2008).
M81 (NGC 3031) is a large Sab spiral galaxy, very similar to M31 in appearance and roughly as massive as the Milky Way (MW). M81 at a distance of 3.63 Mpc [; Freedman et al. (1994)] is the biggest member of the M81 Group, which includes the prototype starburst galaxy M82. An interaction 100–500 Myr ago between different members of this group has been discussed by several authors (Brouillet, Combes, & Baudry, 1991; Yun, 1999). Recent observations of M82 show that it has a large population of CSCs, with young clusters (age Myr) concentrated towards the center, and relatively older clusters ( Myr) homogeneously distributed across the disk, the latter population having formed as a part of the disk-wide burst following the interaction (Mayya et al., 2006, 2008; Konstantopoulos et al., 2009). It is of interest to investigate whether the interaction also triggered CSC formation in M81.
The population of GCs in M81 has been studied in the past by several groups. Perelmuter & Racine (1995) used an extensive database to find objects classified as cluster candidates in the inner 11 kpc radius of M81. After completeness corrections for the unobserved area, they estimated the total GC population would be . Perelmuter, Brodie, & Huchra (1995) obtained spectra of 82 cluster candidates and confirmed 25 as bona fide globular clusters. The derived mean metallicity of the globular clusters was confirming previous results from Brodie & Huchra (1991). Schroder et al. (2002) obtained spectra of 16 additional globular cluster candidates selected from an extended list of Perelmuter & Racine (1995) catalogue and confirmed all of them to be GCs. Hence, in total there are 41 objects that are confirmed as globular clusters using spectroscopic data. The metallicity distribution of these GCs is similar to that in M31 and the Milky Way, two galaxies that are morphologically very similar to M81. Hence, it of interest to determine whether M81 also contains a similar number of total GCs as in the Milky Way.
Chandar, Ford, & Tsvetanov (2001) and Chandar, Tsvetanov, & Ford (2001) carried out a search for compact objects in M81 based on observations with the HST/WFPC2 camera. They discovered 114 CSCs in an area of . The analysis found, for the first time, two different cluster populations, 59 red clusters [ mag] which are candidate for globular clusters and 55 young clusters with photometric ages Myr. The authors related the latter population with the interaction between M81 and M82.
In the present work, we carried out a search for CSCs in 29 adjacent HST/ACS fields centered on the nucleus of M81. The present dataset offers not only an improved spatial resolution, but also covers a field of view that is 8.5 times larger than that covered by Chandar, Tsvetanov, & Ford (2001). Results obtained from a subset of 12 adjacent central fields were presented in Santiago-Cortes, Mayya, & Rosa-González (2009).
This paper is organized as follows: §2 presents the observational material used in this work; §3 gives a summary of the cluster detection and selection method; §4 describes the analysis of colour magnitude diagrams (CMD) and luminosity functions (LF) for the selected clusters; the discussion and conclusions of these studies are presented in §5.
2 OBSERVATIONS
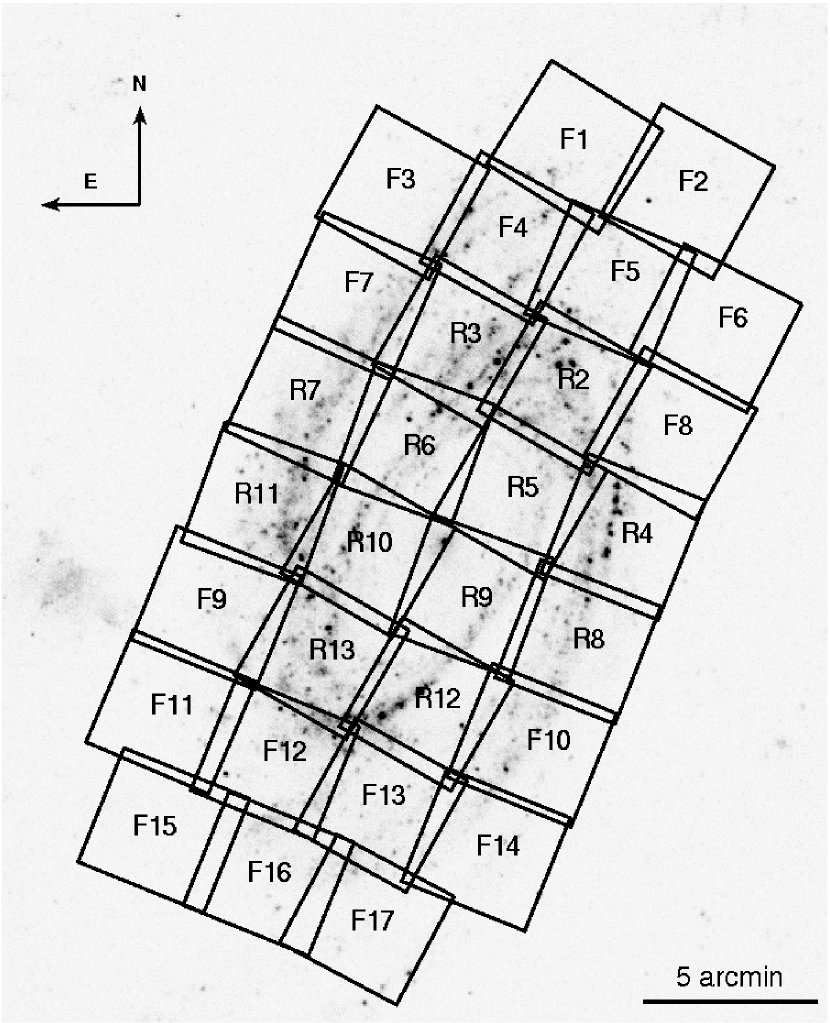
The observations used in this work were carried out with the ACS Wide Field Channel on board the HST. They were part of the projects with proposal IDs 10250 (PI: John Huchra) and 10584 (PI: Andreas Zezas). Table 1 lists the details of the observations. The HST database contains 29 adjacent fields covering a field of view of (See Figure 1), with a sampling of (0.88 pc ). For each field, observations were carried out in the F435W, F606W and F814W filters, which for the sake of brevity we will refer to as , and filters, respectively, throughout this paper. The standard pipeline process (CALACS) provided by the Hubble Heritage Team were used for bias, dark and flat-field corrections. The pipeline uses the IRAF/STSDAS Multidrizzle task to combine the images of a single field and produces weight maps related with the background and instrumental noise. Also this task corrects bad pixels, rejects cosmic rays, and eliminates artifacts (Mutchler et al., 2007). However, images taken with different programs have slightly different astrometric coordinates. We used common stars in the adjacent images to tie all the images to a single coordinate system.
| Field ID | Filter | Proposal ID | Exp. Time (s) |
|---|---|---|---|
| F1 | F435W | 10584 | |
| F1 | F606W | 10584 | |
| F1 | F814W | 10584 | |
| F2 | F435W | 10584 | |
| F2 | F606W | 10584 | |
| F2 | F814W | 10584 | |
| F3–F14 | F435W | 10584 | |
| F3–F14 | F606W | 10584 | |
| F3–F10 | F814W | 10250 | |
| F11 | F814W | 10250 | |
| F12–F14 | F814W | 10250 | |
| F15–F16 | F435W | 10584 | |
| F15–F16 | F606W | 10584 | |
| F15–F16 | F814W | 10584 | |
| F17 | F435W | 10584 | |
| F17 | F606W | 10584 | |
| F17 | F814W | 10584 | |
| R2-R13 | F435W | 10584 | |
| R2-R13 | F606W | 10584 | |
| R2-R13 | F814W | 10250 |
| ID | RA(2000) | Dec(2000) | (mag) | FWHM(pix) | IDb | (km/s) | [Fe/H]b | |
|---|---|---|---|---|---|---|---|---|
| 45861F1 | 09:55:03.823 | 69:15:38.10 | 19.09 | 1.33 | 2.27a | Is40165 | ||
| 9514F3 | 09:55:44.079 | 69:14:12.00 | 20.11 | 2.14 | 1.74a | Is40181 | ||
| 113F10 | 09:55:06.265 | 68:56:24.78 | 18.60 | 1.00 | 2.47a | Is50037 | ||
| 8041F11 | 09:56:40.582 | 68:59:52.44 | 19.68 | 1.95 | 2.61a | Is50225 | ||
| 3740F6 | 09:54:19.980 | 69:09:11.57 | 19.97 | 1.45 | 2.02a | Is51027 | ||
| 901F17 | 09:55:56.866 | 68:52:13.42 | 19.63 | 1.60 | 1.85a | Is60045 | ||
| 10870R8 | 09:54:58.754 | 69:00:58.21 | 20.97 | 1.72 | 2.19 | Is50286 | ||
| 10600F9 | 09:56:31.774 | 69:02:38.47 | 21.38 | 2.20 | 2.15 | Id50401 |
Note: (a) mildly saturated stars, (b) last 3 column data were taken from Perelmuter, Brodie, & Huchra (1995).
| IDb | RA(2000) | Dec(2000) | (mag) | FWHM (pix) | ||||
|---|---|---|---|---|---|---|---|---|
| R05R06584 | 148.8418408 | 69.1105121 | 17.829 | 2.058 | 1.103 | 18.185 | 3.62 | 0.03 |
| R13R13715 | 149.1149429 | 69.0194455 | 18.437 | 1.777 | 1.000 | 18.726 | 5.82 | 0.13 |
| R04B15666 | 148.6774430 | 69.0606742 | 18.448 | 0.317 | 0.067 | 18.652 | 4.41 | 0.28 |
| R10R03509 | 148.9172358 | 69.0695361 | 18.595 | 1.811 | 1.020 | 18.797 | 7.44 | 0.04 |
| R10R10692 | 149.0356195 | 69.0642516 | 18.758 | 2.164 | 1.204 | 19.118 | 3.65 | 0.15 |
| R03B16992 | 148.8193827 | 69.1487218 | 18.762 | 0.146 | 0.118 | 19.071 | 3.62 | 0.19 |
| R10R09559 | 148.9417949 | 69.0501834 | 18.771 | 2.240 | 1.267 | 18.996 | 3.45 | 0.12 |
| R06R14272 | 148.8788369 | 69.1274761 | 19.050 | 2.054 | 1.160 | 19.317 | 3.39 | 0.12 |
| R05R06792 | 148.7596607 | 69.0938767 | 19.068 | 1.996 | 1.137 | 19.328 | 5.34 | 0.09 |
| R05R10583 | 148.8424549 | 69.0886357 | 19.140 | 2.122 | 1.228 | 19.257 | 3.74 | 0.02 |
| R12B14433 | 148.9722627 | 68.9844062 | 19.258 | 0.282 | 0.137 | 19.305 | 3.02 | 0.36 |
| R02B09480 | 148.7397628 | 69.1468477 | 19.309 | 0.001 | 0.053 | 19.404 | 9.58 | 0.35 |
| F14B08146 | 148.8935116 | 68.9303161 | 19.326 | 1.095 | 0.465 | 19.417 | 3.51 | 0.22 |
| R04B12769 | 148.7003380 | 69.0560965 | 19.377 | 0.619 | 0.973 | 19.986 | 5.68 | 0.31 |
| R13R19709 | 149.0469244 | 68.9835085 | 19.381 | 2.280 | 1.361 | 19.399 | 2.72 | 0.10 |
Note: (a) Only the brightest 15 (in band B) are given here. A complete list is available in electronic version of the Journal. (b) The first three digits of the ID indicate the ACS field number (Figure 1), the fourth letter indicates whether the cluster belongs to the blue (B) or red (R) group, and the remaining part is the SExtractor identification number of the source. (c) is the ISOPHOT magnitude and is the aperture magnitude within a radius of 10 pixel () as defined in SExtractor. (d) and are the Vega system colours in the HST filters , and . The colours are calculated using the aperture magnitudes within a radius of 10 pixel.
3 CLUSTER DETECTION AND SELECTION
We used the automatic detection code SExtractor to create an unbiased sample of cluster candidates. SExtractor automatically detects sources on fits images, makes photometry and generates a data catalog (Bertin & Arnouts, 1996). SExtractor first generates a background map by computing the mean and the standard deviation of every section of the image with a user-defined grid size for which we choose pixels. The local background is clipped iteratively until the values in every remaining pixel is within of the median value. The mean of the clipped histogram is then taken as the local background. Every area of at least five adjacent pixels that exceeded the background by at least was called a source candidate.
The B band was used for the detection of candidates, and we carried out aperture photometry of all the detected sources in each of the B, V and I images. The process was repeated for each of the 29 fields, resulting in a preliminary list of 565,438 sources. This list contains both unresolved (stellar-like) and resolved (extended) objects. The distribution of sizes peaks at FWHM=2.1 pixel, which corresponds to the typical Point Spread Function (PSF) of the ACS images. We chose pixel as the dividing line to separate cluster candidates from point sources. Our aim is to create a catalog of compact sized clusters and hence we restricted our catalog to sources with pixel. Thus our preliminary list of CSC candidates includes all sources with pixels.
Among the resolved objects selected using the above mentioned criterion, we have two kinds of sources that contaminate the genuine CSCs. The first of these contaminating sources is formed by the unevenness of the local background due to the presence of dust and complex small-scale disk structures. The second type of contaminating sources is caused due to the blending of several point sources due to stellar crowding. These contaminating sources are rejected by using the AREA parameter (defined as the number of contiguous pixels above the detection limit) of SExtractor. By visual inspection of the images, we found that the fraction of contaminating sources is highest for sources having area less than 50 pixels. Hence, we rejected all sources if they have an 50 pixels. By numerical calculations, we found that even the most compact objects have 50 pixels if they are brighter than mag, which effectively sets the completeness limit of our selection process.
While a great majority of blended stars are eliminated from the list by the imposed AREA criteria, some of them still sneak through. In order to eliminate such sources, we analyzed the ellipticities of the sources. All genuine clusters are expected to be round with ellipticity . However, because SExtractor measures ellipticities at the limiting () isophote level, we found that some genuine clusters have . This happens when a cluster is surrounded by a diffuse background or is immersed within a stellar group. This kind of source is characterized by a prominent peak, with the aperture photometry saturating at a small radius. On the other hand, aperture magnitude of a source formed by an elongated chain of stars would continue to rise with increasing radius. This property allows us to separate clusters from the blended stars even when the measured ellipticities are . We found that if the difference between the aperture magnitudes of diameters 2 and 4 pixels is less than 1.5 mag, then they are true clusters. Hence, among the elongated sources, we retained only those sources if the difference in magnitudes between apertures of diameters 2 and 4 pixels is less than 1.5 mag. In summary, all sources with pixels, pixels and ellipticity are retained, whereas among the elongated sources, only those showing evidence of a compact core are retained.
Note that at the distance of M81, 2.4 pixel corresponds to a physical scale of 2.1 pc. Given that the PSF of ACS images is 2.1 pixels, all clusters smaller than 1 pc of FWHM will have a measured FWHM of 2.4 pixels, and hence our method cannot recover clusters more compact than this, if present. A Gaussian FWHM of 1 pc corresponds to a core radius of 0.5 pc for a King profile with c==30 (Chandar, Ford, & Tsvetanov, 2001), which is almost the limiting size for the compact clusters, and very few such clusters are known to exist (Barmby et al., 2006; Scheepmaker et al., 2007; Ashman & Zepf, 2001). Hence, we are not missing many clusters because of this criterion. The measured FWHM pixel, the smearing due to the PSF is only marginal. The upper cut-off of FWHM=10 pixel used in this work, corresponds to a PSF-corrected physical size of 8.6 pc (core radius 4.3 pc).

We carried out a visual inspection of the images to make a list of objects that have diffraction spikes or are saturated in any one of the , or -band images, with majority of them saturated only in the -band. A total of 83 such objects are found and there is no published information about the nature of these objects from spectroscopic surveys such as the one carried out by Sandage (1984), or several other follow-up studies. We hence analyzed the colours of these objects in order to investigate whether some of these could be compact young star clusters. To avoid the use of the HST colours that may be erroneous due to saturation, we carried out photometry of these objects using the Sloan Digital Sky Survey (SDSS) images and constructed a vs. diagram for the selected objects, which is shown in Figure 2. The main-sequence colours are obtained using the Girardi et al. (2002) calculations for the grid of and , that define each spectral type (Mas-Hesse & Kunth, 1991). Notice that in this diagram the reddening vector is almost orthogonal to the track defined by the spectral types for stars earlier than . The colours of all except 3 objects are consistent with them being stars of spectral types later than . These saturated objects are extemely bright to be stars of M81, and hence, are likely to be foreground Galactic stars. However some of these objects could be GCs. Young clusters are expected to have colours of stars earlier than spectral type , and there are only 3 candidates (shown by filled circles) that can be interpreted as dusty young clusters. None of these are brighter than the brightest selected cluster. Thus, our selection criteria have not eliminated possible bright clusters from our cluster sample.
The selection criteria described above resulted in a catalogue of 1123 compact stellar cluster candidates. Artificial sources due to stellar blending are still present in our catalogue, with their fraction increasing systematically at fainter magnitudes. These contaminating sources are relatively bluer in colour, limiting principally our capability of detection of blue clusters. Hence, we restrict most of our analysis to mag for the blue clusters. For relatively redder clusters, contamination by stellar blending is not a serious limitation allowing us to retain them all the way to mag. After applying this colour-based selection criterion, which will be discussed again in §4.2, we ended up with a list of 435 clusters. The catalogue of Chandar, Ford, & Tsvetanov (2001) contains 114 clusters up to a limiting magnitude of . Thus, our wide-field search has more than tripled the number of clusters in M81.
The magnitude used in this work is parameter calculated in SExtractor. This parameter measures the magnitude by integrating the background-subtracted counts in all the pixels that define the source. Colours were obtained by subtracting the magnitudes calculated within a fixed aperture of diameter=20 pixels. Aperture corrections as suggested by Sirianni et al. (2005) were applied to the magnitudes in each filter. The method adopted by us to calculate colours ensures that the internal errors on the colours are minimum. We estimated the errors on the magnitudes and colours using the multiple observations of the same star as described below.
The 29 ACS fields used in this study offered around 10% area overlap between the adjacent fields (see Fig. 1). The overlap region contained around 30,000 stars. We used the two independent photometric measurements for the common stars in each of the and bands to estimate typical photometric errors on the magnitudes. As expected, errors are found to be the least for bright stars (0.10 mag for mag), increasing systematically for fainter stars (0.20 mag for mag). Similar errors were estimated in all the three filters. Errors on any two bands are found to be uncorrelated, and hence errors on the colours were calculated by quadratically adding the errors on the magnitudes. All the magnitudes and colours quoted in this work are on the standard Vega system of magnitudes.
Our list contains 20 of the 41 spectroscopically confirmed GCs (Schroder et al., 2002; Perelmuter, Brodie, & Huchra, 1995). Among the missing objects, 8 are outside our field of view, and another 8 have stellar appearance (most are saturated) on the ACS images. These objects could be very compact GCs. However, given that the galactic halo stars share the metallicities and radial velocities of the M81 GCs, these 8 objects are most likely to be galactic stars, rather than very compact GCs. These objects are listed in Table 2 along with their observational properties. The remaining eight objects classified as GCs do not satisfy one or the other of our selection criteria. We also recover 53 of the 114 objects reported by Chandar, Tsvetanov, & Ford (2001). The principal reasons for the absence of the rest of the Chandar, Tsvetanov, & Ford (2001) clusters are either they are blended stars (ellipticity) or that they are foreground or M81 field stars wrongly classified as clusters due to the relatively poorer spatial resolution of WFPC2 images as compared to our ACS images. Thus, our catalogue of CSCs supersedes Chandar, Ford, & Tsvetanov (2001) catalogue, both in its robustness of selection and in the spatial coverage.
4 ANALYSIS
4.1 Colour Histogram
In Figure 3, we present the colour histograms for the cluster candidates separately for bright ( mag; solid line) and faint ( mag; dotted line) members of our catalogue. It can be easily noticed that the distribution is bimodal in nature, especially for the brighter sample. Bimodality is also seen in the distribution of the colours for our sample objects. This bimodality has been noticed previously by Chandar, Tsvetanov, & Ford (2001), who used this property to separate GC candidates from the relatively younger clusters. In the next section, we use colour-magnitude diagrams to firmly establish this interpretation. Based on this bimodality, we separated the cluster sample into two groups: a blue group with and a red group with . The colours of the red group members compare well with the colours of GCs in the Milky Way and M31 (Harris, 1996), and the colours of the blue clusters are similar to those of young and intermediate age clusters found in the Magellanic Clouds and M33 (Chandar, Bianchi, & Ford, 1999). In Table 3 we include the physical properties of the brightest compact clusters.

4.2 Colour-Magnitude Diagram

Compact stellar clusters are the closest observational analogs of the theoretically defined simple stellar population (SSP), where all the stars are assumed to form in a single burst. The age and mass of the CSCs can be obtained by comparing their observed colours and magnitudes with the corresponding quantities from a model SSP, in a Colour-Magnitude Diagram (CMD). In Figure 4, we present the CMD, where all the clusters in our sample are plotted, with the blue clusters denoted by rhombus symbols, and the red clusters by circles. Typical photometric errors on colours and magnitudes for point sources are shown on the right-hand side of the plot. The errors on both the magnitudes and colours are expected to be slightly larger for extended objects, such as CSCs. Two SSPs of cluster masses 3 and are shown superposed on the blue group, between the age ranges of 3 Myr to 2 Gyr, and 0.1–1 Gyr, respectively. For the red group, we show the locus of points for various cluster masses, all of age of 5 Gyr. The reddening vectors corresponding to mag are shown at selected points on the SSP. Location of point sources in the CMD is shown by the dots, which occupy mainly the bottom-left part of the diagram. In order to avoid agglomeration of points in the plot, we show only 1 out of 25 stars. Extended sources formed by blending of these point sources are the principal contaminants of our cluster sample at magnitudes fainter than .
The plotted SSPs correspond to Girardi et al. (2002) solar metalicity (z=0.019) models for the blue clusters and models for the red clusters. In their models, the colours and magnitudes were calculated directly for the HST/ACS filters and hence there was no necessity of converting the magnitudes into standard Cousins-Johnson filter system. The models assume a Kroupa initial mass function [IMF, Kroupa (2001)] 111The public distribution of SSPs uses a slightly modified IMF. We multiplied the masses by a factor of 2.5, as suggested by the authors, to bring it to the standard Kroupa IMF .
The brightest blue and red clusters of our sample have mag and , respectively. In the field of view of M81, there are 83 compact objects brighter than these limits. But, from the analysis of their SDSS colours (see §3), we found that only 3 of the 83 objects have colours consistent with those of blue clusters, with none of these 3 brighter than the brightest blue cluster, even after taking into account possible reddening. However the possibility exists, that some of the stellar-like objects are compact GCs in M81.
The difference in colour between the blue and red group clusters is more than a magnitude for the brightest clusters, with the separation gradually decreasing at fainter magnitudes. Before discussing the SSP ages of these populations, we first discuss the mean amount of reddening expected towards the clusters. The foreground Galactic reddening towards M81 is mag (Schlegel, Finkbeiner, & Davis, 1998). Kong et al. (2000) used photometry in 13 bands to map the reddening in spatial scales of 1.7′′. The reddening values they measured in the bulge region was comparable to that expected for the foreground Galactic reddening, indicating the absence of dust there. They estimated a mean reddening of mag ( mag using ) for the disk, including in the spiral arms. However, at the spatial scales of CSCs (few parsecs), reddening could be different, and there are no such measurements for M81. Moreover, one may expect higher reddening values when the clusters are young, with the reddening decreasing once the clusters move out of, or destroy, their parental clouds (Bastian et al., 2005; Mengel et al., 2005). Clusters in the blue group are associated with the spiral arms (see section 4.3), and hence we cannot rule out them being very young clusters. For example, most of the clusters with 19–20 mag, could be reddened young (age Myr) clusters of mass for a reddening value of mag. A visual examination of these clusters indicates that there are dusty features around some of them.
Taking into account the small expected reddening, the plotted SSPs for the masses 3 and represent well the observed distribution of blue group clusters with mag in the CMD. The brightest clusters are expected to be the youngest in a normal star-forming galaxy such as M81 (Bastian, 2008). In such a scenario, the masses for the brightest two clusters would be between 1–2 . The remaining clusters that lie within the 1 observational error from the SSP could be objects with masses marginally above , with their ages ranging between 3 Myr and Myr. The ages could reach up to 300 Myr if their masses are less than 104. At fainter magnitudes ( mag) there are several clusters bluer than the SSP which share the same colour range as that for individual stars. Many of these sources may not be clusters and instead blended stars and hence we exclude them from detailed analysis.
While the observed distribution of blue group clusters closely follows the plotted evolutionary track for mass , the spread in colour is clearly more than that can be accounted by the observational errors. After around 10 Myr, model colour lies between 0.6–0.8 up to around 300 Myr, whereas most of the clusters brighter than mag have colour between 0–1 mag, with the distribution peaking at mag (see Figure 3). The scatter on the redder side can be understood in terms of interstellar reddening. On the other hand, the blueward shift of the distribution with respect to the colour expected for the 10–300 Myr SSP could be due to the stochastic sampling of the stellar IMF that affects the colours of low-mass clusters (Cerviño & Luridiana, 2004; Maiz-Apellaniz, 2009). Hence, the presence of many clusters bluer than mag suggests that majority of the clusters has mass of .
The clusters in the red group are consistent with an SSP of age between 2–12 Gyr, with the mean colour of the group corresponding to an age of 5 Gyr. The distribution of the magnitudes is entirely caused by the distribution of masses of these clusters. Observed range of magnitudes corresponds to a mass range of . Notice that a change in the age by a factor of 2 implies a change in the mass by also a factor of 2 in this range of ages. The derived range of masses are similar to the values expected for globular clusters (Harris, 1996). It may be noted that 20 of our objects have been spectroscopically confirmed as globular clusters. Thus it is very likely that most of the red group objects are globular clusters.
The above analysis has established the blue and red groups as two distinct families, the former belonging to the class of Super Stellar Clusters seen in starburst environments, and the latter being globular clusters. There is a possibility, though very unlikely, that both belong to a single family, and extinction separates them artificially into blue and red groups. For this to happen, all red group clusters should be experiencing an extinction mag. This would imply that the red clusters are preferentially associated to high extinction zones such as the spiral arms. The discussion in the next section, where we analyze the spatial distribution of the clusters in these two groups, clearly discards such a possibility.
4.3 Spatial Distribution
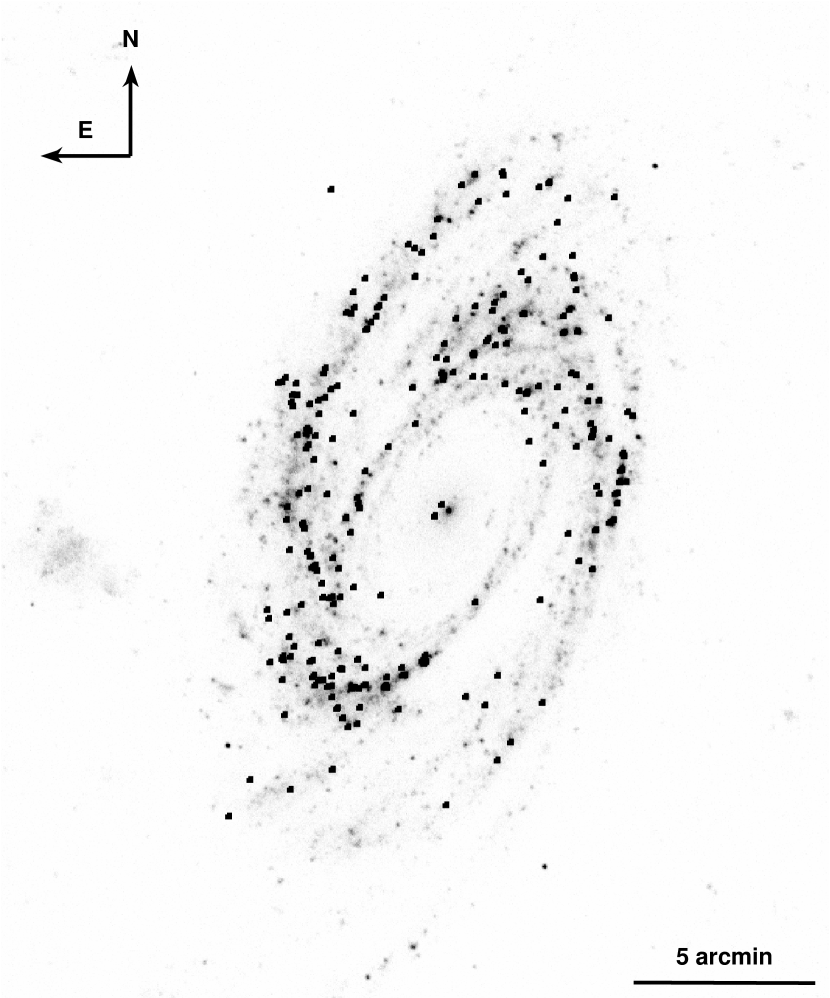
The spatial distribution of the blue clusters brighter than mag is presented in Figure 5, where the gray scale image is the near UV image obtained from the GALEX archive 222http://galex.stsci.edu/GR4/. The UV image traces star forming regions younger than 1 Gyr and delineate the position of the spiral arms in M81 (Martin et al., 2005). The young clusters are located mainly on top of the spiral arms, suggesting that they are spatially and kinematically related to the population producing the UV emission.
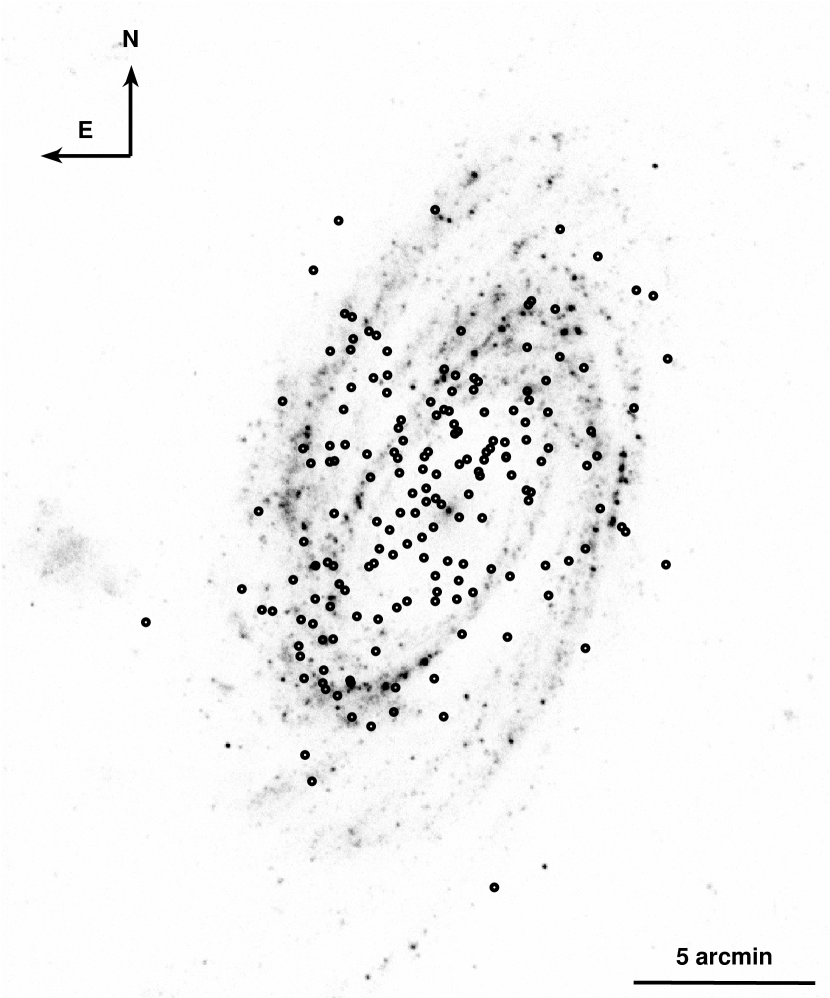
On the other hand, the red clusters are homogeneously distributed over the face of M81 (see Figure 6). Most of the clusters are seen at small radii, superposed on the bulge, with their number decreasing rapidly in the outer parts. It may be recalled that the bulge region hardly suffers any interstellar extinction (Kong et al., 2000), and hence the association of the red clusters with low extinction zones again re-iterates the idea that reddening is not the reason for their red colours, instead they are globular clusters.
4.4 Luminosity Functions
4.4.1 Blue group clusters
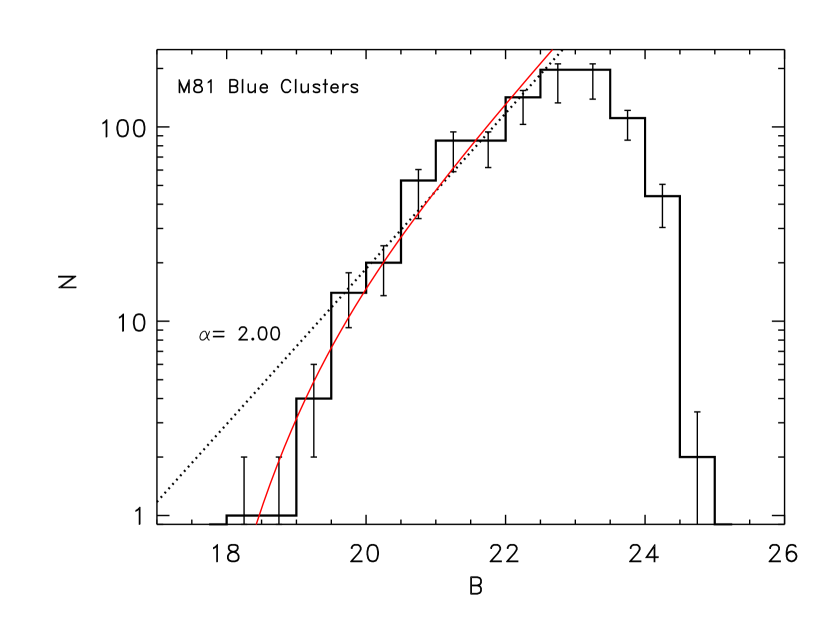
A histogram of the -band luminosity function (LF) of the clusters of the blue group is shown in Figure 7. In the magnitude range B=19–22 mag, the histogram follows a power law of index (dotted line). An un-biased fitting method which makes use of variable bin sizes (Maíz Apellániz & Úbeda, 2005) gives a value for the power law index . The histogram shows a peak at around 23 mag, deviating systematically from the power-law at fainter magnitudes. This decrease could be due to an intrinsic drop of the number of low luminosity (and mass) clusters. However, incompleteness of the sample at mag contributes significantly to the turnover. The incompleteness originates due to one of the selection criteria we have imposed which requires selected clusters to have a minimum AREA of 50 pixels. Compact clusters ( pixels) fainter than mag do not satisfy this criteria, and hence are missing from our cluster sample.
A power-law index of , obtained in this study is the canonical value found in young stellar clusters in many starburst galaxies (Elson & Fall, 1985; de Grijs et al., 2003). On the brighter end of the -band LF, the observed number of clusters is systematically smaller than that expected for a power-law of index 2 — the sample contains six blue clusters brighter than B=19.5 mag, whereas 18 such clusters are expected for a power-law of index . Significantly, there are no blue clusters brighter than mag (i.e. mass; see Figure 4). Gieles (2009) has found that a Schechter function fits better the observational data than a power-law function in the whole range of cluster luminosities. We show in Figure 7 that a Schechter function fits our data also very well. The characteristic luminosity of the best-fitting function is mag, which is more than 2 mag fainter than that expected for the characteristic mass obtained by Gieles (2009). This issue is discussed more in detail later in this section.
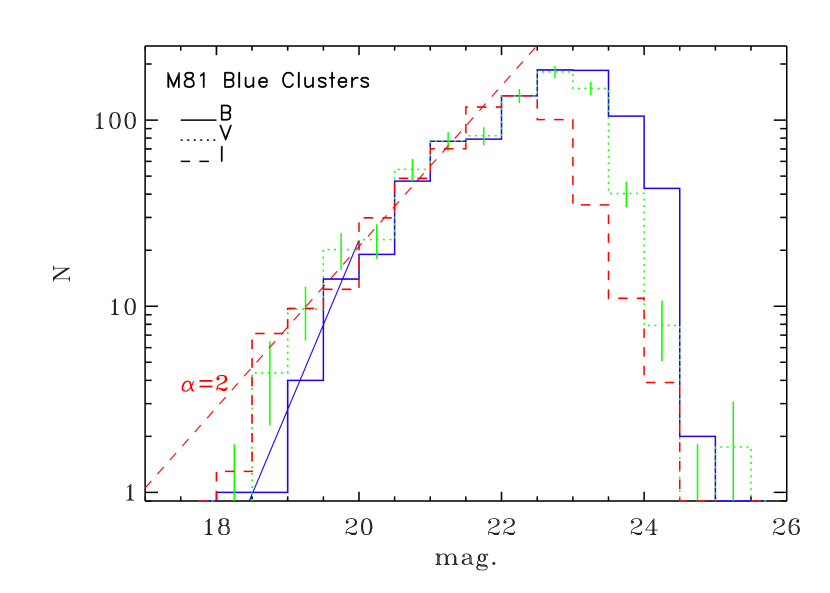
Gieles (2009) studied the steepening of the power-law as a function of wavelength, and found that the function steepens more at longer wavelengths as expected for Schechter functions. This tendency for steepening of the luminosity function at high luminosities (or equivalently mass) has been noted in several recent studies (Haas et al., 2008; Larsen, 2009). Given the relatively small number of clusters in our M81 sample, we could reliably obtain slopes in only two magnitude ranges — the dividing magnitude being 20. The resulting piece-wise linear fit to the B-band data is shown in Figure 8, where we can clearly see that the brighter-end slope is steeper. In the other two bands, a power law with fits well the entire range. Thus, we don’t see the trend reported by Gieles (2009) for M51 in our dataset for M81. The extinction seems to be the reason for the steepening at the bright end. We examined the HST image around the 10 brightest -band clusters, and found traces of dust lanes running close to these clusters, which agrees with the above interpretation. Hence, the conclusions derived from only the -band LF could be misleading unless it is confronted with the -band LF.

Whereas the B-band LF can be fitted with a Schechter function, the I-band LF shows signature of a truncated power-law. We carried out the statistical tests suggested by Maschberger & Kroupa (2009) and firmly established the existence of a truncation in the LF as can be seen in Figure 9. The modified maximum likelihood method gives us an index of and an upper limit of 18.0 mag. The graphical inspection of the data through the stabilized percentile-percentile plot (Figure 9) and the different goodness of fit test applied to the data confirm the nature of the observed LF333We carried out the 10 different tests suggested by Maschberger & Kroupa (2009), and all of them are consistent with the observed distribution being a truncated PL.. The observed truncation in LF corresponds to a mass of for clusters of 7 Myr age, and for 10 Myr age. If the clusters are younger than 7 Myr, the truncation mass would be even less. This mass is an order of magnitude lower as compared to the universal characteristic mass suggested by Larsen (2009). Only if all the brightest clusters are as old as 100 Myr, the truncation mass in M81 would correspond to the values obtained by Larsen (2009). In general, the brightest clusters in normal star-forming galaxies such as M81 are also the youngest (Bastian 2008). Hence, it is very unlikely that bright clusters in M81 are as old as 100 Myr. Thus, the inescapable conclusion from the above analysis is that the cluster data of M81 are not consistent with the idea that the characteristic mass of the LF is universal at .
The lower truncation mass in M81 can also be infered by the relation between the absolute magnitude of the brightest cluster, (brightest) vs. the SFR of the host galaxy, as is illustrated by Bastian (2008). For the currently observed SFR of 0.75 M yr-1 (Karachentsev & Kaisin, 2007) in M81, the expected (brightest) mag, whereas the observed brightest cluster has mag, which lies about below the relation found in Bastian (2008). Such a low truncation mass is also observed in M31 (Vansevičius et al., 2009), which is another normal star-forming galaxy like M81.
The interaction between M81 and its neighbour M82 had triggered a disk-wide starburst in M82 around 300 Myr ago, that formed a rich population of compact clusters in the disk of M82 (Mayya et al., 2006, 2008). It is very likely that the population of intermediate age clusters in M81 is also formed following the same interaction event, and hence are coeval with the cluster population of M82. So, it is interesting to compare the luminosity functions of the cluster populations of these two galaxies. Though the two galaxies are at the same distance, the vast difference in extinction between the two galaxies ( mag in M81 as compared to 1–6 mag in M82), inhibits a direct comparison of the observed LFs. In M82, a power-law index of was obtained for the mass function, which is expected to be the index of the luminosity function. Thus, observed indices of the intermediate-age populations are distinctly different in M81 and M82. Another important difference in the cluster populations in these two galaxies is the mass range of clusters — there are no clusters massive than in M81, whereas all the reported 393 intermediate-age clusters of M82 have masses . The low value for the truncation mass observed in M81 is the reason for the absence of massive clusters.
A possible reason for the absence of high mass clusters in M81 is that it is a normal galaxy, whereas objects analyzed by Bastian (2008) are either starburst galaxies or small galaxies with localized star forming sites. As discussed by Ashman & Zepf (2001), the formation of high-mass compact clusters requires very high density gas, which is possible only if the available gas mass is concentrated locally in regions of few tens of parsecs. Such a condition can be easily satisfied in starburst galaxies/regions such as studied by Bastian (2008), but not in normal giant galaxies such as M81, where the star-forming sites (clusters) are distributed throughout its large disk, as is illustrated in our Figure 5. The specific star formation rate – defined as the SFR per unit of mass – could play an important role in the formation of the most massive clusters observed in a galaxy. Therefore, it will be interesting to extend the study of the cluster population to more quiescent galaxies in order to establish whether the (brightest) depends on the global SFR or on the specific SFR.
4.4.2 Red group clusters
The LF for the red group clusters is plotted in Figure 10 along with that for the Milky Way globular clusters from Harris (1996). It can be seen that the two distributions agree very well for mag ( mag), which is the completeness limit of our observations. The turnover in the distribution of Milky Way globular clusters at [, Harris (1996)] is also present in the distribution of the red group clusters of M81. Notice that, we have detected 172 globular clusters, which compares well with the 146 globular clusters in the Milky Way. It is heartening to find that the numbers and the LF between M81 and the Milky Way coincide, in spite of the complexity involved in the selection process.
Our dataset allows us to compare the basic observational parameters of the brightest GC in M81 (R05R06584; Table 3) to the corresponding ones in other nearby galaxies, in particular those in the Milky Way ( Cen) and M31 (G1). Its colours are marginally bluer as compared to the typical MW GCs, and suggest an age of Gyr. Its absolute -band magnitude corrected for Galactic extinction is mag, which is mag brighter than Cen, and mag brighter than G1 (Meylan et al., 2001). We derive a photometric mass of , using the Girardi et al. (2002) Z=0.008 metallicity models. These derived properties indicate that the brightest GC in M81 is the most massive among the nearby galaxies. Follow-up spectroscopic studies of this object will be invaluable in refining its mass and metallicity.

5 DISCUSSION AND CONCLUSIONS
Thanks to the superb spatial resolution of the ACS camera on board the HST, we were able to obtain the largest sample of CSCs in M81 until now. We found a total population of 435 CSCs brighter than mag, which increases by a factor of three the number of M81 CSCs catalogued previously by Chandar, Ford, & Tsvetanov (2001). The sample is divided into two well-defined populations: (a) a blue group with ages 300 Myr, masses and distributed along the spiral arms of M81, and (b) a red group with ages 2–12 Gyr, masses between and that are distributed uniformly across the face of M81.
Multi-band photometric and spectroscopic work on the M82 cluster population seems to strongly favour an age of the M81/M82 interaction at 200-300 Myr. These ages are in agreement with the results from numerical simulations (Yun, Ho, & Lo, 1994; Yun, 1999). Hence, it is very likely that the same interaction also triggered the formation of blue clusters in M81 as speculated by Chandar, Ford, & Tsvetanov (2001). However, it is important to remember that a firm conclusion on this will have to wait for the spectroscopic confirmation of the ages. Moreover, there is a large number of clusters below our confusion limit of mag, which could have been formed before the interaction event (age Myr; Figure 4) if they are more massive than . If the age of this population is confirmed to be older than Myr, then these faint clusters could be part of the normal star formation occurring in the disk of M81. In such a case, the observed population of mag clusters discussed throughout this paper could as well be due to the normal star formation occurring in the disk of M81 independent of the interaction.
The -band luminosity function of young clusters follows a power-law distribution with an index . However, the commonly used -band LF is better fitted with a double power law or a Schechter function with a characteristic magnitude of . After careful examination of the -band brightest objects, which are probably the youngest, we conclude that the difference between the LFs in the I and B bands arises due to systematically higher extinction towards bright regions, thus affecting the high end of the LF of the B-band. The -band LF truncates at the bright-end at mag (), which corresponds to a mass of , if the brightest clusters are younger than 10 Myr. Thus, there is a clear absence of massive clusters in M81 as compared to those observed in M82 (Mayya et al., 2008) and other starburst galaxies (Bastian, 2008). Models advocating universal characteristic masses of are inconsistent with the infered low truncation mass in M81.
M81 is comparable to the Milky Way in its mass and morphology. GCs provide a means to investigate the early formation history of galaxies. We find that the total number of GCs as well as their luminosity distribution in M81 is very similar to that for the Milky Way. Thus, both these galaxies had very similar formation histories. The close encounter of M82 with M81 possibly created a new generation of compact clusters in the disk but did not affect the distribution of old clusters that were in place at the time of the encounter.
6 ACKNOWLEDGMENTS
We would like to thank the Hubble Heritage Team at the Space Telescope Science Institute for making the M81 images publicly available. We thank Thomas Maschberger and Pavel Kroupa for making the statistical codes used in this work available through a dedicated web page. We acknowledge the contribution to this work in the form of discussions with our colleagues Luis Carrasco, Lino Rodriguez, Abraham Luna and Olga Vega throughout the duration of the project. This work was supported by CONACyT (México) fellowship grants 4464 and project numbers 58956-F and 49942-F. The authors are very grateful to an anonymous referee whose comments and suggestions largely improved the clarity of this paper.
References
- Ashman & Zepf (2001) Ashman K. M., Zepf S. E., 2001, AJ, 122, 1888
- Barmby (2003) Barmby P., 2003, in Kissler-Patig M., ed., Extragalactic Globular Cluster Systems. Springer, New York, p. 143.
- Barmby et al. (2006) Barmby P., Kuntz K. D., Huchra J. P., Brodie J. P., 2006, AJ, 132, 883
- Bastian et al. (2005) Bastian N., Gieles M., Lamers H. J. G. L. M., Scheepmaker R. A., de Grijs R., 2005, A&A, 431, 905
- Bastian (2008) Bastian N., 2008, MNRAS, 390, 759
- Bertin & Arnouts (1996) Bertin E., Arnouts S., 1996, A&AS, 117, 393
- Brodie & Huchra (1991) Brodie J. P., Huchra J. P., 1991, ApJ, 379, 157
- Brouillet, Combes, & Baudry (1991) Brouillet N., Combes F., Baudry A., 1991, IAUS, 146, 347
- Cardelli, Clayton, & Mathis (1989) Cardelli J. A., Clayton G. C., Mathis J. S., 1989, ApJ, 345, 245
- Cerviño & Luridiana (2004) Cerviño M., Luridiana V., 2004, A&A, 413, 145
- Chandar, Bianchi, & Ford (1999) Chandar R., Bianchi L., Ford H. C., 1999, ApJ, 517, 668
- Chandar, Ford, & Tsvetanov (2001) Chandar R., Ford H. C., Tsvetanov Z., 2001, AJ, 122, 1330
- Chandar, Tsvetanov, & Ford (2001) Chandar R., Tsvetanov Z., Ford H. C., 2001, AJ, 122, 1342
- de Grijs et al. (2003) de Grijs R., Anders P., Bastian N., Lynds R., Lamers H. J. G. L. M., O’Neil E. J., 2003, MNRAS, 343, 1285
- Elson & Fall (1985) Elson R. A. W., Fall S. M., 1985, PASP, 97, 692
- Freedman et al. (1994) Freedman W. L., et al., 1994, ApJ, 427, 628
- Gieles (2009) Gieles M., 2009, MNRAS, 394, 2113
- Girardi et al. (2002) Girardi L., Bertelli G., Bressan A., Chiosi C., Groenewegen M. A. T., Marigo P., Salasnich B., Weiss A., 2002, A&A, 391, 195
- Haas et al. (2008) Haas M. R., Gieles M., Scheepmaker R. A., Larsen S. S., Lamers H. J. G. L. M., 2008, A&A, 487, 937
- Harris (1996) Harris W. E., 1996, AJ, 112, 1487
- Holtzman et al. (1992) Holtzman J. A., et al., 1992, AJ, 103, 691
- Karachentsev & Kaisin (2007) Karachentsev I. D., Kaisin S. S., 2007, AJ, 133, 1883
- Kong et al. (2000) Kong X., et al., 2000, AJ, 119, 2745
- Konstantopoulos et al. (2009) Konstantopoulos I. S., Bastian N., Smith L. J., Westmoquette M. S., Trancho G., Gallagher J. S., 2009, ApJ, 701, 1015
- Kroupa (2001) Kroupa P., 2001, MNRAS, 322, 231
- Larsen (2009) Larsen S. S., 2009, A&A, 494, 539
- Maíz Apellániz & Úbeda (2005) Maíz Apellániz J., Úbeda L., 2005, ApJ, 629, 873
- Maiz-Apellaniz (2009) Maiz-Apellaniz J., 2009, ApJ, 699, 1938
- Martin et al. (2005) Martin D. C., et al., 2005, ApJ, 619, L1
- Maschberger & Kroupa (2009) Maschberger T., Kroupa P., 2009, MNRAS, 395, 931
- Mas-Hesse & Kunth (1991) Mas-Hesse J. M., Kunth D., 1991, A&AS, 88, 399
- Mayya et al. (2006) Mayya, Y. D., Bressan, A., Carrasco, L., & Hernandez, L. 2006, ApJ, 649, 172
- Mayya et al. (2008) Mayya Y. D., Romano R., Rodríguez-Merino L. H., Luna A., Carrasco L., Rosa-González D., 2008, ApJ, 679, 404
- Mengel et al. (2005) Mengel S., Lehnert M. D., Thatte N., Genzel R., 2005, A&A, 443, 41
- Meurer (1995) Meurer G. R., 1995, Nature, 375, 742
- Meylan et al. (2001) Meylan G., Sarajedini A., Jablonka P., Djorgovski S. G., Bridges T., Rich R. M., 2001, AJ, 122, 830
- Mutchler et al. (2007) Mutchler M., et al., 2007, PASP, 119, 1
- Perelmuter, Brodie, & Huchra (1995) Perelmuter J.-M., Brodie J. P., Huchra J. P., 1995, AJ, 110, 620
- Perelmuter & Racine (1995) Perelmuter J.-M., Racine R., 1995, AJ, 109, 1055
- Sandage (1984) Sandage A., 1984, AJ, 89, 621
- Santiago-Cortes, Mayya, & Rosa-González (2009) Santiago-Cortés M., Mayya Y. D., Rosa-González D., 2009, RevMexAA, Serie de Conferencias, 37, 170. ”A Long Walk Through Astronomy: A Celebration of Luis Carrasco’s 60th Birthday”, Huatulco, Mexico, October 2008, ed. E. Recillas, L. Aguilar, A. Luna, and J.R. Valdes
- Scheepmaker et al. (2007) Scheepmaker R. A., Haas M. R., Gieles M., Bastian N., Larsen S. S., Lamers H. J. G. L. M., 2007, A&A, 469, 925
- Schlegel, Finkbeiner, & Davis (1998) Schlegel D. J., Finkbeiner D. P., Davis M., 1998, ApJ, 500, 525
- Schroder et al. (2002) Schroder L. L., Brodie J. P., Kissler-Patig M., Huchra J. P., Phillips A. C., 2002, AJ, 123, 2473
- Sirianni et al. (2005) Sirianni et al., 2005, PASP, 117, 1049
- Vansevičius et al. (2009) Vansevičius V., Kodaira K., Narbutis D., Stonkutė R., Bridžius A., Deveikis V., Semionov D., 2009, ApJ, 703, 1872
- Whitmore et al. (1999) Whitmore B. C., Zhang Q., Leitherer C., Fall S. M., Schweizer F., Miller B. W., 1999, AJ, 118, 1551
- Yun, Ho, & Lo (1994) Yun M. S., Ho P. T. P., Lo K. Y., 1994, Natur, 372, 530
- Yun (1999) Yun M. S., 1999, IAUS, 186, 81