Mass-dependent evolution of the relation between supermassive black hole mass and host spheroid mass since z 1
Abstract
We investigate the evolution of supermassive black hole mass () and the host spheroid mass () in order to track the history of the - relationship. The typical mass increase of is calculated by a continuity equation and accretion history, which is estimated from the active galactic nucleus (AGN) luminosity function. The increase in is also calculated by using a continuity equation and a star formation model, which uses observational data for the formation rate and stellar mass function. We find that the black hole to spheroid mass ratio is expected to be substantially unchanged since for high mass objects ( and ). In the same redshift range, the spheroid mass is found to increase more rapidly than the black hole mass if . The proposed mass-dependent model is consistent with the current available observational data in the - diagram.
keywords:
black hole physics – galaxies:evolution – galaxies:active – quasar:general.1 INTRODUCTION
Recent observations show that most, if not all, nearby massive spheroids (elliptical galaxies, lenticular and spiral bulges) have supermassive black holes(SMBHs) with masses in the range of - at their center. In the local universe, the SMBH mass is correlated with characteristic parameters of the host spheroid: the luminosity (, 1995, 2003, 2007), the mass of the spheroid (, 1998, 2004), the stellar velocity dispersion (, 2000, 2000, 2002) and the various other properties (e.g., (2007, 2007, 2008)). Understanding the origin of these relations is thought to provide insights into the ”co-evolution” of SMBHs and the host spheroids. The role of central black holes in galaxy formation and evolution is not yet established since the SMBH mass is tiny compared with the galaxy as a whole. Areas that are understood at present, as well as those suggested for future observation, were recently reviewed in (2009). Some tentative theories have been proposed to clarify the origin of these correlations (e.g., (1998)), and they are fairly successful at reproducing the correlations at the present time. However, no theoretical model is widely accepted since there are many unknown parameters in the evolutionary model. For example, in semianalytic models, depending on the model assumptions, the evolution of the scaling relation differs markedly (e.g., (2006, 2009)). Therefore, it would be of value to study the evolution using an alternative approach.
Cosmic evolution of the ratio / is observationally studied. (2006) used the 3C RR sample of radio-loud active galactic nuclei (AGNs) for . The number of sources for each redshift bin is not sufficiently large to examine the -dependence. By fitting data for the relation /, the index is estimated as , although data for are also consistent with no evolution (). (2007) also derived a similar result for SMBH masses in a sample of 20 Seyfert galaxies around ; however, the evolution was slightly weak, /. It is not easy at present to judge whether or not cosmological evolution exists, due to several selection biases (, 2007).
The evolution of the correlations can also be inferred from the demographics of galaxies and AGNs (, 2004). In some reasonable theories, the nuclear activity of AGNs is proportional to the mass accretion rate into the SMBHs. The luminosity function of AGNs and the redshift evolution measure the buildup of SMBH mass (e.g., (1982)). The evolution of the galaxies is related to the star formation history. (2004) combined the evolution of the SMBH mass density derived from the mass accretion history with that of the stellar mass density derived from the star formation history of the Universe, in order to investigate the evolution of the - relation. They found that the growth of SMBHs appears to predate that of spheroids as /, for which the power index of the redshift factor is smaller than that obtained by observations.
Here, we consider the evolutionary model by taking into account the mass-dependent growth in the phenomenological analysis. That is, a simple power-law relation /, is not assumed. Only integrated quantities have been used so far in phenomenological studies (e.g., (2004)). Our model is an improvement of previous models, in which the mass-dependent effect is now included as an important factor. The mass-dependent property of cosmological evolution is known as ”downsizing”, in which star formation becomes active in less massive galaxies as the cosmic time increases (e.g., (1996)). Similarly, an increase in the number of AGNs with redshift compared with the local universe is followed by a decline beyond a peak whose redshift depends on luminosity and hence on the SMBH mass, assuming a constant Eddington ratio (e.g., (2009)). More recently, (2009) have studied the mass dependence of redshift for active black holes by using the Malmquist-bias-unaffected method, and argued that AGN samples at lower redshifts are increasingly dominated by less massive black holes. These observations suggest that the evolution of both SMBH mass and galaxy mass depends on their masses. In this paper, we extend the evolutionary models based on the AGN luminosity function and star formation history by including the mass-dependent effect and derive the evolution of the - relation at certain cosmic ages.
We organize the paper as follows. In Section 2, we briefly review the evolutionary model of SMBHs considered by (2004, 2009), in order to clarify the model parameters. We assume a mean Eddington ratio for the active SMBHs. By adopting a continuity equation and an assumed initial condition, the AGN luminosity function correlates directly with the SMBH mass function at all times. In Section 3, we describe the evolution model of spheroids. Using a method similar to that used for SMBHs, that is, a continuity equation and an assumed initial condition, the stellar mass function and specific star formation rate are used to calculate the mass increase of the spheroids. In Section 4, we combine these two evolutionary models and discuss the evolution of the - relation. Finally in Section 5, we provide a summary. Throughout the paper, we adopt a cosmology with , and km s-1 Mpc-1.
2 EVOLUTIONARY MODEL OF BLACK HOLES
In the following section, we review the evolutionary equation of the SMBH mass function according to (2004, 2009). The mass of black holes generally increases through mass accretion, which also causes AGN activity. The SMBH mass function is therefore determined from the observed luminosity function of AGNs (e.g., (1971, 1992, 2004, 2009)). We assume that AGNs are powered by accretion into SMBHs, and that SMBH growth takes place during a phase in which the AGN is shining at a fraction of the Eddington luminosity, converting the mass accretion rate with a radiative efficiency . The number density of SMBHs with mass in co-moving space is denoted by , which satisfies the continuity equation
| (1) |
where represents the mean mass-growth rate of at time . The mass growth is related to AGN activity and hence is expressed by the bolometric luminosity function of the AGNs. (2004) derived an evolutionary equation of the SMBH number as
| (2) |
where is the Eddington time.
The mass growth of SMBHs between redshifts and is calculated by the integration
| (3) | |||||
The evolutions of SMBH mass density and typical mass at are calculated by using eqs. (2) and (3), which are expressed by the AGN luminosity function with two parameters and . We adopt the AGN luminosity function of (2009) with a smoothing modification by (2009). The observed AGN luminosity function is converted to the bolometric luminosity by using the luminosity-dependent correction of (2004). The initial condition for the integration of eq. (3) is chosen as the condition at , which is the same as (2009). They noted that the integration does not significantly depend on the initial value after unless the SMBH duty cycle is extremely small.
In order to constrain the free parameters and , we compare the local SMBH mass function derived from the evolution model with an observational value. (2009) carried out a detailed comparison by using the SMBH mass function derived by various methods. We also obtained the same results as (2009), even when including the technical smoothing modification. The best-fitting values are and . Uncertainty in the radiative efficiency is not a highly important parameter affecting the mass growth of SMBHs since it affects only the overall normalization. The parameter is fixed as from now on. The Eddington ratio is a critical parameter describing SMBH evolution. (2009) estimated a reasonable range of their model parameter, which is converted as -. The range implies not uncertainty in any statistical sense, but rather a preferable range.
In Figure 1, we plot the averaged growth history of SMBHs with different masses for . The mass range of black holes for which current observational data are available is limited to . It is clear that the growth depends on black hole mass. A black hole with rapidly increases its mass from to , while one with stops its growth at . We also demonstrate the upper and lower limits of the Eddington ratio for two representative evolutionary tracks as shaded areas. One is the track of at , and the other is . We find that the uncertainty is important around the bend of the curve, where the growth is rapid. The uncertainty does not seriously affect the evolution for . The uncertainty in the track of less massive black holes can be clearly seen, for example, dex in for at .
3 EVOLUTIONARY MODEL OF SPHEROIDS
In this section, we introduce a simple model of spheroid mass evolution. It is well known that galaxies form two sequences in color-magnitude space: star-forming, late-type galaxies occupy the blue cloud, whereas quiescent, bulge-dominated early-type galaxies reside on the red sequence (e.g., (2004)). We focus on early type galaxies and derive the spheroid mass evolution assuming a fixed bulge-to-total ratio (B/T).
We use the method reported by (2007) to determine the evolution of the stellar mass function. The number densities of both the early- and late-type galaxies, respectively, satisfy the continuity equation with a source function for each type as
| (4) |
| (5) |
For all galaxies, we have
| (6) |
where
| (7) |
| (8) |
| (9) |
(2007) calculated the evolution of the mass function for all galaxies with an assumption and found that the results were consistent with the observational COMBO-17 data at (, 2006). They also found by comparing the observed mass function of all galaxies with that of late-type galaxies between and . We adopt both conditions in our analysis. The continuity can be written as
| (10) | |||||
where
| (11) |
The typical mass of the early-type galaxies is obtained by integrating the equation
| (12) |
The spheroid mass evolution is determined from the stellar mass function of early-type galaxies adopting B/T=0.7, which does not depend on the redshift or galaxy mass (see (2006)).
The mass increase is determined by the star formation rate. We adopt the staged model introduced by (2007) and use the same values and uncertainty ranges. The main model parameters are and , which control the gas exhaustion timescale and the formation redshift, respectively. The model by (2007) is consistent with observations over a wide range of masses and may be used as a well-fitting formulation of specific star formation rate (SSFR). Figure 2 shows the SSFR at 0.3, 0.5, 0.7 and 0.9. Here we include much more observational data, and obtain the same results as (2007). For the stellar mass function data, we use the data of (2010) from the COSMOS survey covering 2-deg2, in which morphological and spectral classifications were carried out. The combined classifications allow us to isolate the ”blue elliptical” galaxies that are not included in the red sequence. We use the early-type (elliptical in (2010)) galaxy mass function at as the spheroid mass function.
The mass evolution is determined by easily integrating eq. (12) since eq. (11) is expressed as a smooth curve. The results are shown in Figure 3. It is found that there is no significant growth in the mass range of . As discussed regarding the evolution of SMBHs, uncertainty in the model parameters is important in the phase of rapid growth. The parameters of spheroid evolution are the B/T ratio, and the SSFR parameters ( and ). We use B/T=0.7, but examine the variation for 0.4 B/T 1, which (2002) considered as a reasonable range. The range of variation is shown for two evolutionary tracks in Figure 3. The uncertainty in for at is dex. This uncertainty can be neglected for . We also examine the variation due to the SSFR parameters in Figure 4. It is found that the variation in the SSFR parameters affects the evolution more strongly than that in the B/T ratio. However, neither affects the spheroid evolution for .
4 RESULTS
4.1 Evolution of the - relation
The combination of models for SMBH mass and spheroid mass allows us to investigate the mass-dependent evolution of the - relation. In the local universe, the - relation found by (2004) satisfies
| (13) |
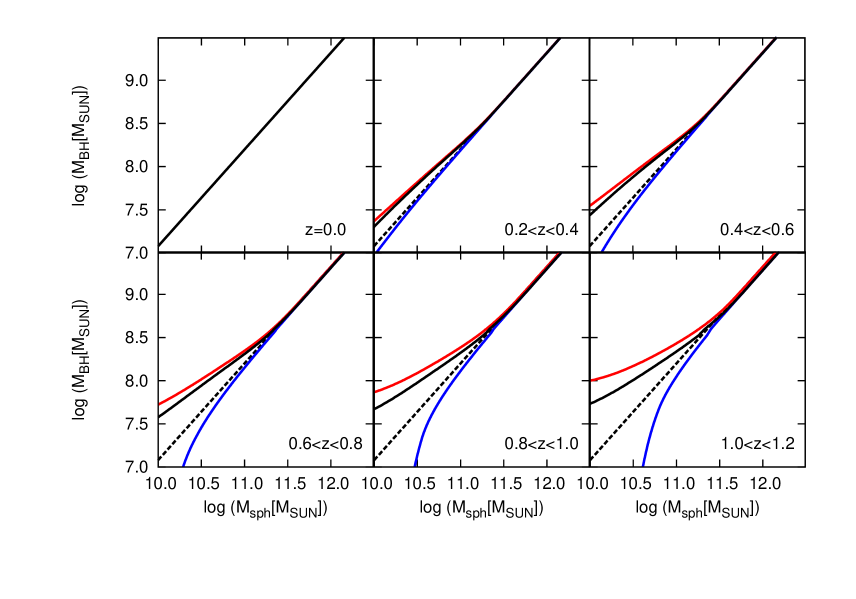
Using this, we consider the relation at . Figure 5 shows our results for a reference model with , B/T=0.7, and . In order to account for the intrinsic scatter at , we add an offset of dex (, 2004) in eq. (13), so that two curves corresponding to upper and lower limits are also plotted at each value of . We found that the - relation does not change since in the region for and . The reason is clear in Figures 1 and 3, where no evolution was seen in either mass on the massive side. On the other hand, there is a significant deviation from the linear relation when . This denotes that a massive BH with is already located at a relatively small spheroid mass of at . The spheroid mass subsequently increases to , while is fixed at . In order to evaluate the increase of the SMBH mass for a fixed spheroid mass , we consider the difference . When the evolution is plotted as , we obtain at , at and at . In the higher-mass regime of , no significant evolution is found. Thus, the evolution of the - relation at clearly depends on the mass range. The growth is more rapid for a smaller spheroid mass. If we integrate the relation with the mass function over the whole mass range, then the averaged power index becomes . We show the relation with for comparison in subsection 4.2 (Figure 8). This parameterization for evaluating cosmological evolution has been used by (2004), and our result is consistent with their value within an error of . The index of the average is almost the same as that of the previous phenomenological model (e.g., (2004)), but mass-dependent evolution, especially at lower mass, is a remarkable new property in our model.
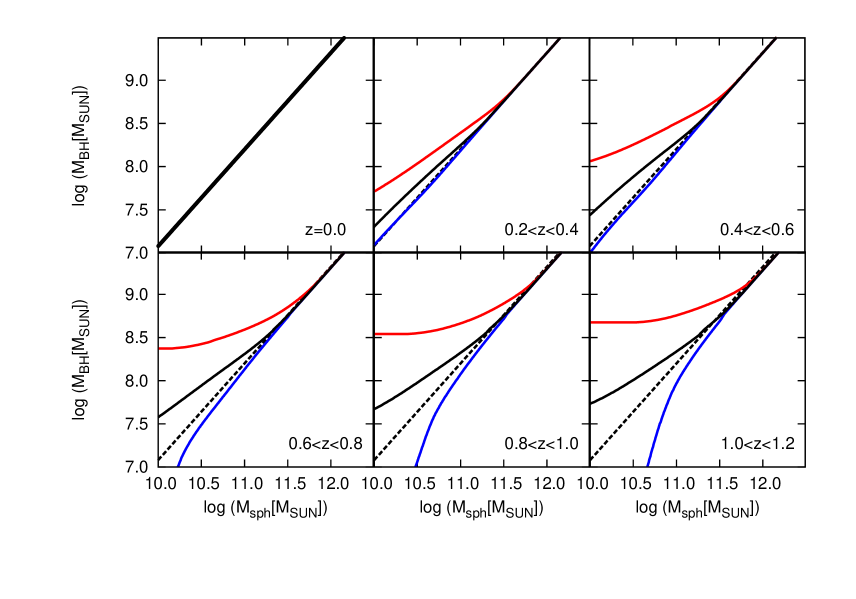
In order to compare the growth of SMBHs and spheroids, we present two extreme cases in Figure 6. One is calculated without evolution of SMBHs, and the other is calculated without evolution of spheroids. Both two curves deviate from our reference model as well as from the - relation at , as increases. The deviation is remarkable at lower mass. However, our reference model is close to the curve for no evolution of SMBHs. This means that the mass increase of the spheroids around is more rapid.
We examine the model parameters discussed in Section 2 and 3 to demonstrate deviation from the reference model. The three parameters are independent and the results change monotonically as each parameter is changed. Thus, we have calculated two extreme cases: upper and lower limits of the - relation. These results are shown in Figure 7. For the model with and , which corresponds to the curve for the upper limit in Figure 7, the distribution of in the range of is a nearly horizontal line at . On the other hand, for and , corresponding to the curve for the lower limit in Figure 7, the distribution in the same range is even lower than that of the local relation. For lower masses, the deviation from the linear line is general, and the typical SMBH mass depends on the model. For example, our model shows that ranges from to for at . The possible range of masses is wide, but our reference model, which can be regarded as an average of two extreme cases, suggests slightly larger SMBH mass than that of the local universe relation. It is also found that the relation is not affected in the mass range of .
4.2 Comparison with observations
In this subsection, we compare our model with observational results available in the literature. (2006) investigated the evolution of the SMBH-to-host galaxy mass ratio in the redshift range of . They estimated the masses for the 3C RR quasars and spheroid masses for the 3C RR radio galaxies. Two samples are not the same, but the averaged mass was determined. Recently, (2009b) studied the redshift dependence of the relation up to using a sample of 96 quasars for which the host galaxy luminosity is known. They listed and for each source. Both results are used for comparison after we derive from the observational data by the same method. Black hole masses are usually estimated by the virial method (e.g., (2002, 2006)). The masses are derived from the broad emission-line width as a velocity indicator, and the monochromatic continuum luminosity is used as an indicator of the region size:
| (14) |
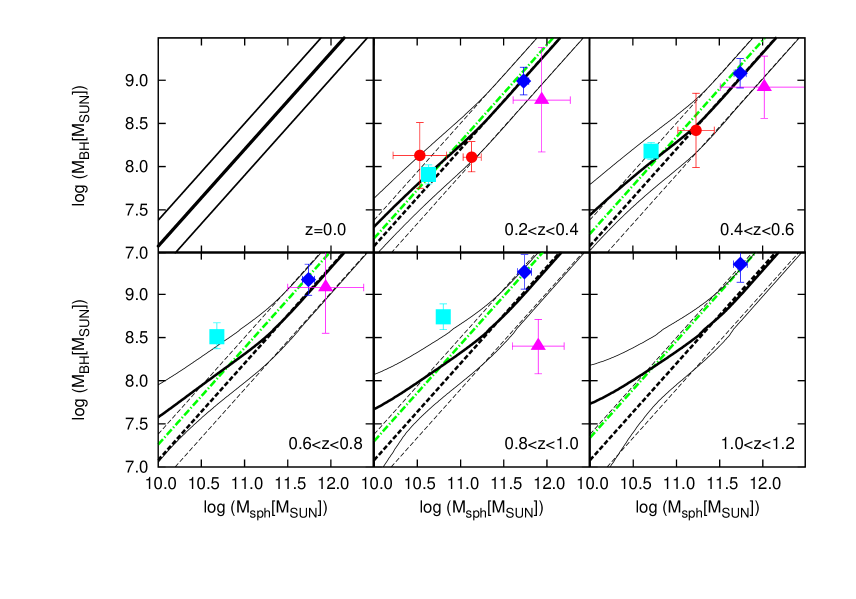
where and are constants. The line width is typically taken from the broad line of MgII or H, and the luminosity is taken at 3000Åor 5100Å. The constants and have not been determined with high accuracy, since the best fit values slightly depend on observational choices of and . The black hole masses are derived by a different choice of and in the works of (2006) and (2009b). It is preferable to use a single formula for the estimation. One possible approach is to use the values, and , derived by (2008), who cross-calibrated a number of different formulae in a redshift range where more than one broad emission line could be observed simultaneously in optical spectra. We adopt their calibrated values for and , in order to re-derive black hole masses. We calculate of the objects in the samples by (2006) and (2009b), for which the line width of MgII or H is measured. The corresponding line width of nine objects is not listed; consequently, these are excluded from our analysis. In Figure 8, we plot not for each source but for the average, since we focus only on statistical properties. Our values and those listed in (2006) and (2009b) are not notably different by averaging. (2010) investigated the evolution of the - relation. 111 Similar samples were previously given by (2007), but most of these were covered by the sample of (2010). As discussed previously, is derived from spectral data using the mass estimator by (2008). The spheroid mass is derived from and the mass-to-light ratio by a certain stellar population model((2003)). Thus, converted data are also plotted in Figure 8. We group data into two ranges, and , and respectively average and , since the sample number is small. Although detailed comparison is difficult due to the small sample and the ambiguity in the conversion relation, the results are consistent with mass-dependent evolution. The samples are deawn from the high mass end of the spheroid mass function (), where we expect little or no evolution in the - relation since . Comparing our evolutionary model with observations in each redshift bin we find consistency with observations, although we cannot exclude a mass-independent scenario because of the lack of observational data in the low spheroid mass range.
We next consider additional observation data, although the comparison becomes indirect. (2007) investigated the evolution of the - relation. An evolutionary model of is necessary, but here we assume that the conversion relation from to is the same as that of . In other words, the relation between and at is derived by eliminating in eq. (13) and the - relation at by (2002), and the relation is assumed to hold for all . Averaged data points from (2007) are also plotted in Figure 8. These data correspond to small masses of and show relatively strong evolution, supporting the hypothesis of a mass-dependent evolution scenario.
5 SUMMARY AND CONCLUSIONS
We have modeled the mass-dependent evolution of black holes and spheroids since . The black hole mass evolution was investigated by using a continuity equation and the observed AGN luminosity function. The spheroid mass evolution was also derived from a continuity equation and the observed SSFR. Both evolutions, which were consistent with ”downsizing”, significantly depend on the masses of the SMBHs and spheroids, and the - relation is mass-dependent. We assumed that all galaxies at satisfy the linear relation of the - diagram with some uncertainty, and examined the history to . It was found that the relation is unchanged for in the range of and . In the low-mass regime, however, there is clear deviation from the linear relation. The mass increase of the spheroids is likely larger than that of black holes, although there is uncertainty in the model parameters. Our model suggests that SMBHs were already located in spheroids with relatively small mass, compared with the local relation.
We also compared our results with currently available observations concerning the relations between and host spheroid parameters at certain cosmic ages. Our mass-dependent evolutionary model is consistent with these observations, although the observational sample is not sufficiently complete to make a statistically significant comparison. Larger observational samples are needed to study the history of SMBHs and their hosts statistically, expecially in the low-mass regime where the differences between the mass-dependent and the mass-independent evolution models are higher. If a break from the linear - is found, our mass-dependent scenario would be supported and it would be possible to put stronger constraints on model parameters. It would also be of great interest to extend the present results to higher redshift, where the model uncertainties are considerably smaller. This would enable us to reveal possible inconsistencies between model and observations. However, the extension of the present study to higher redshift is not straightforward, as the adopted stellar mass function for early-type galaxies is only significant at (, 2010).
References
- (1) Aller, M. C., & Richstone, D. O. 2007, ApJ, 665, 120
- (2) Bell, E. F., Zheng, X. Z., Papovich, C., Borch, A., Wolf, C., & Meisenheimer, K. 2007, ApJ, 663, 834
- (3) Bell, E. F., et al. 2004, ApJ, 608, 752
- (4) Bennert, V. N., et al. 2010, ApJ, 708, 1507
- (5) Borch, A., Meisenheimer, K., Bell, E. F., Rix, H.-W., Wolf, C., Dye, S., Kleinheinrich, M., & Kovacs, Z. 2006, A&A, 453, 869
- (6) Bruzual, G., & Charlot, S. 2003, MNRAS, 344, 1000
- (7) Buat, V., et al. 2008, A&A, 483, 107
- (8) Cattaneo, A., et al. 2009, Nature, 460, 213
- (9) Cavaliere A., Morrison, P., & Wood, K. 1971, ApJ, 170, 223
- (10) Chen, Y.-M., Wild, V., Kauffmann, G., Blaizot, J., Davis, M., Noeske, K., Wang, J.-M., & Willmer, C. 2009, MNRAS, 393, 406
- (11) Cowie, L. L., Songaila, A., Hu, E. M., & Cohen, J. G. 1996, AJ, 112, 839
- (12) Croton, D. J. 2006, MNRAS, 369, 1808
- (13) Damen, M., Labbé, I., Franx, M., van Dokkun, P. G., Taylor, E. N., & Gawiser, E. J. 2009, ApJ, 690, 937
- (14) Decarli, R., Falomo, R., Treves, A., Labita, M., Kotilainen, J.K., & Scarpa, R. 2009, MNRAS, accepted (arXiv:0911.2988)
- (15) Ferrarese, L., & Merritt, D. 2000, ApJ, 539, L9
- (16) Gebhardt, K., et al. 2000, ApJ, 539, L13
- (17) Graham, A. W. 2007, MNRAS, 379, 711
- (18) Graham, A. W., Driver, S. P., Allen, P. D., & Liske, J. 2007, MNRAS, 378, 198
- (19) Häring , N., & Rix, H.-W. 2004, ApJ, 604, L89
- (20) Hopkins, P. F., Hernquist, L., Cox, T. J., Keres, D. & Wuyts, S. 2009, ApJ, 691, 1424
- (21) Iglesias-Páramo, J., et al. 2007, ApJ, 670, 279
- (22) Ilbert, O., et al. 2010, ApJ, 709, 644
- (23) Im, M., et al. 2002, ApJ, 571, 136
- (24) Kisaka, S., Kojima, Y., & Otani, Y. 2008, MNRAS, 390, 814
- (25) Kollmeier, J. A., et al. 2006, ApJ, 648, 128
- (26) Kormendy, J., & Richstone, D. 1995, ARA&A, 33, 581
- (27) Labita, M., Decarli, R., Treves, A., & Falomo, R. 2009, MNRAS, 396, 1537
- (28) Lauer, T. R., Tremaine, S., Richstone, D., & Faber, S. M. 2007, 670, 249
- (29) Magorrian, J., et al. 1998, AJ, 115, 2285
- (30) Marconi, A., & Hunt, L. K. 2003, ApJ, 589, L21
- (31) Marconi, A., Risaliti, G., Gilli, R., Hunt, L. K., Maiolino, R., & Salvati, M. 2004, MNRAS, 351, 169
- (32) Martin, D. C., et al. 2007, ApJS, 173, 415
- (33) McGill, K. L., Woo, J.-H., Treu, T., & Malkan, M. A. 2008, ApJ, 673, 703
- (34) McLure, R. J., & Jarvis, M. J. 2002, MNRAS, 337, 109
- (35) McLure, R. J., Jarvis, M. J., Targett, T. A., Dunlop, J. S., & Best, P. N., 2006, MNRAS, 368, 1395
- (36) Merloni, A., Rudnick, G., & Di Matteo, T. 2004, MNRAS, 354, L37
- (37) Noeske, K. G., et al. 2007, ApJ, 660, L47
- (38) Pannella, M., Hopp, U., Saglia, R.P., Bender, R., Drory, N., Salvato, M., Gabasch, A., & Feulner, G. 2006, ApJ, 639, L1
- (39) Pérez-González, P. G., et al. 2008, ApJ, 675, 234
- (40) Raimundo, S. I., & Fabian, A. C. 2009, MNRAS, 396, 1217
- (41) Salviander, S., Shields, G. A., Gebhardt, K., & Bonning, E. W. 2007, ApJ, 662, 131
- (42) Shankar, F., Weinberg, D. H., & Miralda-Escudé, J. 2009, ApJ, 690, 20
- (43) Silk, J., & Rees, M., J. 1998, A&A, 331, L1
- (44) Small, T. A., & Blandford, R. D. 1992, MNRAS, 259, 725
- (45) Soltan, A. 1982, MNRAS, 200, 115
- (46) Tamura, N., Ohta, K., & Ueda, Y. 2006, MNRAS, 365, 134
- (47) Tremaine, S., et al. 2002, ApJ, 574, 740
- (48) Treu, T., Woo, J.-H., Malkan, M. A., & Blandford, R. D. 2007, ApJ, 667, 117
- (49) Ueda, Y., Akiyama, M, Ohta, K., & Miyaji, T. 2003, ApJ, 598, 886
- (50) Yencho, B., Barger, A. J., Trouille, L. & Winter, L. M. 2009, ApJ, 698, 380
- (51) Zheng, X. Z., Bell, E. F., Papovich, C., Wolf, C., Meisenheimer, K., Rix, H.-W., Rieke, G. H., & Somerville, R. 2007, ApJ, 661, L41

![[Uncaptioned image]](/html/1002.3231/assets/x2.png)
![[Uncaptioned image]](/html/1002.3231/assets/x3.png)