Searching for Far-Ultraviolet Auroral/Dayglow Emission from HD209458b.**affiliation: Based on observations made with the NASA/ESA S , obtained from the data archive at the Space Telescope Science Institute. STScI is operated by the Association of Universities for Research in Astronomy, Inc. under NASA contract NAS 5-26555.
Abstract
We present recent observations from the -Cosmic Origins Spectrograph aimed at characterizing the auroral emission from the extrasolar planet HD209458b. We obtained medium-resolution ( 20,000) far-ultraviolet (1150 – 1700 Å) spectra at both the Phase 0.25 and Phase 0.75 quadrature positions as well as a stellar baseline measurement at secondary eclipse. This analysis includes a catalog of stellar emission lines and a star-subtracted spectrum of the planet. We present an emission model for planetary H2 emission, and compare this model to the planetary spectrum. No unambiguously identifiable atomic or molecular features are detected, and upper limits are presented for auroral/dayglow line strengths. An orbital velocity cross-correlation analysis finds a statistically significant (3.8 ) feature at +15 ( 20) km s-1 in the rest frame of the planet, at 1582 Å. This feature is consistent with emission from H2 – (2 – 9) P(4) ( = 1581.11 Å), however the physical mechanism required to excite this transition is unclear. We compare limits on relative line strengths seen in the exoplanet spectrum with models of ultraviolet fluorescence to constrain the atmospheric column density of neutral hydrogen between the star and the planetary surface. These results support models of short period extrasolar giant planets with weak magnetic fields and extended atomic atmospheres.
Subject headings:
stars: planetary systems — stars: individual (HD209458) — stars: atmospheres — ultraviolet: stars1. Introduction
The preceding two decades have witnessed an explosion in both the number of known extrasolar planets and the number of astronomers studying them. There has been over an order of magnitude increase in the number of detected exoplanets in the last ten years alone, now totaling over 400. Among these, transiting planets have proven to be the most useful for constraining the physical and chemical conditions of the planets and their atmospheres. HD209458b is a short-period ( = 0.046 AU; Henry et al. 2000) transiting gas giant, with a mass of 0.7 (Laughlin et al., 2005) and a density 25% that of Jupiter. HD209458b orbits a solar-type (G0V) star, which is located at a distance of 47 pc. It was the first extrasolar planet observed in transit (Henry et al., 2000; Charbonneau et al., 2000), has a well determined orbit from radial velocity studies (Mazeh et al., 2000), and was the first object whose atmosphere was probed by absorption line spectroscopy (Charbonneau et al. 2002; and see Sing et al. 2008a,b for additional analysis).
HD209458b was also the first exoplanet whose atmosphere was investigated using far-ultraviolet (far-UV) absorption line spectroscopy (Vidal-Madjar et al., 2003, 2004). The far-UV bandpass is unique in that it offers direct access to the strongest transitions of the atoms and molecules that constitute the majority of the mass in exoplanets (e.g. H, O, C, H2, CO, etc.), and that are involved in the chemical reactions that produce more complex molecules observed in gas giants (H2O, CH4, CO2, TiO, and VO; Swain et al. 2009; Sing et al. 2009; Désert et al. 2008). Using the far-UV capabilities of /STIS, Vidal-Madjar et al. (2004) detected absorption from H I Ly, O I 1304 Å, and C II 1335 Å. These results suggested that HD209458b has an extended atmosphere overfilling the Roche lobe and evaporating via a hydrodynamic escape mechanism. We note however that data analysis techniques and corresponding interpretations can strongly influence conclusions drawn from these UV data (Ben-Jaffel, 2007; Vidal-Madjar et al., 2008). This situation is complicated for O I and C II by the low-resolution of the STIS data, and additional observations would be beneficial (Linsky et al., 2010).
The majority of studies investigating the atmospheric conditions of transiting exoplanets have employed absorption techniques. In addition to the UV studies cited above, infrared (IR) observers have used both spectroscopic (Swain et al., 2009) and photometric (Désert et al., 2009) methods to constrain the content of complex molecules in exoplanet atmospheres. Studies of exoplanetary thermal emission in the mid-IR have shown that these objects can be observed directly at wavelengths where the relative planet/star contrast is favorable (Knutson et al., 2008, 2009). Analogously, both Jupiter and Saturn are strong far-UV emitters, well above any contribution from scattered sunlight at 1700 Å (Feldman et al., 1993; Gustin et al., 2002, 2009).
| Dataset | COS Mode | Orbital Phase | Texp (s) |
|---|---|---|---|
| lb4m01 | G160M | 0.00 | 4900 |
| lb4m02 | G160M | 0.25 | 7891 |
| lb4m03 | G160M | 0.50 | 4912 |
| lb4m04 | G160M | 0.75 | 7751 |
| lb4m05 | G130M | 0.00 | 4947 |
| lb4m06 | G130M | 0.25 | 7942 |
| lb4m07 | G130M | 0.50 | 4957 |
| lb4m08 | G130M | 0.75 | 7796 |
Far-UV emission from Jupiter and Saturn is dominated by atomic (Lyman series) and molecular hydrogen (H2) lines, the primary constituents of gas giant planets (Sudarsky et al., 2003). H2 may be responsible for the Rayleigh scattering observed in optical spectra of the HD209458b atmosphere (Lecavelier Des Etangs et al., 2008). H2 in the atmosphere of giant planets is excited by two primary mechanisms: electron bombardment and fluorescence pumped by stellar emission lines. Both processes excite the ambient molecules to higher-lying electronic states whose decay produces a highly structured spectrum in the 700 – 1650 Å bandpass. The majority of these lines can be attributed to fluorescence from the Lyman and Werner bands of H2 ( and to , however higher electronic states contribute to the observed electron impact spectrum). Gas giant aurorae produce the highest surface brightnesses (Clarke et al., 1998) as the electron impact spectrum is most intense where the magnetic field lines connect with the atmosphere. Dayglow (non-auroral illuminated disk) emission from the giant planets also shows strong features of H2, with differing levels of molecular excitation and contribution from solar fluorescence (Feldman et al., 1993; Wolven & Feldman, 1998). It follows that the far-UV could be an ideal wavelength regime in which to probe the atmospheres of hot Jupiters through their direct emission (Yelle, 2004). Most transiting extrasolar giant planets are at relatively small separations from their parent star ( 0.1 AU), where the line flux from the host star should be more intense than at Jupiter by a large factor ( 103) and bombardment from a stellar wind may be enhanced relative to the Jovian environment. Additionally, by virtue of their tight orbits, these planets have large orbital velocities ( 100 km s-1). Hence, by observing the system near both quadrature positions (Phase 0.25 and Phase 0.75), even with modest spectral resolution, the observed velocity shift between the two epochs can provide confirmation that the signal is planetary in origin. With a velocity resolution of 15 km s-1 and an order of magnitude increase in sensitivity over previous far-UV instruments, the Cosmic Origins Spectrograph (COS) enables new opportunities for studies of exoplanetary atmospheres.
In this paper, we present far-UV observations designed to search for direct emission from an extrasolar planet. We use early observations from COS, recently installed on , to constrain the emission properties of bulk atmospheric constituents such as H2, as well as several atomic species. We describe the COS observations and data reduction in Section 2. In Section 3, we describe the details of an exoplanet auroral emission model based on observations of Jupiter, and present a quantitative analysis of the far-UV spectrum of HD209458(b) obtained with COS. In Section 4, we compare the data to synthetic spectra, and place limits on the H2 emission in the HD209458b atmosphere. We conclude with a brief summary in Section 5.
2. -COS Observations and Data Reduction
The Cosmic Origins Spectrograph is a fourth-generation instrument installed on in 2009 May as part of Servicing Mission 4, STS-125. The spectrograph is optimized for observations of point sources in the far-UV bandpass (1150 1750 Å) and achieves high sensitivity in the far-UV by using a single optical element for dispersion, focus, and correction of the spherical aberration of the primary mirror. COS covers the 1150 – 1750 Å band at moderate resolving power (G130M and G160M; 20,000; 15 km s-1 for point source observations), with additional modes that offer low resolution spectroscopy to wavelengths as short as the Lyman Limit (G140L; 2000; 900 2100 Å; McCandliss et al. 2009) as well as low and medium-resolution spectroscopy in the near-UV (G185M, G225M, G285M, and G230L; 1700 3200 Å). First COS science results can be found in France et al. (2009) and Danforth et al. (2009), and a full instrument description and on-orbit performance characteristics are in preparation (J. C. Green et al. 2010, in preparation; S. Osterman et al. 2010, in preparation).
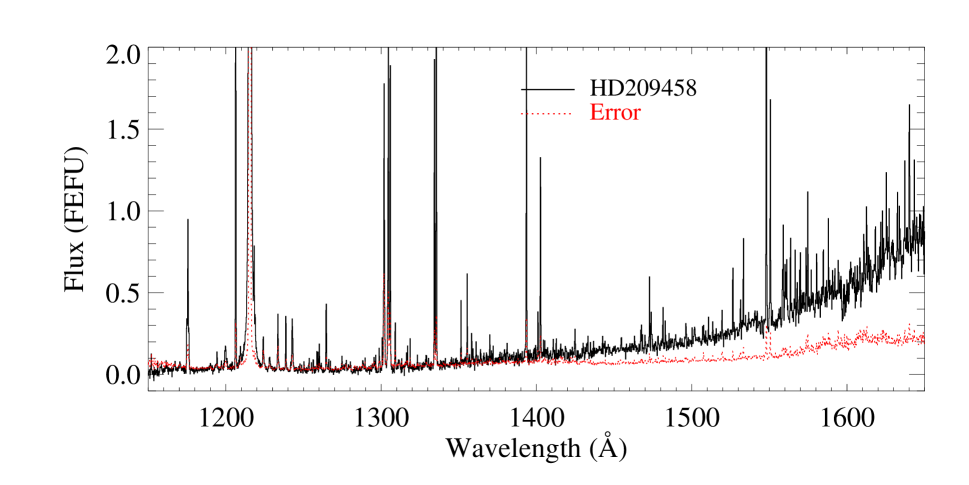
HD209458 was the first science target to be observed with COS after nominal science operations began in 2009 September (program 11534, dataset lb4m). The observing program was divided into eight visits, four phases of the exoplanet orbit in G130M and G160M. The relevant observational parameters are given in Table 1, and we used the orbital period and zero phase data from Knutson et al. (2007), = 3.52474859 days, = 2,452,826.628521, to determine the orbital phase during the observations. The transit duration for HD209458b is 3.2 hrs, thus a single transit spans approximately two orbits. The transit data will be presented in Linsky et al. (2010), and we refer the reader to this work for a discussion of atomic absorption from the extended atmosphere of HD209458b. In the present work, we will focus on the observations made at the Phase 0.25 and Phase 0.75 quadrature positions, using the Phase 0.5 secondary eclipse of the planet by the star (hereafter “occultation”) observations as a baseline reference for any emission signal attributable to the planet. We present the 1150 – 1650 Å spectrum in Figure 1.
HD209458 was observed by -COS in the interval from 15 September 2009 to 18 October 2009, for a total of 20 orbits. All observations were centered on the host star (R.A. = 22h 03m 10.82s, Dec. = +18°53′03.8″; J2000) and COS performed target acquisition using near-UV imaging through the Bright Object Aperture (BOA). In order to achieve continuous spectral coverage and minimize fixed pattern noise, observations in each grating were made at four central wavelength settings (1291, 1300, 1309, and 1318 in G130M and 1589, 1600, 1611, and 1623 in G160M). The data were processed with the COS calibration pipeline, CALCOS111We refer the reader to the cycle 18 COS Instrument Handbook for more details: http://www.stsci.edu/hst/cos/ documents/handbooks/current/cos_cover.html, v2.11. During the analysis, we observed anomalous behavior in several stellar emission lines that was traced back to a change in flux calibration reference files over the course of the observing period. The entire data set was reprocessed following completion of the program using the most recent222as of 2009 November 1 COS sensitivity files.
3. HD209458b Auroral Model and Spectral Analysis
3.1. Atmospheric H2 Emission Model
In this section, we present an H2 model for the atmospheres of giant planets. We describe the model in general terms as a tool for future far-UV analyses of exoplanetary dayglow/aurorae, and use this model to compare with the COS observations in Section 4. Synthetic spectra of fluorescent emission from H2 can be made by computing the collisional and radiative excitation rates into the upper electronic states. This model assumes a ground electronic state population, then uses excitation cross sections and an incident radiation field to calculate the population distribution in the rovibrational levels of the upper electronic state (predominantly and ). The molecules will then return to the ground electronic state following the appropriate branching ratios, producing far-UV emission lines (700 1650 Å) and leaving the molecules in excited rovibrational levels. We have adopted a modified version of the synthetic molecular hydrogen emission code presented by Wolven et al. (1997) to model fluorescence induced by electron impact and solar Ly at the Shoemaker-Levy 9 impact site on Jupiter (see also models of the far-UV Jovian dayglow presented by Liu & Dalgarno 1996).
We begin by creating an electronic ground state population for the molecules. This is done following the formalism of Herzberg to create a matrix of possible energy levels, characterized by their rotational and vibrational quantum numbers, and , respectively (Herzberg, 1950). An occupation probability of a given rovibrational state, , is found multiplying the Boltzmann factor by the degeneracy of a given state.
The photon-induced fluorescence starts from the ground state population, the molecules are then “illuminated” by the EUV97 model solar radiation field ( from 1 – 2000 Å; Tobiska & Eparvier 1998). Excitation into the upper states is determined by theoretical rates at the Born limit, using the transition probabilities of Abgrall et al. (1993a,b). The excitation rate is given by
| (1) |
where and are the vibrational and rotational quantum numbers of the ground electronic state and and are the vibrational and rotational quantum numbers of the electronic level . The units of and are photons cm-2 s-1 Å-1. is the total optical depth at a given wavelength, and is the optical depth for the transition connecting and . The intensity of radiation being absorbed at a given wavelength, , is
| (2) |
where is the model solar spectrum, with a scaling proportional to the HD209458 – HD209458b distance.
Following the absorption, the molecules emit obeying branching ratios. The emission rate from a particular level of to a level of the ground electronic state is given by
| (3) |
where is the excitation rate of the excited electronic level (Equation 1), is the efficiency for predissociation in the excited electronic state, and the ratio of transition probabilities (; Abgrall et al. 1993a,b) is the branching ratio (Liu & Dalgarno, 1996).
These models include absorption out of upper vibrational states ( 0), and a first-order correction for self-absorption by H2 at wavelengths shorter than 1120 Å. These models also take into account electronic transitions to the , , , and states, although their relative contribution to the resultant spectrum is small. Finally, transitions to predissociating states and vibrational states that result in dissociation ( 14, the vibrational continuum) are included.
In addition to the incident radiation field, the model inputs are the ground state thermal temperature (), the column density (), the electron energy distribution (), the Doppler -value (in km s-1, contributing to the line shape), and a correction for attenuation by atomic hydrogen on the incident stellar spectrum. There is evidence that the H2 temperature in the atmosphere of HD209458b is as high as 2350 K (Lecavelier Des Etangs et al., 2008), however, the column density of the H2 in the atmosphere of HD209458b is unknown, thus we use the Jovian system as a starting point for the creation of a synthetic auroral/dayglow spectrum. We created a grid of models for several values of , , and . For the purposes of line identification and H2 detection, we employed a model with = 1000 K (as there may be multiple interpretations for the data described in Lecavelier et al. 2008, we choose a in the range of the assumed effective temperature for a model exoplanet H2 layer, 1000 – 1500 K; Yelle 2004; Murray-Clay et al. 2009), = 1 1020 cm2 (Wolven et al., 1997; Wolven & Feldman, 1998), and = 100 eV (Liu & Dalgarno, 1996). The -value is simply (2, approximately 3 km s-1 for the model spectrum described here, however the output spectrum is largely insensitive to the actual choice of -value for values of a few km s-1. In the general case presented here, we neglect absorption by atmospheric neutral hydrogen, however this is most likely not proper for the HD209458b atmosphere, and we will return to this point in §4.2.1.
We note that while these values most likely do not represent the exact conditions in the HD209458b atmosphere, the qualitative features of the output emission spectrum are relatively insensitive to the specifics for 1021 cm2 and 300 K. Very large column densities produce enhanced emission at long wavelengths ( 1350 Å) as the 912 – 1110 Å flux gets self-absorbed and redistributed. H2 at high temperatures ( 2500 K) is characterized by strong band emission in the 1200 – 1280 Å range because the broadly distributed ground state population allows enhanced absorption into the Werner bands which dominate the emission spectrum following the fluorescent cascade.
| Species | Line Flux | FWHM | ||
|---|---|---|---|---|
| (Å) | (Å) | (10-16 ergs cm-2 s-1) | (km s-1) | |
| C IIIbbBlending of the C III multiplet led to three distinct fit components. | 1176 | 1174.94 | 2.19 0.31 | 144.5 |
| C III | 1176 | 1175.56 | 4.10 0.67 | 106.7 |
| C III | 1176 | 1176.20 | 0.77 0.44 | 48.6 |
| N I | 1199.97 | 1199.84 | 1.00 0.30 | 136.3 |
| Si III | 1206.50 | 1206.34 | 12.89 0.35 | 73.0 |
| H Icc Lines labeled are contaminated by geocoronal emission. | 1215.67 | 1215.49 | 383 16.71 | 209.3 |
| O V | 1218.34 | 1218.21 | 3.97 0.15 | 115.3 |
| N V | 1238.82 | 1238.62 | 1.08 0.58 | 74.9 |
| N VddIncomplete detector pulse-height screening by the CALCOS pipeline leads to a spurious feature coincident with the N V 1242 Å line. | 1242.80 | 1242.50 | 0.26 0.04 | 19.2 |
| N VddIncomplete detector pulse-height screening by the CALCOS pipeline leads to a spurious feature coincident with the N V 1242 Å line. | 1242.80 | 1242.94 | 1.30 1.07 | 134.8 |
| S II | 1259.52 | 1259.08 | 1.68 0.54 | 170.5 |
| Si II | 1264.74 | 1264.71 | 2.11 0.11 | 117.4 |
| C I | 1274.98 | 1274.80 | 0.16 0.049 | 28.1 |
| Si III | 1298.95 | 1298.85 | 0.63 0.09 | 127.8 |
| O I | 1302.17 | 1301.89 | 7.38 0.62 | 70.4 |
| O I | 1304.86 | 1304.63 | 11.79 0.17 | 133.0 |
| O I | 1306.03 | 1305.80 | 7.42 0.49 | 66.8 |
| Si II | 1309.28 | 1309.12 | 3.15 0.48 | 209.6 |
| N I | 1319.00 | 1318.71 | 0.28 0.06 | 21.5 |
| C II | 1334.53 | 1334.32 | 8.04 0.25 | 72.4 |
| C II | 1335.71 | 1335.50 | 16.06 0.14 | 70.2 |
| Cl I | 1351.66 | 1351.45 | 1.20 0.30 | 70.6 |
| O I | 1355.60 | 1355.39 | 1.38 0.09 | 48.7 |
| Si IV | 1393.76 | 1393.58 | 9.47 0.40 | 70.1 |
| Si IV | 1402.77 | 1402.61 | 5.11 0.49 | 70.8 |
| Fe II | 1418.53 | 1418.65 | 0.42 0.05 | 41.7 |
| S I | 1425.03 | 1424.89 | 0.63 0.05 | 29.4 |
| S I | 1433.28 | 1433.13 | 0.41 0.08 | 37.4 |
| C I | 1470.09 | 1469.97 | 0.36 0.08 | 36.0 |
| S I | 1472.97 | 1472.82 | 1.56 0.33 | 42.1 |
| S I | 1474.00 | 1473.89 | 1.33 0.33 | 34.6 |
| S I | 1481.70 | 1481.54 | 0.74 0.22 | 38.1 |
| S I | 1483.23 | 1483.00 | 0.31 0.04 | 35.8 |
| S IIeeTentative identification, previously undetected. | 1519.91 | 1519.78 | 1.58 0.87 | 121.4 |
| Si II | 1526.71 | 1526.48 | 1.19 0.072 | 23.1 |
| C IIIeeTentative identification, previously undetected. | 1531.84 | 1531.43 | 0.75 0.13 | 39.1 |
| Si II | 1533.43 | 1533.27 | 2.31 0.14 | 63.7 |
| C IV | 1548.19 | 1548.05 | 10.54 0.38 | 72.1 |
| C IV | 1550.77 | 1550.58 | 7.07 0.96 | 108.5 |
| Fe II | 1559.08 | 1558.93 | 1.98 0.29 | 61.1 |
| Fe II | 1563.79 | 1563.61 | 1.38 0.74 | 26.8 |
| Fe II | 1566.82 | 1566.63 | 0.73 0.67 | 16.0 |
| Fe II | 1570.24 | 1570.06 | 0.64 0.40 | 26.6 |
| Si I+Fe II | 1573.87 | 1573.71 | 1.59 0.10 | 59.6 |
| Si I+Fe II | 1574.82 | 1574.77 | 1.67 0.10 | 41.8 |
| Fe II | 1580.63 | 1580.38 | 1.22 0.21 | 42.4 |
| Fe II | 1584.95 | 1584.59 | 1.06 0.13 | 43.2 |
| Fe II | 1588.29 | 1588.09 | 1.23 0.13 | 33.9 |
| Fe II | 1612.80 | 1612.58 | 1.61 0.38 | 44.9 |
| Fe II | 1618.47 | 1618.29 | 0.74 0.10 | 58.6 |
| Fe II | 1621.68 | 1621.63 | 0.62 0.16 | 38.2 |
| Fe II | 1623.09 | 1622.88 | 0.65 0.06 | 22.9 |
| Fe II | 1625.52 | 1625.35 | 1.47 0.23 | 35.8 |
| Fe II | 1632.67 | 1632.51 | 1.66 0.55 | 68.2 |
| Fe I | 1637.40 | 1637.26 | 2.03 0.17 | 39.9 |
| He II | 1640.40 | 1640.15 | 2.51 0.38 | 63.2 |
| Fe II | 1643.58 | 1643.38 | 3.19 0.26 | 91.8 |
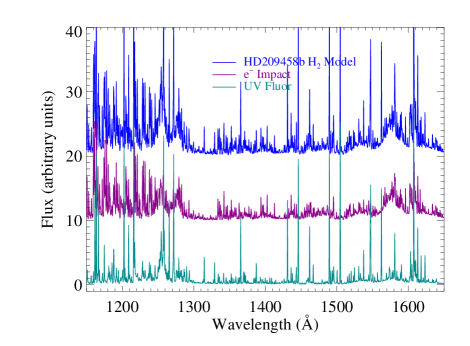
Synthetic spectra are presented in Figure 2, where we show a decomposition of the predicted H2 spectrum into electron impact and ultraviolet line fluorescence components. There are several notable features of this spectrum in the COS (G130M + G160M) bandpass shown here:
-
•
Two prominent Lyman band systems roughly centered on 1164 and 1173 Å
-
•
Strong Werner band emission from 1200 – 1280 Å
-
•
The “fluorescent H2 desert” from 1300 – 1350 Å
-
•
Several strong photon-excited emission lines in the 1350 – 1550 region (mainly excited by stellar Ly and Ly photons)
-
•
Dissociation continuum emission observed between 1350 – 1630 Å resulting from transitions to the unbound vibrational continuum ( 14) of the ground electronic state (Stecher & Williams 1967; Abgrall et al. 1997; see also France et al. (2005) for additional discussion of this feature in the context of photo-excited gas)
-
•
The strongest individual feature in this H2 spectrum is the – (6 – 13) P(1) emission at 1607.50 Å which is excited by coincidence of the ground state transition – (6 – 0) P(1), 1025.93 Å, with stellar Ly
3.2. Stellar Line Inventory
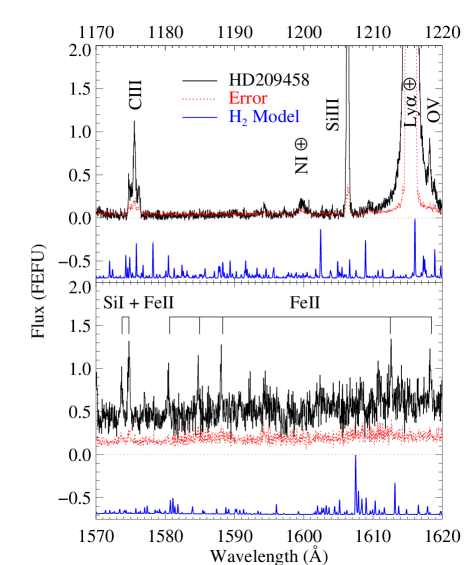
The planetary emission signal from the HD209458 system is expected to be weak compared to the stronger stellar features present in the COS far-UV bandpass. As the far-UV spectrum of H2 can have hundreds of relatively strong emission lines that depend upon the specifics of the molecular excitation, it is critical to have a thorough catalog of the stellar emission features in the 1150 – 1650 Å H2 range covered by COS. In addition, while high-lying ions originating in the chromosphere or transition region of HD209458 (such as Si IV and C IV) will most likely not be found in an exoplanetary environment, it is possible that intermediate ionization species (C II, O I, S I, Si II; Vidal-Madjar et al. 2004) could exist in the hot thermosphere of a short-period exoplanet (Yelle, 2004; García Muñoz, 2007). Therefore, we compared detailed studies of the far-UV spectra of Cen and Arcturus with our COS observations of HD209458 to catalog the stellar features (Pagano et al., 2004; Hinkle et al., 2005). Figure 3 displays representative spectral windows from the G130M and G160M observations, with the H2 emission model shown offset in blue. In Table 2, we list the observed emission lines, including their observed wavelength, integrated brightness, and line width. We note that stellar variability calls into question the validity of line fluxes measured from data acquired over the course of 1 month. While we did find relatively good agreement between the peak line strengths at the quadrature and occultation pointings ( 20%), nothing in the following analysis depends on the absolute calibration of the stellar emission line fluxes. The line fluxes quoted in Table 2 would best be thought of in a relative sense.
3.3. Quadrature Observation Cross-Correlation
Even in the far-UV bandpass, where continuum emission from solar type stars is weak (and consistent with the background at 1400 Å), stellar contamination must be addressed. Steps must be taken in data analysis to maximize the potential emission from the planet while minimizing the contribution from stellar line and continuum emission. We take advantage of the orbital velocity of HD209458b, = 144 km s-1 assuming a circular orbit, and coadd the quadrature observations as a function of velocity. Additionally, we subtract the stellar emission observed at the occultation (Phase 0.5) position in order to remove additional confusion from weak stellar lines. Stellar variability is accounted for with a scaling based on the flux in high-ionization chromospheric/transition region lines (e.g. Si IV 1400 and C IV 1550 Å) not expected to be present in the planetary atmosphere. We found that HD209458 was relatively stable across all of the observations used here (Section 3.1), with peak variability of C IV 5 10-16 ergs cm-2 s-1 Å-1, which is 19% of the stellar flux at this wavelength.
This process not only increases the signal from the planet, but serves as a cross-correlation function that allows one to assess the validity of an emission signal. We would expect any signal that originates on HD209458b to be at roughly the orbital velocity of the planet. Mathematically, we define a star-subtracted quadrature spectrum (,) which is a function of both wavelength and the orbital velocity of the planet, as
| (4) |
with
| (5) |
and = 1400 Å, where , , and are the fluxed spectra (in units of ergs cm-2 s-1 Å-1) observed at the first quadrature (Phase 0.25), second quadrature (Phase 0.75), and occultation (Phase 0.5), respectively. We create this planetary spectrum as a function of orbital velocity for the range 50 250 km s-1, in 1 km s-1 bins. In order to suppress noise spikes introduced during the subtraction, we rebin , to 0.1 Å pixel-1 ( 20 km s-1), though numerous binnings were tested in order to rule out spurious features introduced by a particular choice of pixel scale. The correlation signal in this treatment is the peak flux of , in a given velocity bin and spectral range,
| (6) |
where is the wavelength interval around the emission line of interest, typically 10 Å.
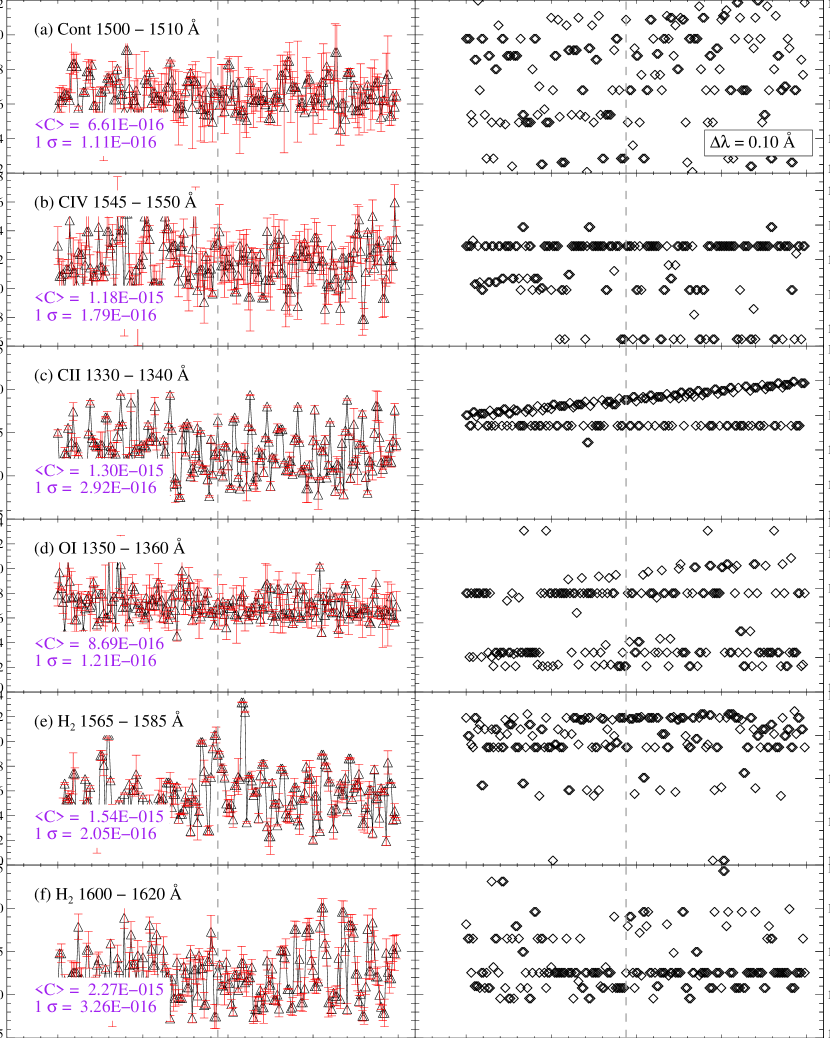
Several spectral regions were identified to isolate specific emission lines of interest that fell into one of the following categories: 1) emission line-free, a region containing stellar continuum or detector background, 2) emission line regions containing only stellar features, 3) emission from low-ionization ions and neutrals which could have components from both the star and the planet, and 4) regions that should contain a wealth of planetary H2 features. A full list of the spectral windows investigated is provided in Table 3. We then look for peaks in the correlation signal, , as a function of orbital velocity. Figure 4 displays the results for six of these regions. We also measure the wavelength of peak emission in order to verify that the signal is associated with a specific line and not a chance noise peak. As an illustrative comparison, we describe plots (a) and (b) in Figure 4. These are regions dominated by stellar continuum (1500 – 1510 Å) and stellar emission lines (C IV doublet, 1545 – 1555 Å) respectively. The left panels show the correlation peaks (, in units of 10-15 ergs cm-2 s-1 Å-1) as a function of orbital velocity. Mean fluxes and standard deviations are computed from an average of two velocity regions distinct from the circular velocity (60 100 and 200 240 km s-1) and displayed in Figure 4. While the plots show a mostly random distribution, the right panels show that while the peak wavelength of the continuum region is approximately randomly distributed (a), residuals in the fluxes in the C IV 1550.77 Å are responsible for most of the peaks in the 1545 – 1555 Å region (b).
Figure 2 (c – f) shows four additional spectral regions that highlight possible emissions from the HD209458b system. Vidal-Madjar et al. (2004) observe possible absorption in the C II 1335 Å multiplet, arising in the extended envelope of the planet, therefore this could be a viable emitting species in a hot thermosphere (García Muñoz, 2007; Linsky et al., 2010). O I 1356 Å is considerably less contaminated by geocoronal emission than the O I 1304 Å multiplet, and could be present in the exoplanet. In fact, the O I 1356 Å emission is observed to be brighter than O I 1304 Å in the Jovian system, where O I 1356 Å is produced through the dissociation of O2 and H2O by electron impact (Hall et al., 1998; Noren et al., 2001). In panels (c) and (d), the peak wavelength, , displays a linear increase with orbital velocity, that we attribute to a broad geocoronal component that is being shifted to longer wavelengths in this treatment. In the bottom panels (e and f), we display the correlation peaks for two regions with an abundance of strong H2 features, centered around 1575 and 1608 Å (Gustin et al., 2009). Nothing is seen in the 1608 Å band, but there are several correlation peaks present in the 1575 Å region within 20 km s-1 of the planet’s nominal circular velocity. The strongest two include a broad feature, approximately centered on the circular velocity of the planet, and the second is located at 158 – 160 km s-1 ( +15 km s-1 in the rest frame of the planet). We note that HD209458b is nearly circularized ( = 0.014 0.009, consistent with a circular orbit; Laughlin et al. 2005), and the amplitude of variation in the orbital velocity is of order a few km s-1. The significance of these results and the possibility of an H2 detection are discussed in §4.
4. Results and Discussion
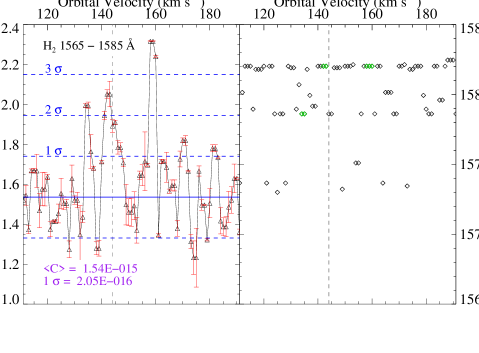
4.1. Emission Feature at 1582 Å
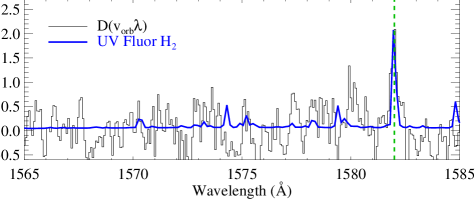
An analysis of for each of the spectral subregions identified in Table 3 indicates two statistically significant features that are consistent with emission from HD209458b. There is a strong peak in the cross-correlation spectrum at = 158 – 160 km s-1 in the 1575 Å H2 band. This 1582 Å feature is detected at the 3.8 level ( 99.9% confidence) at 1581.95 0.10 Å (Figure 5). The bottom panel of Figure 5 shows the quadrature summed, stellar subtracted spectrum (,; Equation 4) for = 159 km s-1. This feature is not obviously detected in either quadrature spectrum individually, and does not correspond to a known stellar feature. In Figure 3, we showed that there are several Fe II lines in this region. The -STIS spectrum of Cen (Hinkle et al., 2005) contains weak emission from Fe II 1581.27 Å. While we cannot explicitly rule out this line as the explanation for the 1582 Å feature seen in HD209458b, we consider it unlikely that only this Fe II line is present when dozens of stronger Fe II lines are not observed.
We calculated the probability of randomly finding a 3.8 event in the 166 Å sampled in the 14 intervals (1660 total samples at 0.1 Å binning) listed in Table 3. Assuming Gaussian statistics, we find that one should expect 0.4 such events in the entire range, for each velocity interval. This analysis indicates two (at = 158 and 159 km s-1) 3.8 events, from which we estimate the possibility of a false positive at 16%. It should be emphasized that this is the probability of finding a spurious signal anywhere in the 166 Å sampled. In reality, the false positive probability is much lower because there are only a small range of velocities that could be plausibly consistent with an exoplanetary origin. Given the 42 km s-1 escape speed (Linsky et al., 2010), a conservative range of possible atmpsheric emission velocities is 60 km s-1, or 0.6 Å, using the binning described above. This reduces the possibility of a random detection in each velocity interval by a factor of 20, leading to a realistic false positive probability of 0.04%. Thus, we conclude that this feature, at +15 km s-1 in the rest frame of the planet, is most likely a real signal in the data.
| Species | OriginaaProposed physical origin in the HD209458 observations:
ST = Stellar, PL = Planet, = Geocoronal airglow. |
Peak Flux Limitbbin units of (10-16 ergs cm-2 s-1 Å-1). 1 limit on the orbital velocity cross-correlation, as described in §3.3, computed over 60 100 and 200 240 km s-1. | |
|---|---|---|---|
| (Å) | |||
| Background | 1145 – 1155 | 1.34 | |
| C III | ST | 1172 – 1180 | 1.30 |
| H I | ST, PL, | 1212 – 1222 | 1.14 |
| Background | 1280 – 1290 | 0.48 | |
| O I | ST, PL, | 1300 – 1310 | 2.56 |
| C II | ST, PL | 1330 – 1340 | 2.92 |
| O I | ST, PL | 1350 – 1360 | 1.21 |
| Si IV | ST | 1390 – 1406 | 2.32 |
| S I | ST, PL | 1470 – 1478 | 0.99 |
| Continuum | ST | 1500 – 1510 | 1.11 |
| Si II | ST, PL | 1524 – 1538 | 1.31 |
| C IV | ST | 1545 – 1555 | 1.79 |
| H2+Si I+Fe II | PL, ST | 1565 – 1585 | 2.05ccTentative H2 detection at 3.8 above this limit, discussed in §4. |
| H2+Fe II | PL, ST | 1600 – 1620 | 3.26 |
There are several strong H2 lines in this region, the brightest being the Lyman band transitions ( – ) of (2 – 8) P(12), (7 – 13) P(3), (6 – 12) P(1), (2 – 9) P(4), and (7 – 13) P(4), = [1580.70, 1580.74, 1581.11, 1581.11, 1581.39 Å], respectively. The oscillator strengths for each of the transitions are larger than 0.063, except for (6 – 12) P(1) which has = 0.027. However, (6 – 12) P(1) has a pumping transition coincident with Ly, as discussed in the following section. The (7 – 13) lines are excited by electron impact, and are not seen elsewhere in the spectrum. In the bottom panel of Figure 5, we overplot the UV photon fluorescence-only H2 model in blue, shifted to = 159 km s-1. The (2 – 8) P(12) line, which is pumped by coincidence with C III 1175, is not seen. Both of the 1581.11 Å transitions are shifted to 1581.95 Å at the velocity of the strong correlation peak. The other features are displaced by 0.25 Å, larger than the COS resolution element, and the 0.1 Å binning applied to the , spectrum. As noted in §3.3, , was computed for several binnings to test for spurious features. As would be expected for an unresolved molecular line, this feature is not detected for rebinning 1 Å. We conclude that – (6 – 12) P(1) 1581.11 Å and – (2 – 9) P(4) 1581.11 Å are the most likely candidates for the possibly detected feature. In Section 4.2 and 4.2.1, we will argue that this feature, if real, cannot be Ly-pumped (6 – 12) P(1), and we describe a possible excitation mechanism for the (2 – 9) P(4) line.
| Line IDbbfootnotemark: | Excitation | Line Flux | Notesccfootnotemark: | |
|---|---|---|---|---|
| (Å) | (10-17 ergs cm-2 s-1 ) | |||
| – (1 – 4) P(5) | 1171.96 | e- Impact | 0.76 | |
| – (2 – 5) Q(1) | 1175.83 | e- Impact | 6.22 | Blend with C III |
| – (4 – 8) Q(1) | 1239.53 | e- Impact | 0.44 | |
| – (1 – 3) R(5) | 1265.67 | UV photon, Ly | 0.71 | |
| – (7 – 12) Q(3) | 1279.10 | e- Impact | 0.80 | |
| – (6 – 7) P(1) | 1365.66 | UV photon, Ly | 2.01 | |
| – (6 – 9) P(1) | 1461.97 | UV photon, Ly | 3.36 | Stellar continuum at 1420 Å |
| – (1 – 8) R(3) | 1547.34 | UV photon, Ly | 5.83 | |
| – (7 – 13) P(3) | 1580.74 | e- Impact | 10.14 | Blend with Fe II |
| – (2 – 9) P(4) | 1581.11 | UV photon | 11.723.08 | Blend with Fe II |
| – (6 – 12) P(1) | 1581.11 | UV photon, Ly | Blend with Fe II | |
| – (6 – 13) P(1) | 1607.50 | UV photon, Ly | 10.54 | |
| – (5 – 12) P(3) | 1613.18 | e- Impact + | 12.80 | |
| UV Photon, O VI |
4.2. H2 Emission from HD209458b
Strong auroral and/or dayglow H2 emission from HD209458b is not observed. Figure 3 is representative of the results from comparisons between our COS observations and the models described in 3.1. Upper limits on the line strengths of the strongest emission lines predicted by our model are presented in Table 4. As discussed above, the two candidate emission lines for the observed feature in the , spectrum are (6 – 12) P(1) and (2 – 9) P(4). This feature peaks at +15 km s-1 in the rest frame of the planet, with a second broader maximum approximately at rest in the planet frame (Figure 5). The (2 – 9) P(4) line is intrinsically stronger than the (6 – 12) P(1), however a lack of clear excitation mechanism complicates this interpretation of the result. There is no obvious pumping transition ((2 – ) R(2) or P(4)) exactly coincident with an observed stellar emission line. Possibilities exist if there is a velocity offset between the “H2 layer” of the planet (1.0 1.1 , where is the radius of HD209458b; Murray-Clay et al. 2009). For example, the (2 – 0) band is near strong N II and He II transitions ( 1083 – 1086 Å) observed in solar-type stars (Redfield et al., 2002). We analyzed observations of HD209458 in order to constrain the stellar spectrum in this wavelength region, but the data were not of sufficient quality to derive meaningful constraints. Another possibility is coincidence between (2 – 4) P(4) 1301.70 Å and O I 1302. For -function emission and absorption profiles, these lines would require a velocity offset of 108 km s-1 to overlap, however in practice these lines will have an appreciable velocity width that may provide sufficient overlap (Ben-Jaffel & Sona Hosseini, 2009).
Exploring the possibility of O I excitation further, we examined the relative line fluxes of stellar Ly and O I. The data set for HD209458 is complicated by observations with different instruments, spectral resolutions, and the attenuation of both lines by 47 pc of ISM. A somewhat more straightforward determination can be made using the high-ressolution STIS spectrum of Cen (Pagano et al., 2004). Interstellar absorption still complicates the comparison, but we estimate an (Ly)/(O I) ratio of 20 – 40 for HD209458. When considering the possibility of H2 excited by stellar O I, it is important to note that appreciable occupation of the = 4 level of the ground electronic state requires an energetic population of H2, but this may be reasonable to expect in the atmosphere of a hot Jupiter. The atmospheric temperature in the HD209458b atmosphere is expected to rise sharply at (Sing et al., 2008b), and this could increase the rovibrational temperature of the molecules in the H2 layer with height, up to the collisional dissociation threshold for H2 ( 4000 K; Shull & Beckwith, 1982). Additionally, there is evidence that the vibrational temperature of H2 in the Jovian atmosphere can exceed the kinetic temperature by as much as 50% (Barthélemy et al., 2005) and electronic excitation of H2 from highly excited levels of the ground state is observed in the warm H2 environment around the classical T Tauri star TW Hya (Herczeg et al., 2002).
4.2.1 Constraints on Surface H I Lyman Series Strength and Magnetic Field
Given the uncertainties in the excitation route for the (2 – 9) P(4) emission line described above, it would be tempting to assign the 1582 Å emission to (6 – 12) P(1) pumped by stellar Ly through the (6 – 0) P(1) 1025.93 Å transition. This scenario does not hold as the (6 –12) band of the Ly pumped progression is among the weaker branches of (6 – ). There are several other lines excited by stellar Ly that should be 2 times brighter (and thus detectable), including the (6 – 13) P(1) 1607.50 Å line that should be 4 times brighter than (6 – 12) P(1). As none of these lines are observed, we are forced to rule out Ly pumping for the observed feature.
The H I Lyman series lines are the strongest far-UV spectral features in a solar-type star, and assuming that the 1582 Å feature is produced by (2 – 9) P(4), this raises the question of why H2 lines excited by Lyman photons are not observed. Vidal-Madjar et al. (2003, 2004) describe the detection of an extended H I atmosphere surrounding the planet, and we hypothesize that this warm cloud of neutral hydrogen is primarily responsible for the suppression of Lyman-pumped H2 emission from HD209458b. This H I layer will scatter the incident Lyman series lines, effectively diffusing the photons away from the line core where the H2 coincidence exists. By comparing model line-strength ratios with the observed 1581.11 Å)/1547.34 Å) and 1581.11 Å)/1607.50 Å) ratios, we can constrain the relative optical depths seen by stellar Ly and Ly photons before they reach the H2 layer. We take the 1 limits for the “measured” fluxes of the 1547.34 and 1607.50 Å lines, and the model line ratios are 0.47 and 0.25, respectively. Assuming that attenuation of the pumping transition for (2 – 9) P(4) is negligible, we estimate that optical depths at the (1 – 2) R(6) 1215.73 Å and (6 – 0) P(1) 1025.93 Å transitions are 8.1 and 15.2, respectively. We created a simulated H I profile to determine the column density required to attenuate the stellar Lyman lines, finding 3 1020 cm-2 on the line of sight from HD209458 to the H2 layer on HD209458b.
The far-UV spectra of Jupiter and Saturn are dominated by electron impact excitation (Feldman et al., 1993; Liu & Dalgarno, 1996; Gustin et al., 2009), and in addition to understanding the lack of H2 emission pumped by Lyman series photons, the apparent lack of electron impact H2 must be addressed. The energetic electron spectrum is driven by the interaction of the planetary magnetic field with the ambient atmosphere (Broadfoot et al. 1979, and see Bhardwaj & Gladstone 2000 for a comprehensive review of the production of H2 emissions in the Jovian aurorae). Thus, assuming that the atmosphere of HD209458b has an H2-dominated composition similar to that of Jupiter, the paucity of electron impact emission can be interpreted as a reflection of a relatively weak surface magnetic field on HD209458b. This interpretation is supported by theoretical studies of the magnetic environment of hot Jupiters. The magnetic moment () is known to scale with the core density of the planet, the rotation rate, and core radius (Grießmeier et al., 2004). A short-period exoplanet such as HD209458b is expected to be tidally locked due to gravitational dissipation, which results in a dramatically lower rotation rate compared to a gas giant such as Jupiter. Combining the rotation rate, the density of the planet inferred from transit observations, and models of the interior structure, HD209458b is expected to have an intrinsic magnetic moment (in the tidally locked limit) of 0.01 (Grießmeier et al., 2004). When factoring in the interaction with the stellar magnetic field, this value is of order 0.1 , consistent with the surface magnetic field calculations of Sánchez-Lavega (2004), 0.1 (where is the Jovian polar magnetic field). Interestingly, recent results from radio-frequency observations of the well-studied hot Jupiter HD189733b (Lecavelier Des Etangs et al., 2009) support the hypothesis of a weak exoplanet magnetic field. Another possible source of energy for atmospheric electrons is the interplanetary magnetic field (), but this is estimated to be small for the HD209458 system 5 10-3 (Erkaev et al., 2005). We conclude that the feature observed at 1582 Å in HD209458b is consistent with no detectable lines from electron impact H2. The slow rotation and low density of the planet creates a magnetic field that is incapable of producing H2 emission with intensities observed in the Jovian system.
4.2.2 Alternative Excitation Routes and H2 Radiative Transfer Effects
We have shown that the primary excitation routes for populating the Lyman and Werner bands in gas giants in our solar system may be suppressed in the atmosphere of HD209458b. It is worth noting that the higher lying electronic states of H2 can be populated via electron impact and absorption of extreme UV (EUV; 911 Å) photons. Electron impact excitation of the and states of H2 can populate the Lyman bands via a radiative cascade process ( + ), contributing as much as 25% of the total flux from the – band emission (Ajello et al., 1982). We note that this process concentrates the emitted photons in the 1350 – 1500 Å region, and does not favor the putative – (2 – 9) P(4) emission feature. Coupling this with the arguments against electron impact excitation noted above, we dismiss this as a possible energy source. What we cannot rule out is the possibility that one of the higher-lying electronic states is photo-excited by EUV stellar line photons. This cascade could preferentially populate a specific level of the state, causing the resultant emission spectrum to differ from that expected from direct excitation of the Lyman and Werner bands. However, the upper H I atmosphere of HD209458b should effectively attenuate any stellar EUV emission capable of exciting H2, making this route unlikely.
One possibility that could explain the lack of H2 features seen in the spectrum of HD209458b is the coherent scattering of pumping photons absorbed in the wings of the H2 line profiles. This partial frequency redistribution process (Lupu et al., 2009; Barthélemy et al., 2004) requires a more sophisticated radiative transfer treatment than the synthetic H2 models presented in this work, where all photons absorbed in a given transition are redistributed to the line core prior to emission. This partial redistribution process, which has been observed in the spectra of Jupiter and Saturn, acts to suppress the line-to-continuum ratio and decrease the contribution from subordinate transitions in a given progression. Additional radiative transfer investigations into EUV excitation of H2 and frequency redistribution would be very useful for the interpretation of future experiments characterizing the far-UV spectra of extrasolar giant planets.
5. Summary
We have presented new -COS observations aimed at characterizing aurorae on the extrasolar planet HD209458b. We use a model for the auroral and dayglow spectra of Jupiter to predict the expected features and use this spectrum to guide the data analysis. These data reveal no unambiguously identifiable signature of atomic or H2 emission from the planet. We do detect a significant feature at 1582 Å, observed at +15 ( 20) km s-1 in the rest frame of the planet. This feature may be the H2 – (2 – 9) P(4) line at = 1581.11 Å, however the excitation mechanism for this line is unclear. Based on this feature, we placed limits on the level of emission from electron impact and stellar fluorescent excitation. We put these limits in the context of the HD209458 system, deriving a limit on the atmospheric column of H I. The non-detection of electron impact H2 is consistent with predictions of a weak magnetic field due to tidal locking and the low density of the planet. We suggest that future ultraviolet studies of auroral/dayglow emission from extrasolar giant planets would benefit by targeting the nearest transiting planet systems that do not show evidence for extended atomic and ionic atmospheres.
References
- Abgrall et al. (1993a) Abgrall, H., Roueff, E., Launay, F., Roncin, J. Y., & Subtil, J. L. 1993a, A&AS, 101, 273
- Abgrall et al. (1993b) —. 1993b, A&AS, 101, 323
- Abgrall et al. (1997) Abgrall, H., Roueff, E., Liu, X., & Shemansky, D. E. 1997, ApJ, 481, 557
- Ajello et al. (1982) Ajello, J. M., Srivastava, S. K., & Yung, Y. L. 1982, Phys. Rev. A, 25, 2485
- Barthélemy et al. (2005) Barthélemy, M., Lilensten, J., & Parkinson, C. 2005, A&A, 437, 329
- Barthélemy et al. (2004) Barthélemy, M., Parkinson, C., Lilensten, J., & Prangé, R. 2004, A&A, 423, 391
- Ben-Jaffel (2007) Ben-Jaffel, L. 2007, ApJ, 671, L61
- Ben-Jaffel & Sona Hosseini (2009) Ben-Jaffel, L. & Sona Hosseini, S. 2009, ArXiv e-prints
- Bhardwaj & Gladstone (2000) Bhardwaj, A. & Gladstone, G. R. 2000, Reviews of Geophysics, 38, 295
- Broadfoot et al. (1979) Broadfoot, A. L., Belton, M. J., Takacs, P. Z., Sandel, B. R., Shemansky, D. E., Holberg, J. B., Ajello, J. M., Moos, H. W., Atreya, S. K., Donahue, T. M., Bertaux, J. L., Blamont, J. E., Strobel, D. F., McConnell, J. C., Goody, R., Dalgarno, A., & McElroy, M. B. 1979, Science, 204, 979
- Charbonneau et al. (2000) Charbonneau, D., Brown, T. M., Latham, D. W., & Mayor, M. 2000, ApJ, 529, L45
- Charbonneau et al. (2002) Charbonneau, D., Brown, T. M., Noyes, R. W., & Gilliland, R. L. 2002, ApJ, 568, 377
- Clarke et al. (1998) Clarke, J. T., Ben Jaffel, L., & Gérard, J. 1998, J. Geophys. Res., 103, 20217
- Danforth et al. (2009) Danforth, C. W., Stocke, J. T., & Shull, J. M. 2009, ApJ, 000, 0
- Désert et al. (2009) Désert, J., Lecavelier des Etangs, A., Hébrard, G., Sing, D. K., Ehrenreich, D., Ferlet, R., & Vidal-Madjar, A. 2009, ApJ, 699, 478
- Erkaev et al. (2005) Erkaev, N. V., Penz, T., Lammer, H., Lichtenegger, H. I. M., Biernat, H. K., Wurz, P., Grießmeier, J., & Weiss, W. W. 2005, ApJS, 157, 396
- Feldman et al. (1993) Feldman, P. D., McGrath, M. A., Moos, H. W., Durrance, S. T., Strobel, D. F., & Davidsen, A. F. 1993, ApJ, 406, 279
- France et al. (2005) France, K., Andersson, B.-G., McCandliss, S. R., & Feldman, P. D. 2005, ApJ, 628, 750
- France et al. (2009) France, K., Beasley, M., Keeney, B. A., Danforth, C. W., Froning, C. S., & Green, J. C. 2009, ArXiv e-prints
- García Muñoz (2007) García Muñoz, A. 2007, Planet. Space Sci., 55, 1426
- Green (2010) Green, J. C. e. a. 2010, ApJ, 000, L1+
- Grießmeier et al. (2004) Grießmeier, J., Stadelmann, A., Penz, T., Lammer, H., Selsis, F., Ribas, I., Guinan, E. F., Motschmann, U., Biernat, H. K., & Weiss, W. W. 2004, A&A, 425, 753
- Gustin et al. (2009) Gustin, J., Gérard, J., Pryor, W., Feldman, P. D., Grodent, D., & Holsclaw, G. 2009, Icarus, 200, 176
- Gustin et al. (2002) Gustin, J., Grodent, D., Gérard, J. C., & Clarke, J. T. 2002, Icarus, 157, 91
- Hall et al. (1998) Hall, D. T., Feldman, P. D., McGrath, M. A., & Strobel, D. F. 1998, ApJ, 499, 475
- Henry et al. (2000) Henry, G. W., Marcy, G. W., Butler, R. P., & Vogt, S. S. 2000, ApJ, 529, L41
- Herczeg et al. (2002) Herczeg, G. J., Linsky, J. L., Valenti, J. A., Johns-Krull, C. M., & Wood, B. E. 2002, ApJ, 572, 310
- Herzberg (1950) Herzberg, G. 1950, Molecular Spectra and Molecular Structure (D. Van Nostrad Company)
- Hinkle et al. (2005) Hinkle, K., Wallace, L., Valenti, J., & Ayres, T. 2005, Ultraviolet Atlas of the Arcturus Spectrum, 1150-3800 A
- Knutson et al. (2008) Knutson, H. A., Charbonneau, D., Allen, L. E., Burrows, A., & Megeath, S. T. 2008, ApJ, 673, 526
- Knutson et al. (2009) Knutson, H. A., Charbonneau, D., Cowan, N. B., Fortney, J. J., Showman, A. P., Agol, E., Henry, G. W., Everett, M. E., & Allen, L. E. 2009, ApJ, 690, 822
- Knutson et al. (2007) Knutson, H. A., Charbonneau, D., Noyes, R. W., Brown, T. M., & Gilliland, R. L. 2007, ApJ, 655, 564
- Laughlin et al. (2005) Laughlin, G., Marcy, G. W., Vogt, S. S., Fischer, D. A., & Butler, R. P. 2005, ApJ, 629, L121
- Lecavelier Des Etangs et al. (2009) Lecavelier Des Etangs, A., Sirothia, S. K., Gopal-Krishna, & Zarka, P. 2009, A&A, 500, L51
- Lecavelier Des Etangs et al. (2008) Lecavelier Des Etangs, A., Vidal-Madjar, A., Désert, J., & Sing, D. 2008, A&A, 485, 865
- Linsky et al. (2010) Linsky, J. L., Yang, H., France, K., & Green, J. C. 2010, ApJ, 000, 0
- Liu & Dalgarno (1996) Liu, W. & Dalgarno, A. 1996, ApJ, 462, 502
- Lupu et al. (2009) Lupu, R. E., Feldman, P. D., McCandliss, S. R., & France, K. 2009, in American Institute of Physics Conference Series, Vol. 1135, American Institute of Physics Conference Series, ed. M. E. van Steenberg, G. Sonneborn, H. W. Moos, & W. P. Blair , 228–230
- Mazeh et al. (2000) Mazeh, T., Naef, D., Torres, G., Latham, D. W., Mayor, M., Beuzit, J., Brown, T. M., Buchhave, L., Burnet, M., Carney, B. W., Charbonneau, D., Drukier, G. A., Laird, J. B., Pepe, F., Perrier, C., Queloz, D., Santos, N. C., Sivan, J., Udry, S., & Zucker, S. 2000, ApJ, 532, L55
- McCandliss et al. (2009) McCandliss, S. R., France, K., Osterman, S., Green, J. C., McPhate, J. B., & Wilkinson, E. 2009, ArXiv e-prints
- Murray-Clay et al. (2009) Murray-Clay, R. A., Chiang, E. I., & Murray, N. 2009, ApJ, 693, 23
- Noren et al. (2001) Noren, C., Kanik, I., Ajello, J. M., McCartney, P., Makarov, O. P., McClintock, W. E., & Drake, V. A. 2001, Geophys. Res. Lett., 28, 1379
- Osterman, S. (2010) Osterman, S., J. C. e. a. 2010, ApJ, 000, L5+
- Pagano et al. (2004) Pagano, I., Linsky, J. L., Valenti, J., & Duncan, D. K. 2004, A&A, 415, 331
- Redfield et al. (2002) Redfield, S., Linsky, J. L., Ake, T. B., Ayres, T. R., Dupree, A. K., Robinson, R. D., Wood, B. E., & Young, P. R. 2002, ApJ, 581, 626
- Sánchez-Lavega (2004) Sánchez-Lavega, A. 2004, ApJ, 609, L87
- Shull & Beckwith (1982) Shull, M. & Beckwith, S. 1982, Annual Reviews of Astronomy and Astrophysics, 30, 163
- Sing et al. (2009) Sing, D. K., Désert, J., Lecavelier Des Etangs, A., Ballester, G. E., Vidal-Madjar, A., Parmentier, V., Hebrard, G., & Henry, G. W. 2009, A&A, 505, 891
- Sing et al. (2008a) Sing, D. K., Vidal-Madjar, A., Désert, J., Lecavelier des Etangs, A., & Ballester, G. 2008a, ApJ, 686, 658
- Sing et al. (2008b) Sing, D. K., Vidal-Madjar, A., Lecavelier des Etangs, A., Désert, J., Ballester, G., & Ehrenreich, D. 2008b, ApJ, 686, 667
- Stecher & Williams (1967) Stecher, T. P. & Williams, D. A. 1967, ApJ, 149, L29+
- Sudarsky et al. (2003) Sudarsky, D., Burrows, A., & Hubeny, I. 2003, ApJ, 588, 1121
- Swain et al. (2009) Swain, M. R., Tinetti, G., Vasisht, G., Deroo, P., Griffith, C., Bouwman, J., Chen, P., Yung, Y., Burrows, A., Brown, L. R., Matthews, J., Rowe, J. F., Kuschnig, R., & Angerhausen, D. 2009, ApJ, 704, 1616
- Tobiska & Eparvier (1998) Tobiska, W. K. & Eparvier, F. G. 1998, Sol. Phys., 177, 147
- Vidal-Madjar et al. (2004) Vidal-Madjar, A., Désert, J., Lecavelier des Etangs, A., Hébrard, G., Ballester, G. E., Ehrenreich, D., Ferlet, R., McConnell, J. C., Mayor, M., & Parkinson, C. D. 2004, ApJ, 604, L69
- Vidal-Madjar et al. (2003) Vidal-Madjar, A., Lecavelier des Etangs, A., Désert, J., Ballester, G. E., Ferlet, R., Hébrard, G., & Mayor, M. 2003, Nature, 422, 143
- Vidal-Madjar et al. (2008) —. 2008, ApJ, 676, L57
- Wolven & Feldman (1998) Wolven, B. C. & Feldman, P. D. 1998, Geophys. Res. Lett., 25, 1537
- Wolven et al. (1997) Wolven, B. C., Feldman, P. D., Strobel, D. F., & McGrath, M. A. 1997, ApJ, 475, 835
- Yelle (2004) Yelle, R. V. 2004, Icarus, 170, 167