On the Allometric Scaling of Resource Intake Under Limiting Conditions.
Abstract
Individual resource intake rates are known to depend on both individual body size and resource availability. Here, we have developed a model to integrate these two drivers, accounting explicitly for the scaling of perceived resource availability with individual body size. The model merges a Kleiber-like scaling law with Holling functional responses into a single mathematical framework, involving both body-size the density of resources.
When the availability of resources is held constant the model predicts a relationship between resource intake rates and body sizes whose log-log graph is a concave curve. The significant deviation from a power law accounts for the body size dependency of resource limitations. The model results are consistent with data from both a laboratory experiment on benthic macro-invertebrates and the available literature.
1DISTEBA - Università del Salento
2Centro euroMediterraneo per i Cambiamenti Climatici
3Dip. di Matematica “E. De Giorgi” - Università del
Salento
Keywords: Body size; resource availability; metabolic theory; Holling functional response; Kleiber law; individual-based resource perception.
1 Introduction
Resource intake is a major component of individual fitness. This subject was independently addressed from the perspectives of ecological energetics (Kleiber,, 1932), niche theory (Hutchinson,, 1959) and behavioral ecology (e.g. the Charnov marginal value theorem; (Charnov,, 1976)).
It is well known that the rate at which individuals acquire resources depends both on their body masses and on the overall abundance of those resources that they can efficiently exploit. Ecological energetics and, more recently, metabolic theory, have addressed the relationship between resource intake rates and individual body mass (Peters,, 1983; Brown et al.,, 2004). Behavioral ecology has quantitatively addressed the relationships between resource intake rate and resource availability, through the so called “Holling’s functional responses” (Holling, 1959a, ; Holling, 1959b, ).
In a resource limited environment, individual body size also affects the individual perception of resource availability (Haskell et al.,, 2002) determining patch selection (Belovsky,, 1997; Ritchie,, 1998) and patch departure behaviors (Wilson et al.,, 1999; Basset and DeAngelis,, 2007). The combined influence of body size on individual metabolic rates and individual perception of resource availability has been modeled as a major determinant of interspecific coexistence (Basset and DeAngelis,, 2007).
A simple but far-reaching observation wafts in the literature: the ingestion rate of large individuals is limited at higher resource availability than that of smaller competitors: the former give up the patch earlier and at higher densities of remaining resources than the latter (Brown et al.,, 1994), and they are more common in ecosystems which are richer in nutrients and more productive (Makarieva et al.,, 2004); consistently the body size of the largest species occurring in an ecosystem has been found to be a growing function of the ecosystem surface area (Marquet et al.,, 2005).
A body size dependency of resource availability has not yet been incorporated in an allometric model relating metabolism to body mass. However, when limiting resource conditions occur, it seems quite obvious that larger individuals, or larger species, are limited earlier than their smaller competitors, being comparatively less able to maintain optimal resource acquisition rates. As a result, the actual resource acquisition rates vs body-mass relationship should deviate from an ideal scaling law, resulting in a concave curve in a log-log graph.
Here, we propose a mathematical model that links the resource intake rate with both body size and the level of available resources. The model merges into a single framework a Kleiber-like scaling law, Holling’s functional response, and a scaling law linking the perceived level of available resources with body size. Data from a laboratory experiment on benthic macro-invertebrates and metadata from the available literature are used to evaluate the realism of the model results.
2 The Model
Kleiber’s equation is a scaling law linking the metabolism to the body size of individual living organisms. It can be written in the following form:
| (1) |
where:
-
is the total energy required by the organism for its metabolic needs;
-
is a baseline power which determines the elevation of the scaling law;
-
is the mass of the organism (or ’body size’);
-
is a baseline mass (so that the power law is applied to a non-dimensional quantity);
-
is a positive constant, often taken to be equal to .
There is a very strong consensus about the idea that and are functionally related, but a considerable debate on the nature of this relationship. A few theoretical models are consistent in deriving the power-law in equation (1) but they have spurred much controversy about the underlying mechanisms (West et al.,, 1997; Banavar et al.,, 1999; Makarieva et al.,, 2004; Glazier,, 2005). The debate has often focused on the exact value to be given to the scaling exponent, and the value is the most commonly cited one (e.g. Peters,, 1983). Different values have been observed for different organisms or indicators of metabolism; see, e.g., (Reich et al.,, 2006; Enquist et al.,, 2007) for plants, (White and Seymour,, 2005) for mammals, (Starostová et al.,, 2009) for cell size effects, and (Hendriks,, 2007) for a review. At least part of the controversy stems from the fact that the parameter is unlikely to be a true constant. Metabolic theory argues convincingly that should be a function of the temperature (Brown et al.,, 2004). Both data and theory suggest that several other factors affect (Glazier,, 2010). Since the focus is on metabolism, the whole debate, in a more or less implicit way, is framed by the assumption that the individuals live in an ’ideal’ environment, where ’ideal’ means that all their needs are fully satisfied.
In the last decade the ecological implications of body size has raised a growing attention in the ecological literature and Kleiber-like equations have been used in order to describe the rate of resource intake as a function of body size, at least as a first approximation (Peters,, 1983; Brown et al.,, 2004). Yet, when applied to resource intake rate, equation (1) overlooks the role of individual adjustments to scarcity of resources in a natural environment. The relationship between intake of resources and their availability is addressed by Holling’s functional responses (Holling, 1959a, ; Holling, 1959b, ); furthermore, the individual perception of resource availability has a dependency on body size (Ritchie,, 1998; Haskell et al.,, 2002; Basset and DeAngelis,, 2007).
In a homogeneous environment, characterized by a given amount of available resources, the abundance of resources perceived by any individual organism is a function of its size: larger organisms may feel a sense of scarcity, while smaller ones still have a subjective perception of abundance. In this context, ’homogeneous environment’ is a place where the spatial location of resources is unimportant, and a single number () is sufficient to characterize the resources available in that environment. We shall assume that the functional link between perceived resources and mass is a power law:
| (2) |
where the value of the constant likely ranges from to (Basset and DeAngelis,, 2007), and is the normalization factor required to match the available level of resources to the perceived level of resources of an individual having exactly the baseline mass .
How does an individual react to relative degrees of resource scarcity? The traditional approach is to use the Holling’s functional response models, where a prescribed function links resource intake to resource availability, even though several other reasonable choices are possible for (i.e. May,, 1972). According to the cited recent evidence suggesting that individual behaviour is primarily affected by perceived resource availability rather than by absolute availability, Holling’s responses can be formulated as
| (3) |
where ( is Holling type II, is Holling type III). Here the intake function is a non-dimensional quantity, that ranges between zero and one. The independent variable is the perceived resource level , and the half-saturation coefficient does not depend on the body size. The same intake function may be expressed in a mathematically equivalent way by using as the independent variable, which is operationally more convenient since is much easier to quantify experimentally than . In fact substituting (2) in (3) we obtain
| (4) |
where the half-saturation coefficient is the mass-dependent function .
For less-than-ideal, or “natural” conditions, the allometric scaling law (1), intended as a model of the resource intake rate, needs to be corrected by the mass-dependent intake function as as follows
| (5) |
where is referred as in order to make explicit the dependency on body size and , from now on, is the mass of ingested resources.
At this point, we rewrite (5) using (4) to describe the quantitative relationship of intake rate with mass and available resources:
| (6) |
where for convenience we have defined and . In equation (6) the intake rate depends both on body size and on resource availability. For every small interval of values, the function can be approximated by a scaling law, whose scaling exponent is lower than the one appearing in (1), and decreases with increasing . This new relationship has the following two interesting limits, both expressed by scaling laws:
| (7) |
| (8) |
where the symbol “” is used with its formal mathematical meaning of “asymptotic to” and the labels ’Abundant’ and ’Scarce’ refer to size-dependent perceived resource availability. The upper bound (7) corresponds to the allometric law (1): for any assigned value of the resources , there is a range of small enough body sizes that perceives an unlimited ’ideal’ environment. At the opposite end of the spectrum of sizes, for any assigned value of the resources , the individuals are so large to be limited by the perceived resource abundance so that (8) applies. This is a scaling law in which the intake rate is proportional to the -power of the body size, and also depends on the overall amount of available resources (Figure 1). For large values of , the scarcity regime may even yield a power law in which the intake rate decreases with the mass.
In Figure 1 the quantity represents the ingested mass, the ingested mass per unit of time ( is also mass per unit of time), the model parameter is posed equal to one gram, and is approximated to 0.15 g/day according to the experimental evidence (Peters,, 1983; Basset,, 1992). The exponent is set equal to 2, i.e. Holling type III functional response, and the different curves plotted in each graph correspond to a different value of . To mirror the uncertainty in the value of , we use the three values . Therefore,
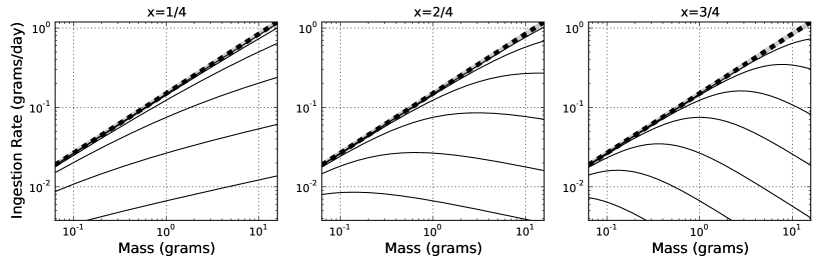
the black lines represent the ingestion rates of individuals of varying masses in an hypothetical experiment in which the level of available resources is kept constant by replenishing the resources as the organism consumes them (for example with a chemostat-like set-up).
For high values of the relationship between resource ingestion and body size shows a marked deviation from a power-law behaviour. Of course, one should not expect to be able to observe the full asymptotic regime (8), because it implicitly assumes that an organism can sustain arbitrarily low intake rates, which is impossible. When the available resources are too low, an organism must leave the patch, migrate away from the resource-depleted region, or die.
We also observe that in the present formulation, the relevant measure of available resources is , not . Since it is , it follows that among species with individuals of comparable size, those characterized by a low value of remain closer to the allometric law (1) than those having a larger value of . In this sense, organisms with low cope better with scarcity of resources. A similar argument holds for .
3 Case Studies on the Model Assumptions
The model presented in the previous section is embodied by equation (6) which depends on the validity of equation (2). In this section we argue that these equations generalize and extend concepts and ideas that have already been expressed in the literature. We also address the consistency of the key model assumptions with natural conditions using laboratory experiments and a metadata analysis of case studies.
Equation (2) describes mathematically the decrease of perceived resource availability as the individual body-size increases, given a fixed level of absolute resources. Such an inverse relationship was already implicitly incorporated in different models dealing with individual patch choice dynamics (Ritchie,, 1998), home range size (Haskell et al.,, 2002), coexistence relationships (Basset and DeAngelis,, 2007), but it was not explicitly modelled, so far. An individual-based perception of resources dates back to the MacArthur and Levins, (1964) environmental grain concept and it is not limited to a body-size dependency. Actually body size accounts only for part of the possible deviation; resource distribution (Haskell et al.,, 2002), resource defence mechanisms (Abrams and Walters,, 1996), individual consumer niche breadth (Rossi,, 1985), searching and pursuit ability (Krebs and Davies,, 1997), risk adverse behavioural strategy (Werner et al.,, 1981) represent other sources of deviations of perceived resource availability. However, body size represents a systematic source of deviation of perceived resource availability, whose influence can be modeled as a scaling law. In our model, body-size independent and body-size dependent forcing factors can be described by allowing for variations respectively in the coefficient and of the scaling law (2). Accounting for the allometric variation of perceived resource availability increases the realism of resource availability assessment, even though it does not completely resolve all other biases listed above.
Perceived resource availability is a more realistic but less easily tractable measure of resource availability than overall biomass or units of potential resources per unit of space. Estimates of perceived resource availability can be indirectly derived from the analysis of the patterns of variation of quantifiable patch use components with individual body size. Here, we consider the half-saturation coefficient of Holling’s functional responses and giving-up-density from resource patches (GUD) as quantifiable proxies for the resource availability perceived at the individual level with increasing individual body size.
The half-saturation coefficient expresses the resource density at which the individual resource intake rate is reduced to 50% of the maximum rate; the higher is the resource density at which individual intake rate is reduced by 50%, the lower is the perceived resource density. In our conceptual framework the scaling of the perceived resources with body size implies that the half-saturation coefficient of Holling’s functional responses must also scale as a power law of the body size (equations 3 and 4 combined to give equation 5). In a case study we have run experiments under laboratory conditions with benthic macro-invertebrates in order to evaluate the behaviour of the functional response parameters with species body size. According to the Holling Type III functional response utilised in our model, the half saturation coefficient was actually found to scale positively with individual body size with a scaling factor not far from ¼ (i.e., , Figure 2
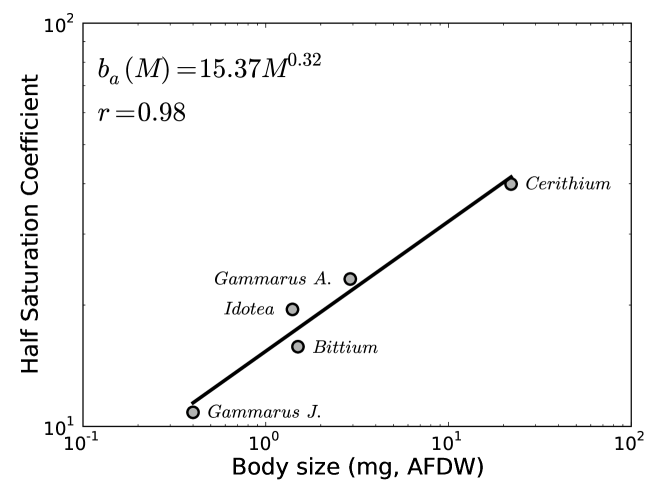
). This direct relationship was independent of the functional response equation used; depending on the type of Holling’s functional response used for the fit, the half-saturation coefficient scaled with species body-size with a positive exponent in a range between ¼ and ½. A positive scaling factor of the half-saturation coefficient with individual cell size was also found on phytoplankton, where available data (, Valeila,, 1984) showed a scaling factor close to ¼ . A range of values between ¼ and ¾ was also recently used to investigate the influence of size dependent space use consumer behaviour on species interaction and coexistence within competitive guilds (Basset and DeAngelis,, 2007).
The occurrence of an inverse scaling of perceived resource availability with body size is also derived by the analysis of published data on the patch departure behaviour, using the resource giving up density as a proxy for perceived resource availability: i.e., everything else being equal, higher GUDs indicate lower perceived availabilities. Actually, GUD data on the seed-eating rodent guilds showed higher GUDs for higher individual body masses and metabolism (Brown,, 1988; Brown et al.,, 1994; Kotler et al.,, 2002; but see also: Kotler et al.,, 1993 for opposite evidence). Predation risks (manipulation of predators: Mohr et al.,, 2003; availability of refugia and intensity of light: Brown et al.,, 1988) were other factors found to affect the GUD of seed-eating rodents. Therefore, the assumption underlying equation (2) is supported by a specific laboratory case study and by literature data from guilds including invertebrate and vertebrate species.
Equation (6) is a new model for the relationship between intake rate and individual body-size, which admits a dependency on resource availability. It is not a power law, but, for limited ranges of body sizes, it can be approximated by power laws having an exponent which decreases with increasing mass, and which tends to a Kleiber-like law for un-limiting resource availability. So, equation (6) summarizes and extends existing evidence on deviations of the allometric exponent of the intake-rate versus body-size relationship under limiting conditions.
Literature data show a large variability of the scaling exponent of resource intake-rate versus individual body-size, spanning a range between and , as shown in Figure 3A
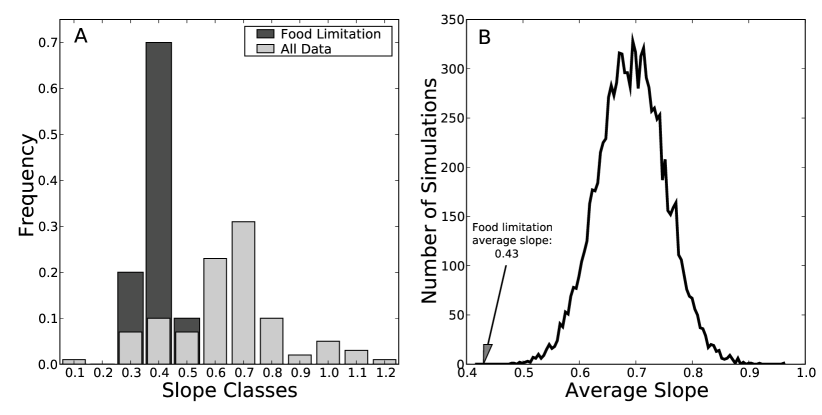
. The data refer to 100 experimental cases covering terrestrial and aquatic ecosystems, invertebrate and vertebrate guilds. If the intake rate always mirrored Kleiber’s allometric law, such a large range of experimental conditions would not be relevant for the observed variability, since this law is supposed to cover a wide range of sizes and taxonomic variability, and it is proposed as an universal law. In our model for resource intake rates, an allometric law is just an upper threshold for ‘ideal’ unlimited conditions. The subsample of ten experimental cases specifically referring to limiting conditions shows an average exponent , much lower than the average exponent of the complete data set. A Montecarlo simulation carried out by extracting 9999 randomly chosen subsamples of ten elements shows, with an extremely high confidence level, that the difference of the averages is statistically significant, and it is not due to stochastic fluctuations (Figure 3B). Therefore, our model appears to be consistent with the evidence available in the literature.
The patterns shown in Figure 1 go beyond the adaptation of the individual ingestion rate to a low perceived level of resource density at the local, patch, scale. For every fixed absolute resource density occurring in a certain determined ecosystem, the corresponding curve in the graph of Figure 1 describes how individual fitness is affected by individual size. In fact, by increasing size while the absolute resource density remains constant, individuals need to cope with an increasingly strong resource limitation, by adopting a suitable patch selection and departure behaviour, or by a home range expansion (Carbone and Gittleman,, 2002), or by restricting the range of colonised ecosystems according to the ecosystem size and overall productivity (Marquet et al.,, 2005); this hierarchy of implications of the size dependency of resource limitation is then consistent with the observed patterns of increasing extinction risk with increasing body size in vertebrates (Clauset et al.,, 2009).
4 Conclusions
The model described in this paper synthesizes in a single equation three main factors of the process of animal resource intake: (a) the dependence of individual metabolic requirements on individual body size; (b) the dependence of individual resource intake rates on resource availability; and, finally (c) the dependence of resource availability perceived at the individual level on individual body size. It extends the fields of application of both Holling and Kleiber equations. As regards the former, the substitution of the term ‘resource availability’ with the body-size dependent term ‘perceived availability’ extends the application of Holling’s functional responses to the analysis of intra-guild competitive ability and coexistence relationship. As regards the latter, the introduction of the normalized intake function in the Kleiber equation extends it to limiting conditions, incorporating conceptually a size dependency in the allometric scaling coefficient. Finally, by unifying the components of resource intake-rate variation due to individual body-size and resource availability, the model contributes to the integration of metabolic theory and resource perception with the dynamics of resource availability.
5 Acknowledgements.
The research was funded by PRIN 2005 and FP7-WISER project grants to A. Basset. We thank L. Rossi and D. Mouillot for their comments on an earlier draft of this paper.
6 Online Appendix
Literature data sources for Figure 3. The key information on the allometric scaling of individual resource intake-rate with individual body-size are reported by listing the taxonomic group considered (“Group”), the slope value of the allometric relationship (“Exponent ”), the declared occurrence of resource limitation to the consumers (“Limited”) and the reference source (“Reference”).
| Group | Exponent | Limited | Reference |
| Crassostea gigas | 0.19 | Bougrier et al., Aquaculture 134 (1995) | |
| Crassostea gigas | 0.311 | Bougrier et al., Aquaculture 134 (1995) | |
| Crassostea gigas | 0.312 | Bougrier et al., Aquaculture 134 (1995) | |
| Crassostea gigas | 0.326 | Bougrier et al., Aquaculture 134 (1995) | |
| Crassostea gigas | 0.348 | Bougrier et al., Aquaculture 134 (1995) | |
| Grazer ruminants | 0.36 | x | Illius&Gordon, Journal of Animal Ecology 56 (1987) |
| Grazer mammals | 0.36 | x | Clutton-Brock&Harvey, Special Publication of the American Society of Mammologists 7 (1983) |
| Crassostea gigas | 0.364 | Bougrier et al., Aquaculture 134 (1995) | |
| Mytilus edulis | 0.408 | x | Thompson, Marine Biology 79 (1984) |
| Rotifers | 0.417 | x | Stemberger&Gilbert, Ecology 68 (1987) |
| Daphniids | 0.42 | x | Jeyasingh, Ecology Letters 10 (2007) |
| Subantartic copepods | 0.42 | x | Atkinson, Marine Ecology Progress Series 130 (1996) |
| Crassostea gigas | 0.422 | Bougrier et al., Aquaculture 134 (1995) | |
| Subantartic copepods | 0.43 | x | Atkinson, Marine Ecology Progress Series 130 (1996) |
| Ursus arctos horribilis | 0.44 | Rode et al., Oecologia 128 (2001) | |
| Pinnipeds Adult | 0.44 | Innes et al., Journal of Animal Ecology 1987 | |
| Grazers mammals | 0.48 | x | Conradt et al., Animal Behaviour 59 (2000) |
| Subantartic copepods | 0.49 | x | Atkinson, Marine Ecology Progress Series 130 (1996) |
| Subantartic copepods | 0.51 | x | Atkinson, Marine Ecology Progress Series 130 (1996) |
| Crassostea gigas | 0.535 | Bougrier et al., Aquaculture 134 (1995) | |
| Crassostea gigas | 0.539 | Bougrier et al., Aquaculture 134 (1995) | |
| Ursus arctos horribilis | 0.57 | Rode et al., Oecologia 128 (2001) | |
| Terrestrial carnivora adult | 0.58 | Innes et al., Journal of Animal Ecology 1987 | |
| Mustelidae adult | 0.58 | Innes et al., Journal of Animal Ecology 1987 | |
| Crassostea gigas | 0.585 | Bougrier et al., Aquaculture 134 (1995) | |
| Arid zone marsupials | 0.601 | Nagy&Bradshaw, Journal of Mammalogy 81 (2000) | |
| Chlamys nobilis | 0.601 | Pan&Wang, Marine Ecology Progress Series 365 (2008) | |
| Dreissena polymorpha | 0.61 | Schneider et al., Oecologia 117 (1998) | |
| Chlamys farreri | 0.62 | Bacher et al., Aquating Living Resources 16 (2003) | |
| Alces alces calves | 0.62 | Andersen&Saether, Ecology 73 (1992) | |
| Copepods | 0.623 | Ikeda, Journal of Experimental Marine Ecology and Biology 29 (1977) | |
| Raptorial birds | 0.63 | Calder&King, Avian Biology IV (1974) | |
| Daphniids | 0.63 | Jeyasingh, Ecology Letters 10 (2007) | |
| Raptorial birds | 0.63 | Schoener, The American Naturalist 49 (1968) | |
| Pinnipeds adult and terrestrial carnivora | 0.63 | Innes et al., Journal of Animal Ecology 1987 | |
| Crassostea gigas | 0.64 | Bougrier et al., Aquaculture 134 (1995) | |
| Herbivorous caecum fermenters | 0.64 | Clauss et al., Comparative Biochemistry and Physiology (2007) | |
| Crassostea gigas | 0.663 | Bougrier et al., Aquaculture 134 (1995) | |
| Crassostea gigas | 0.67 | Bougrier et al., Aquaculture 134 (1995) | |
| Delphinoidea | 0.67 | Innes et al., Marine Mammal Sciences 2 (1986) | |
| Forest floor arthropods | 0.68 | Reichle, Ecology 49 (1968) | |
| Mammals | 0.68 | Harestad&Bunnel, Ecology 60 (1979) | |
| Pleuronectes platessa | 0.68 | Van der Veer et al., Journal of Sea Research in press (2009) | |
| Sea Ducks | 0.69 | Goudie&Ankney, Ecology 67 (1986) | |
| Carnivorous homeotherms | 0.692 | Farlow, Ecology 57 (1976) | |
| Invertebrates | 0.694 | Capriulo, Marine Biology 71 (1982) | |
| Crassostea gigas | 0.695 | Bougrier et al., Aquaculture 134 (1995) | |
| Carnivorous mammals | 0.697 | Farlow, Ecology 57 (1976) | |
| Styela plicata | 0.7 | Fisher, Marine Biology 41 (1977) | |
| Passerine birds | 0.7 | Lindstrom&Kvist, Proceedings Biological Sciences 261 (1995) | |
| Herbivorous mammals | 0.7 | Shipley et al., The American Naturalist 143 (1994) | |
| Capitella sp. | 0.701 | Forbes&Lopez, Biological Bulletin 172 (1987) | |
| Homeotherms | 0.703 | Farlow, Ecology 57 (1976) | |
| Marine calanoid copepods | 0.703 | Saiz&Calbet, Limnology and Oceanography 52 (2007) | |
| Crassostea gigas | 0.707 | Bougrier et al., Aquaculture 134 (1995) | |
| Phocidae adults | 0.71 | Innes et al., Journal of Animal Ecology 1987 | |
| Herbivorous homeoterms | 0.716 | Farlow, Ecology 57 (1976) | |
| Mammals and birds | 0.72 | Kirkwood, Comparative Biochemistry and Physiology 75 (1983) | |
| Phocidae juveniles | 0.72 | Innes et al., Journal of Animal Ecology 1987 | |
| Phocidae adults | 0.72 | Innes et al., Journal of Animal Ecology 1987 | |
| Herbivorous mammals | 0.728 | Farlow, Ecology 57 (1976) | |
| Terrestrial mammals | 0.73 | Nagy et al., Annual Review of Nutrition 19 (1999) | |
| Alces alces adults | 0.73 | Andersen&Saether, Ecology 73 (1992) | |
| Deposit-feeders | 0.74 | Cammen, Estuaries and Coasts 3 (1980a) | |
| Phocidae juveniles | 0.74 | Innes et al., Journal of Animal Ecology 1987 | |
| Benthic detritivores | 0.742 | Cammen, Oecologia 44 (1980b) | |
| Whales | 0.75 | Hinga, Deep Sea Research 26 A (1979) | |
| Marine amphipods | 0.75 | Dagg, Internationale Revue der Gesamten Hydrobiologie 61 (1976) | |
| Zoo mammals | 0.75 | Evans&Miller, Proceedings of the Nutrition Society 27 (1968) | |
| Cattles | 0.75 | Murray, The Journal of Animal Ecology 60 (1991) | |
| Herbivorous non-ruminant foregut fermenters | 0.76 | Clauss et al., Comparative Biochemistry and Physiology (2007) | |
| Herbivorous mammals | 0.76 | Clauss et al., Comparative Biochemistry and Physiology (2007) | |
| Herbivorous mammals | 0.77 | Clauss et al., Comparative Biochemistry and Physiology (2007) | |
| Zooplankton | 0.77 | Hansen et al., Limnology and Oceanography 42 (1997) | |
| Ungulates | 0.77 | Clauss et al., Comparative Biochemistry and Physiology (2007) | |
| Carnivores | 0.77 | Carbone et al., PLoS Biology 5 2007 | |
| Geese | 0.78 | Durant et al., Journal of Animal Ecology 72 (2003) | |
| Herbivorous colon fermenters | 0.79 | Clauss et al., Comparative Biochemistry and Physiology (2007) | |
| Benthic detritivores | 0.79 | Cammen, Oecologia 44 (1980b) | |
| Crustacea | 0.8 | Conover, Marine Ecology IV (1978) | |
| Carnivorous poikilotherms | 0.82 | Farlow, Ecology 57 (1976) | |
| Periphyton | 0.83 | Cattaneo&Mosseau, Oecologia 103 (1995) | |
| Ciliates | 0.84 | Fenchel, Microbial Ecology 6 (1980) | |
| Fishes | 0.841 | McCann, Ecology 79 (1998) | |
| Larval Fish | 0.843 | MacKenzie et al., Marine Ecology Progress Series 67 (1990) | |
| Ursus americana | 0.86 | Welch et al., Ecology 78 (1997) | |
| Non-mustelid carnivora adult | 0.87 | Innes et al., Journal of Animal Ecology 1987 | |
| Phocidae adults | 0.87 | Innes et al., Journal of Animal Ecology 1987 | |
| Non-mustelid carnivora adult | 0.89 | Innes et al., Journal of Animal Ecology 1987 | |
| Larval Fish | 0.99 | MacKenzie et al., Marine Ecology Progress Series 67 (1990) | |
| Daphnia ambigua | 0.991 | Lynch et al., Limnology and Oceanography 31 (1986) | |
| Pigs | 1 | Wellock et al., Journal of Animal Science 81 (2003) | |
| Odocoileus hemionus | 1 | Hobbs, Wildlife Monographs 101 (1989) | |
| Daphnia parvula | 1.001 | Lynch et al., Limnology and Oceanography 31 (1986) | |
| Finches | 1.02 | Calder&King, Avian Biology IV (1974) | |
| Acartia tonsa | 1.08 | Berggreen, Marine Biology 99 (1988) | |
| Benthic detritivores | 1.115 | Cammen, Oecologia 44 (1980b) | |
| Larval Fish | 1.162 | MacKenzie et al., Marine Ecology Progress Series 67 (1990) | |
| Daphnia pulex | 1.198 | Lynch et al., Limnology and Oceanography 31 (1986) | |
| Daphnia galatea mendotae | 1.243 | Lynch et al., Limnology and Oceanography 31 (1986) |
References
- Abrams and Walters, (1996) Abrams, P. and Walters, C. (1996). Invulnerable prey and the paradox of enrichment. Ecology, 77:1125–1133.
- Banavar et al., (1999) Banavar, J. R., Green, J. L., Harte, J., and Maritan, A. (1999). Finite size scaling in ecology. Physical Review Letters, 83:4212–4214.
- Basset, (1992) Basset, A. (1992). Functional aspects of coexistence relationships in aquatic systems. Atti Società Italiana di Ecologia, 15:177–194.
- Basset and DeAngelis, (2007) Basset, A. and DeAngelis, D. L. (2007). Body size mediated coexistence of consumers competing for resources in space. Oikos, 116:1363–1377.
- Belovsky, (1997) Belovsky, G. E. (1997). Optimal foraging and community structure: The allometry of herbivore food selection and competition. Oecologia, 70:35–52.
- Brown, (1988) Brown, J. (1988). Patch use as an indicator of habitat preference predation risk and competition. Behavioral Ecology and Sociobiology 23 : 27-43, 23:27–43.
- Brown et al., (1994) Brown, J., Kotler, B., and Mitchell, W. (1994). Foraging theory, patch use, and the structure of a negev desert granivore community. Ecology, 75:2286–2300.
- Brown et al., (1988) Brown, J., Kotler, B., Smith, R., and Wirtz, W. (1988). The effects of owl predation on the foraging behavior of heteromyid rodents. Oecologia, 76:408–415.
- Brown et al., (2004) Brown, J. H., Gillooly, J. F., Allen, A. P., Savage, V. M., and West, G. B. (2004). Toward a metabolic theory of ecology. Ecology, 85:1771–1789.
- Carbone and Gittleman, (2002) Carbone, C. and Gittleman, J. (2002). A common rule for the scaling of carnivore density. Science, 295:2273–2276.
- Charnov, (1976) Charnov, E. L. (1976). Optimal foraging, the marginal value theorem. Theorerical Population Biology, 9:129–136.
- Clauset et al., (2009) Clauset, A., Schwab, D., and Redner, S. (2009). How many species have a mass m? American Naturalist, 173:256–263.
- Enquist et al., (2007) Enquist, B. J., Allen, A. P., Brown, J. H., Gillooly, J. F., Kerkhoff, A. J., Niklas, K. J., Price, C. A., and West, G. B. (2007). Biological scaling: Does the exception prove the rule? Nature, 445:E9–E10.
- Glazier, (2005) Glazier, D. S. (2005). Beyond the ’3/4-power law’: variation in the intra- and interspecific scaling of metabolic rate in animals. Biological Review, 80:611–662.
- Glazier, (2010) Glazier, D. S. (2010). A unifying explanation for diverse metabolic scaling in animals and plants. Biological Review, 85:111–138.
- Haskell et al., (2002) Haskell, J. P., Ritchie, M. E., and Olff, H. (2002). Fractal geometry predicts varying body size scaling relationships for mammal and bird home ranges. Nature, 418:527–530.
- Hendriks, (2007) Hendriks, A. J. (2007). The power of size: A meta-analysis reveals consistency of allometric regressions. Ecological Modelling, 205:196–208.
- (18) Holling, C. S. (1959a). The components of predation as revealed by a study of small mammal predation of the european pine sawfly. Canadian Entomologist, 91:293–320.
- (19) Holling, C. S. (1959b). Some characteristics of simple types of predation and parasitism. Canadian Entomologist, 91:385–398.
- Hutchinson, (1959) Hutchinson, G. E. (1959). Homage to santa rosalia or why are there so many kinds of animals? American Naturalist, Vol. 93, No. 870:145–159.
- Kleiber, (1932) Kleiber, M. (1932). Body size and metabolism. Hilgardia, 6:315–353.
- Kotler et al., (2002) Kotler, B., Brown, J., Dall, S., Gresser, S., Ganey, D., and Bouskila, A. (2002). Foraging games between gerbils and their predators: temporal dynamics of resource depletion and apprehension in gerbils. Ecology Research, 4:495–518.
- Kotler et al., (1993) Kotler, B., Brown, J., and Subach, A. (1993). Mechanisms of species coexistence of optimal foragers: temporal partitioning of sand dune gerbils. Oikos, 67:548–556.
- Krebs and Davies, (1997) Krebs, J. R. and Davies, N. D., editors (1997). Behavioural ecology: an evolutionary approach. Blackwell Scientific Publications.
- MacArthur and Levins, (1964) MacArthur, R. H. and Levins, R. (1964). Competition, habitat selection and character displacement in a patchy environment. Proceedings of the National Academy of Sciences USA, 51:1207–1210.
- Makarieva et al., (2004) Makarieva, A. M., Gorshkov, V. G., and Li, B. L. (2004). Body size, energy consumption and allometric scaling: a new dimension in the diversity-stability debate. Ecological Complexity, 1:139–175.
- Marquet et al., (2005) Marquet, P. A., Quiñones, R. A., Abades, S., Labra, F., Tognelli, M., Arim, M., and Rivadeneira, M. (2005). Scaling and power-laws in ecological systems. Journal of Experimental Biology, 208:1749–1769.
- May, (1972) May, R. M. (1972). Limit cycles in predator-prey communities. Science, 177:900–902.
- Mohr et al., (2003) Mohr, K., Vibe-Petersen, S., Jeppesen, L., Bildsoe, M., and Leirs, H. (2003). Foraging of multimammate mice, mastomys natalensis, under different predation pressure: cover, patch-dependent decisions and density-dependent guds. Oikos, 100:459–468.
- Peters, (1983) Peters, R. (1983). The ecological implications of body size. Cambridge Studies in Ecology. Cambridge University Press, New York.
- Reich et al., (2006) Reich, P. B., Tjoelker, M. G., Machado, J. L., and Oleksyn, J. (2006). Universal scaling of respiratory metabolism, size and nitrogen in plants. Nature, 439:457–461.
- Ritchie, (1998) Ritchie, M. E. (1998). Scale-dependent foraging and patch choice in fractal environments. Evolutionary Ecology, 12:309–330.
- Rossi, (1985) Rossi, L. (1985). Interactions between invertebrates and microfungi in freshwater ecosystem. Oikos, 44:175–184.
- Starostová et al., (2009) Starostová, Z., Kubička, L., Konarzewski, M., Kozlowski, J., and Kratochvíl, L. (2009). Cell size but not genome size affects scaling of metabolic rate in eyelid geckos. The American Naturalist, 174:E100–E105.
- Valeila, (1984) Valeila, I. (1984). Marine ecological processes. Springer.
- Werner et al., (1981) Werner, E., Mittelbach, G., and Hall, D. (1981). Foraging and habitat use by the bluegill sunfish. Bioscence, 31:57–58.
- West et al., (1997) West, G. B., Brown, J. H., and Enquist, B. J. (1997). A general model for the origin of allometric scaling laws in biology. Science, 276:122–126.
- White and Seymour, (2005) White, C. R. and Seymour, R. S. (2005). Allometric scaling of mammalian metabolism. Journal of Experimental Biology, 208:1611–1619.
- Wilson et al., (1999) Wilson, W. G., Osenberg, C. W., Schmitt, R. J., and Nisbet, R. M. (1999). Complementary foraging behaviors allow coexistence of two consumers. Ecology, Vol. 80, No. 7:2358–2372.