Evolution of the electronic structure from the insulator to the superconductor in Bi2Sr2-xLax(Ca,Y)Cu2O8+δ
Abstract
La-doped and Y-doped Bi2Sr2CaCu2O8+δ (Bi2212) compounds Bi2Sr2-xLax(Ca,Y)Cu2O8+δ, which range from the insulator to the deeply underdoped superconductor, have been studied by angle-resolved photoemission spectroscopy. We have observed that the lower Hubbard band (LHB) of the parent insulator is gradually shifted upward with doping without significantly changing the band dispersions, which implies a downward shift of the chemical potential with hole doping. This behaviour is analogous to Bi2Sr2-xLaxCuO6+δ (Bi2201) and Ca2-xNaxCuO2Cl2 (Na-CCOC) but is different from La2-xSrxCuO4 (LSCO), where the LHB stays well below the chemical potential and does not move while its intensity quickly diminishes in the underdoped region.
pacs:
74.72.Hs, 79.60.-i, 71.30.+hI INTRODUCTION
The question of how the electronic structure of high- cuprates evolves from the Mott insulator to the superconductor with hole doping is one of the most fundamental and important issues in condensed matter physics. This subject has been extensively investigated experimentally and theoretically, but still remains highly controversial. Previous angle-resolved photoemission spectroscopy (ARPES) studies have revealed two different cases. In underdoped La2-xSrxCuO4 (LSCO), a “two-component” electronic structure has been observed, that is, upon hole doping “in-gap” states appears primarily well (0.4 eV) above the lower Hubbard band (LHB), the chemical potential does not shift and spectral weight is transferred from the LHB to the in-gap states for further hole doping within the underdoped region Ino_twocomponent ; Yoshida_lightly ; Ino_chemipote . Already in the lightly-doped region, a weak quasi-particle (QP) peak crosses the Fermi level () in the (0,0)-() nodal direction and is responsible for the metallic transport Yoshida_lightly . ARPES spectra of underdoped Ca2-xNaxCuO2Cl2 (Na-CCOC) Ronning_onecomponent and Bi2Sr2-xLaxCuO6+δ (Bi2201) Hashimoto , on the other hand, show that upon hole doping the chemical potential moves to the top of the LHB and continues to shift downward for further hole doping.
As for the Bi2Sr2CaCu2O8+δ (Bi2212) family, the apparently smooth evolution of ARPES spectra in the () region in a combined plot of undoped Ca2CuO2Cl2 (CCOC) and underdoped Bi2212 implies that a behaviour similar to Na-CCOC is expected for Bi2212 Ronning . A core-level photoemission study of Bi2212 has indeed shown that the chemical potential is shifted with doping in underdoped samples Harima unlike LSCO. Recently, a momentum distribution curve (MDC) analysis of Bi2201 Hashimoto and underdoped Na-CCOC Kyle have revealed the existence of an additional QP band just above the LHB crossing . Here, strong electron-phonon interaction has been proposed to result in the dressed coherent QP band accompanied by a high-energy incoherent (Frank-Condon type) feature. Yet, the different behavior of the chemical potential shift and the LHB-QP energy separation between LSCO and Na-CCOC or Bi2201 remains to be explained. In order to see what makes those differences between the different families in the evolution of the electronic structure from the Mott insulator to the superconductor, we have performed detailed APRPES measurements of lightly-doped Bi2212.
II EXPERIMENTS
Recently, high-quality crystals of lightly-doped Bi2212 have become available sample_Fujii , which enabled us to study the systematic doping dependence covering from the insulator to the superconductor. In particular, substituting La for the Sr site instead of substituting for the Ca site has made lightly-doped Bi2212 samples metallic () in an analogous way to the lightly-doped LSCO Ando_metallic and YBa2Cu3O7-δ(YBCO) Ando . Single crystals of Bi2Sr2-xLaxCaCu2O8+δ and Bi2Sr2Ca0.8Y0.2Cu2O8+δ were grown by the traveling solvent floating-zone method. X-ray diffraction showed no trace of impurity phases. Details of the sample preparation are given elsewhere sample_Fujii . The hole concentration per Cu atom was determined using the empirical relationship between and the room-temperature thermopower thermopower . All the samples show metallic transport at 300 K, while some of them show insulating behavior () at low temperatures. , , and of the measured samples are listed in Table. 1. Here, is the temperature at which the resistivity reaches the minimum value . The Bi2Sr2Ca0.8Y0.2Cu2O8+δ () sample was superconducting and above .
ARPES measurements were carried out at beamline 5-4 of Stanford Synchrotron Radiation Laboratory (SSRL). Incident photons had an energy of eV. A SCIENTA SES-200 analyzer was used in the angle mode with the total energy and momentum resolution of 14 meV and , respectively. Samples were cleaved in situ under an ultrahigh vacuum of Torr, and measured at K. The position of the Fermi level was calibrated with gold spectra.
III RESULTS AND DISCUSSION
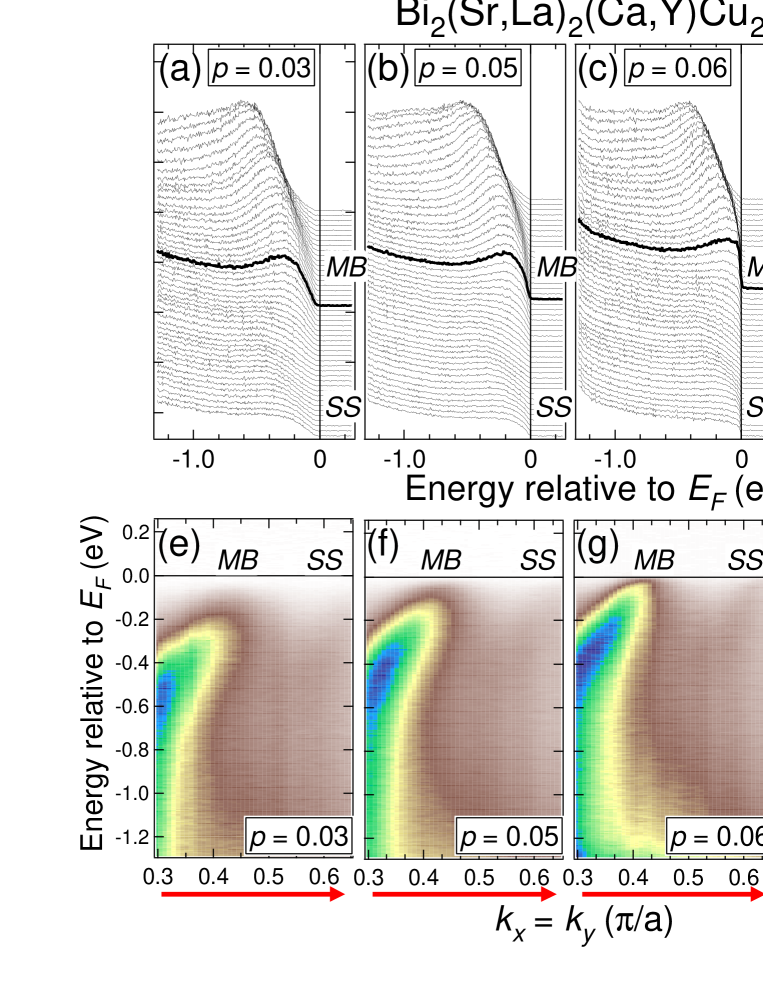
Figure 1(a)-(d) shows energy distribution curves (EDCs) along the diagonal k=- direction (nodal direction) in the second Brillouin zone (BZ). The intensity maps in - space shown in Figs 1(e)-(h) reveal the peak dispersion. First, the spectra for = show a single dispersive peak marked by “MB (main band)” plus a diffraction replica marked by “SS” due to the Bi-O plane superstructure. This peak disperses closest to around (), and can be considered as a remnant of the LHB or more precisely of the Zhang-Rice singlet band. With hole doping , the dispersive peak as a whole moves upward until an obvious crossing in the nodal direction occurs for , where the system becomes superconducting. This is contrasted with spectra of LSCO with similar doping levels, where the LHB stays away ( eV) from but a sharp QP peak crossing is visible already for Yoshida_lightly due to the presence of two separate spectral features, namely, the LHB and the QP crossing .
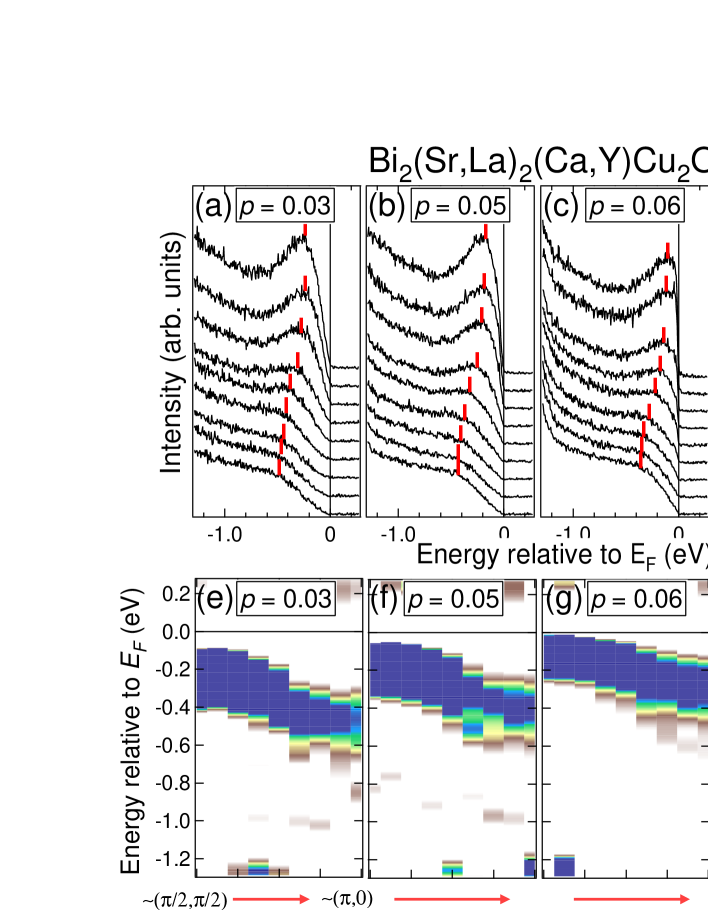
Figure 2(a)-(d) shows the ARPES spectra along the “underlying” Fermi surface Ronning . Here, by the “underlying” Fermi surface is meant the minimum-gap locus including the pseudogap region around k as reported for underdoped Bi2212 Ding . The figure again shows a single dispersive feature that moves upward with hole doping . This is also contrasted with the case of LSCO where the LHB stays eV below , where the QP crosses, leading to the “two-component” behavior, in particular around () Ando . While a dispersive peak which crosses occurs in the - nodal direction (for 0.075), no crossing occurs and a finite (pseudo)gap persists around k(). The second derivatives of the spectra shown in Fig. 2(e)-(h) indicate the dispersion along the underlying Fermi surface.
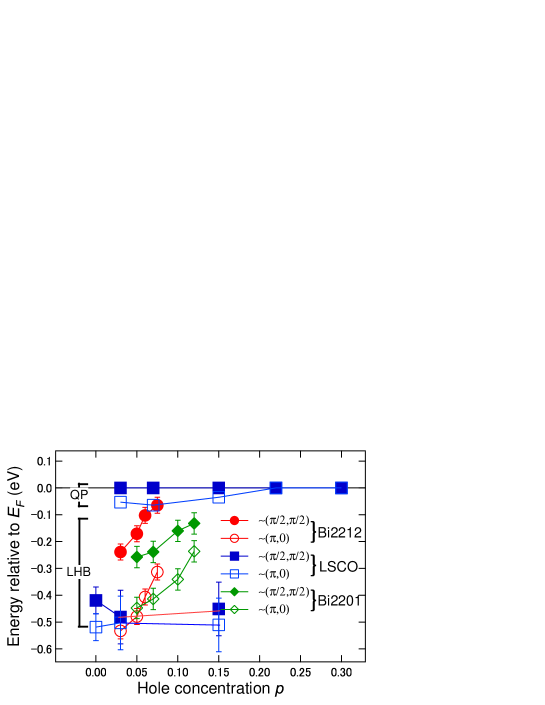
In Fig. 3, we have plotted the doping dependence of the peak positions in EDCs on the (underlying) Fermi surface at () and those at () thus determined by taking the second derivatives. One can see that in Bi2212, the peak positions at () and () show nearly parallel shifts with doping in the lightly-doped region, again indicating a rigid-band-like shift of the LHB similar to the case of Na-CCOC Kyle and Bi2201 Hashimoto . In the same figure, we have plotted the doping dependence of the peak position at () and () in LSCO determined in the same way Yoshida . In LSCO a sharp QP feature appears near already at and stays there while the LHB is located at eV. The amount of the shift of each feature is much smaller in LSCO than that in Bi2212 and Na-CCOC.
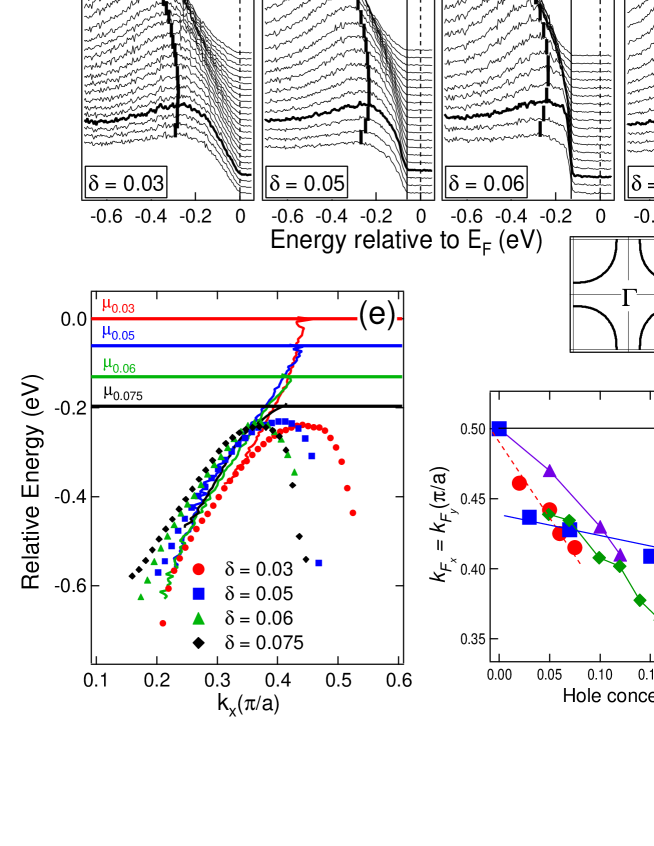
To reveal further details of the evolution of the electronic structure near , EDCs along - of lightly-doped Bi2212 are plotted on an expanded scale in Fig. 4(a)-(d) with the peak positions determined by the second derivatives of the EDCs. Figure 4(e) shows the dispersion of the EDC peak (representing that of the LHB) along the (0,0)-() direction. In addition, we have plotted the dispersion of the “QP band” which has been determined by the momentum distribution curve (MDC) analysis, as performed for Bi2201 Hashimoto and Na-CCOC Kyle . Although there is no sharp peak crossing in the EDCs of the =0.03 and 0.05 samples, the peak in the MDCs shows a clear dispersion crossing , as shown in Fig. 4(e). Here, the results for each composition have been shifted so that the LHB positions coincide. One can see that the chemical potential thus obtained is shifted downward relative to the LHB with hole doping. One can also see that the valence-band maximum (VBM) of the LHB is shifted in -space from () toward (0,0) with hole doping. Remarkably, the QP band stays almost at the same position in the - space in this plot and the crossing point, namely, in the nodal direction is shifted toward (0,0) following the downward chemical potential with hole doping. From Figs. 1-4 one can conclude that the lightly-doped Bi2212 shows a rigid-band-like shift of the LHB (except for the small shift toward k()) and the nodal QP just above the LHB, analogous to the case of Bi2201 and Na-CCOC. This behavior is different from LSCO, where the LHB stays almost at the same energy and the clear QP band is seen well ( eV) above the LHB.
In the antiferromagnetic (AF) insulating state of the undoped compound, the maximum of the LHB along the nodal direction should occur on the AF zone boundary, that is, exactly at () due to the folding of the BZ in the AF state. Without the long-range order, on the other hand, can in principle take any value. Therefore, it is interesting to see how the evolves as a function of . In order to see this, we have plotted in Fig. 4(f) the doping dependence of the position determined from the MDC peak position at as a function of . One can see from the figure that the LHB in lightly-doped Bi2212 indeed moves toward () with decreasing hole concentration. The results for Na-CCOC (=0, 0.05, 0.1, 0.12) also showed the same behavior Kyle . On the other hand, in LSCO extrapolates to and not to () until 0.03. (For undoped La2CuO4, a tiny amount of holes are doped due to excess oxygens and faint spectral weight appears at ()). This can be understood as due to the separated features of the LHB and the QP band crossing in LSCO. This observation again points to the similarity between Bi2212, Bi2201 and Na-CCOC concerning the evolution of the electronic structure.
From the present data, one can also obtain an important implication for the doping dependence of spectra across the insulator-superconductor transition (between =0.06 and 0.075) in Bi2212. Nodal spectra in the superconducting phase (=0.075) have a sharp QP peak around without a gap, whereas nodal spectra in the insulating phase (=0.06) have finite shoulder-like spectral weight (weak and broad QP peak) around with a meV leading-edge gap. It therefore appears that the system shows superconductivity when the nodal spectra show a sharp QP peak crossing . This behavior is consistent with the recently proposed two-gap scenario twogap ; Hashimoto_LSCO that superconductivity occurs in the nodal region in underdoped samples. Our observation indeed implies a close relationship between the occurrence of superconductivity and the existence of QP peak around the node. Here, it should be noted again that one can observe a nodal QP peak already for in the insulating LSCO. Thus, it seems that the doping evolution of the electronic structure is whether a QP feature appears near well above the LHB before a significant chemical potential shift occurs or not. So far, LSCO has been the only example that shows the appearance of a QP band before the chemical potential starts to shift in the lightly-doped region. It is an important question to ask which makes this difference between the different families of cuprates. It has been pointed out that the major difference in the electronic structure of the CuO2 plane between LSCO and Bi2212 lies in the magnitude of the next-nearest-neighbor hopping within the single band description of the CuO2 plane t'_BSCCO ; t'_Pavarini . The magnitude of is expected to decrease with influence of the apical oxygen on the CuO2 plane Andersen , and therefore LSCO, which has the shortest Cu-apical oxygen distance among these cuprate families, is expected to have the smallest . According to the --- model calculation, a larger energy shift of the chemical potential with hole doping in the underdoped region has been predicted for larger Tohyama , consistent with our observation that Bi2212 and Na-CCOC showed faster chemical potential shift than LSCO.
Recently, the new interpretation of the ARPES line shapes of undoped and lightly-doped cuprates in Na-CCOC and LSCO was proposed Kyle ; Gunnarsson ; Mishchenko , which took into account polaronic effects because arising from strong electron-phonon coupling. The broad hump structure was successfully explained by polaronic effects. The similarity of the spectral lineshape between lightly-doped Bi2212 and Na-CCOC indicates that the polaronic scenario can also be applied to Bi2212, too. Moreover, theoretical works reported that the phase separation, which occurs with suitable electron-phonon coupling strength Capone , successfully explained the doping evolution of the electronic structure of underdoped LSCO, namely, the “two-component” behavior phase_separation . The calculation also predicted that phase separation would be suppressed when the electron-phonon coupling becomes stronger and the system shows polaronic insulating state Capone . This implies that Bi2212, Bi2201 and Na-CCOC have larger electron-phonon interaction than LSCO and the different strength of electron-phonon coupling makes different doping evolution of the electronic structure in the different families of cuprates.
IV SUMMARY
We have observed the evolution of the electronic structure with hole doping in lightly-doped Bi2212 from the insulator (with high-temperature metallic behavior) to the superconductor. The results show rigid-band-like shifts of (the remnant of) the LHB with hole doping. The chemical potential is shifted downward and a QP feature appears around just above the LHB. This evolution of the electronic structure, together with the shift of the momentum position of the maximum of the LHB, are similar to those reported for Bi2201 and Na-CCOC but are different from LSCO. In order to establish whether the different ’s and different strength of electron-phonon coupling are responsible for the different doping evolution of LSCO and Bi2212, systematic studies on other cuprate families as well as further theoretical studies are desired.
V ACKNOWLEDGMENTS
We acknowledge technical help by N. P. Armitage. This work was supported by a grant-in-Aid for Scientific Research in Priority Area “Invention of Anomalous Quantum Materials” (16076208) from MEXT, Japan. SSRL is operated by the DOE Office of Basic Energy Science Divisions of Chemical Sciences and Material Sciences.
References
- (1) A. Ino, C. Kim, M. Nakamura, T. Yoshida, T. Mizokawa, Z.-X. Shen, A. Fujimori, T. Kakeshita, H. Eisaki, and S. Uchida, Phys. Rev. B 62, 4137 (2000).
- (2) T. Yoshida, X.J. Zhou, T. Sasagawa, W.L. Yang, P.V. Bogdanov, A. Lanzara, Z. Hussain, T. Mizokawa, A. Fujimori, H. Eisaki, Z.-X. Shen, T. Kakeshita, and S. Uchida, Phys. Rev. Lett. 91, 027001 (2003).
- (3) A. Ino, T. Mizokawa, A. Fujimori, K. Tamasaku, H. Eisaki, S. Uchida, T. Kimura, T. Sasagawa, and K. Kishio, Phys. Rev. Lett. 79, 2101 (1997).
- (4) F. Ronning, T. Sasagawa, Y. Kohsaka, K.M. Shen, A. Damascelli, C. Kim, T. Yoshida, N.P. Armitage, D.H. Lu, D.L. Feng, L.L. Miller, H. Takagi, and Z.-X. Shen, Phys. Rev. B 67, 165101 (2003).
- (5) M. Hashimoto, T. Yoshida, H. Yagi, M. Takizawa, A. Fujimori, M. Kubota, K. Ono, K. Tanaka, D.H. Lu, Z.-X. Shen, S. Ono, and Yoichi Ando, Phys. Rev. B 77, 094516 (2008).
- (6) F. Ronning, C. Kim, D.L. Feng, D.S. Marshall, A.G. Loeser, L.L. Miller, J.N. Eckstein, I. Bozovic, and Z.-X. Shen, Science 282, 2067 (1998).
- (7) N. Harima, A. Fujimori, T. Sugaya, and I. Terasaki, Phys. Rev. B 67, 172501 (2003).
- (8) K.M. Shen, F. Ronning, D.H. Lu, W.S. Lee, W. Meevasana, N.J.C. Ingle, A. Damascelli, N.P. Armitage, Z.-X. Shen, L.L. Miller, Y. Kohsaka, and H. Takagi, Phys. Rev. Lett. 93, 267002 (2004).
- (9) T. Fujii and I. Terasaki, Physica C 392-396, 238 (2003).
- (10) Y. Ando, A.N. Lavrov, S. Komiya, K Segawa, and X.F. Sun, Phys. Rev. Lett. 87, 017001 (2001).
- (11) Y. Ando, A.N. Lavrov, and K. Segawa, Phys. Rev. Lett. 83, 2813 (1999).
- (12) S.D. Obertelli, J.R. Cooper, and J.L. Tallon, Phys. Rev. B 46, 14928 (1992).
- (13) H. Ding, M.R. Norman, T. Yokoya, T. Takeuchi, M. Randeria, J.C. Campuzano, T. Takahashi, T. Mochiku, and K. Kadowaki, Phys. Rev. Lett. 78, 2628 (1997).
- (14) A. Ino, C. Kim, M. Nakamura, T. Yoshida, T. Mizokawa, A. Fujimori, Z.-X. Shen, T. Kakeshita, H. Eisaki, and S. Uchida, Phys. Rev. B 65, 094504 (2002).; T. Yoshida, X.J. Zhou, K. Tanaka, W.L. Yang, Z. Hussain, Z.-X. Shen, A. Fujimori, S. Sahrakorpi, M. Lindroos, R.S. Markiewicz, A. Bansil, Seiki Komiya, Yoichi Ando, H. Eisaki, T. Kakeshita, and S. Uchida, Phys. Rev. B 74, 224510 (2006).
- (15) D.L. Feng, D.H. Lu, K.M. Shen, C. Kim, H. Eisaki, A. Damascelli, R. Yoshizaki, J.-i. Shimoyama, K. Kishio, G.D. Gu, S. Oh, A. Andrus, J. O’Donnell, J.N. Eckstein, and Z.-X. Shen, Science 289, 277 (2000).
- (16) K. Tanaka, W.S. Lee, D.H. Lu, A. Fujimori, T. Fujii, Risdiana, I. Terasaki, D.J. Scalapino, T.P. Devereaux, Z. Hussain, and Z.-X. Shen, Science 314, 1910 (2006).
- (17) M. Hashimoto, T. Yoshida, K. Tanaka, A. Fujimori, M. Okusawa, S. Wakimoto, K. Yamada, T. Kakeshita, H. Eisaki and S. Uchida, Phys. Rev. B 75, 140503 (2007).
- (18) K. Tanaka, T. Yoshida, A. Fujimori, D.H. Lu, Z.-X. Shen, X.-J. Zhou, H. Eisaki, Z. Hussain, S. Uchida, Y. Aiura, K. Ono, T. Sugaya, T. Mizuno, and I. Terasaki, Phys. Rev. B 70, 092503 (2004).; C.T. Shih, T.K. Lee, R. Eder, C.-Y. Mou, and Y.C. Chen, Phys. Rev. Lett. 92, 227002 (2004).
- (19) E. Pavarini, I. Dasgupta, T. Saha-Dasgupta, O Jepsen, and O.K. Andersen, Phys. Rev. Lett. 87, 047003 (2001).
- (20) E. Pavarini, I. Dasgupta, T. Saha-Dasgupta, O Jepsen, and O.K. Andersen, Phys. Rev. Lett. 87, 047003 (2001).
- (21) T. Tohyama and S. Maekawa, Phys. Rev. B 67, 092509 (2003).
- (22) O. Rösch, O. Gunnarsson, X.J. Zhou, T. Yoshida, T. Sasagawa, A. Fujimori, Z. Hussain, Z.-X. Shen, and S. Uchida, Phys. Rev. Lett. 95, 227002 (2005).
- (23) A.S. Mishchenko and N. Nagaosa, Phys. Rev. Lett. 93, 036402 (2004).
- (24) M. Capone, G. Sangiovanni, C. Castellani, C. Di Castro, and M. Grilli, Phys. Rev. Lett. 92, 106401 (2004).
- (25) M. Mayr, G. Alvarez, A. Moreo, and E. Dagotto, Phys. Rev. B 73, 014509 (2006). G. Alvarez, M. Mayr, A. Moreo, E. Dagotto, Phys. Rev. B 71, 014514 (2005).
| Bi2Sr2-xLaxCaCu2O8+δ | (K) | (K) | (mcm) | |
|---|---|---|---|---|
| 0.03 | - | 150 | 5 | |
| 0.05 | - | 130 | 3.2 | |
| 0.06 | - | - | - | |
| Bi2Sr2Ca0.8Y0.2Cu2O8+δ | 0.075 | 30 | - | - |