The Arecibo L-band Feed Array Zone of Avoidance Survey I:
Precursor Observations through the Inner and Outer Galaxy
Abstract
The Arecibo L-band Feed Array (ALFA) is being used to conduct a low-Galactic latitude survey, to map the distribution of galaxies and large-scale structures behind the Milky Way through detection of galaxies’ neutral hydrogen (HI) 21-cm emission. This Zone of Avoidance (ZOA) survey finds new HI galaxies which lie hidden behind the Milky Way, and also provides redshifts for partially-obscured galaxies known at other wavelengths. Before the commencement of the full survey, two low-latitude precursor regions were observed, totalling 138 square degrees, with 72 HI galaxies detected. Detections through the inner Galaxy generally have no cataloged counterparts in any other waveband, due to the heavy extinction and stellar confusion. Detections through the outer Galaxy are more likely to have 2MASS counterparts. We present the results of these precursor observations, including a catalog of the detected galaxies, with their HI parameters. The survey sensitivity is well described by a flux- and linewidth-dependent signal-to-noise ratio of 6.5. ALFA ZOA galaxies which also have HI measurements in the literature show good agreement between our measurements and previous work. The inner Galaxy precursor region was chosen to overlap the HI Parkes Zone of Avoidance Survey so ALFA performance could be quickly assessed. The outer Galaxy precursor region lies north of the Parkes sky. Low-latitude large-scale structure in this region is revealed, including an overdensity of galaxies near and between 5000 - 6000 km s-1 in the ZOA. The full ALFA ZOA survey will be conducted in two phases: a shallow survey using the observing techniques of the precursor observations, and also a deep phase with much longer integration time, with thousands of galaxies predicted for the final catalog.
1 Introduction
The obscuration due to dust and the high stellar density in our Galaxy varies from place to place within the Milky Way. Overall, it blocks 20% of the extragalactic Universe at optical wavelengths and a smaller fraction of the sky at infrared wavelengths. This “Zone of Avoidance” (ZOA) was recognized even before the nature of the spiral nebulae was understood. This sky coverage limitation does not pose a problem for the study of galaxies themselves, as there is no reason to believe that the population of obscured galaxies should differ from those in optically unobscured regions. Yet, an accurate knowledge of the mass distribution within our neighborhood is essential if we are to understand the dynamical evolution of the Local Group from kinematic studies (e.g., Peebles et al. 2001). In addition, the discovery of previously unknown nearby galaxies will further efforts to understand the local velocity field (see Kraan-Korteweg 1986 and Karachentsev et al. 2002). Mapping more distant hidden galaxies allows us to explore the connectivity of large-scale structure across the Galactic plane.
The ZOA has been successfully narrowed by deep searches in the optical and infrared, but both fail in regions of high extinction and stellar confusion. However, galaxies which contain HI can be found everywhere, including regions of thickest obscuration, and worst IR confusion. In the northern hemisphere, the ZOA within 5 degrees of the Galactic plane has been searched at 21 cm, but only at the high noise level of 40 mJy beam-1 (with velocity resolution of 4 km s-1 ), sensitive only to nearby, massive objects [The Dwingeloo Obscured Galaxies Survey: 43 galaxies uncovered (Henning et al. 1998; Rivers 2000)]. More recently, the HI Parkes Zone of Avoidance Survey (HIZOA) covered Dec = to at 6 mJy beam-1 rms (with velocity resolution of 27 km s-1 ), and detected about one thousand galaxies (Donley et al. 2005; Henning et al. 2000, Henning et al. 2005 Kraan-Korteweg et al. 2005).
With the installation of the Arecibo L-band Feed Array (ALFA), we now have the opportunity to map local large scale structure in HI in the ZOA, within the declination limits of the 305-m Arecibo Radio Telescope111The Arecibo Observatory is part of the National Astronomy and Ionosphere Center, which is operated by Cornell University under a cooperative agreement with the National Science Foundation.. Because many observational targets for pulsar and Galactic HI observers are found at low Galactic latitude, we have begun a program of “commensal” (meaning simultaneous) observations with Galactic HI and pulsar observers. Commensal observing, using multiple backends simultaneously, makes efficient use of observing hours, which is particularly important during the highly oversubscribed Galactic time.
The project being described here, “ALFA ZOA”, is the combination of two different commensal observing projects: (1) a map of the Arecibo sky at , (Inner Galaxy region) with a backend designed for detecting extragalactic HI that will be used in conjunction with a backend for observing Galactic HI and one for observing GHz radio continuum emission; and (2) a deeper map of the Arecibo sky at beginning in the Inner Galaxy region with a backend designed to detect extragalactic HI in conjunction with a spectrometer used for observing pulsars. The extragalactic data from this second survey will also be used to search for Galactic radio recombination lines. Both of these projects will reach farther north than HIZOA, and will provide higher spatial and velocity resolution than the HIZOA survey. The second survey will also provide higher sensitivity than HIZOA.
ALFA ZOA is complementary to the three other extragalactic blind surveys that are currently underway at Arecibo: (1) the Arecibo Legacy Fast ALFA Survey (ALFALFA, e.g. Giovanelli et al. 2005) which is a large area but relatively shallow survey, (2) the Arecibo Galaxy Environments Survey (AGES, e.g. Auld et al. 2006) a medium-deep survey, and (3) the ALFA Ultra Deep Survey (AUDS, Freudling et al. 2005) a very deep survey with small sky coverage.
The full ALFA ZOA survey has begun, and will take several years to complete. We present a description of the ALFA ZOA survey and the results of ZOA precursor observations that were taken commensally with two smaller Galactic HI projects. The first project covered 38 square degrees near , and the other covered 100 square degrees near .
We offer a description of the ALFA ZOA survey, and then present the observational results from the precursor observations.
In § 2, we motivate the ALFA ZOA survey. In § 3, we describe the early precursor observations. In § 4, we describe the data reduction, galaxy recognition and parametrization, and selection function. § 5 contains an overview of the detected galaxies, their HI parameters and any counterparts at other wavelengths, and discusses the inner and outer Galaxy results. § 6 describes the outlook for the full ALFA ZOA survey.
2 The ALFA Zone of Avoidance Survey
ALFA ZOA is one of several extragalactic HI surveys being undertaken with ALFA. The emphasis of this project is to trace the local large-scale structure in optically-obscured regions of the sky, and to better understand the local velocity field. This project will also make important contributions to studies of the HI properties of galaxies in different environments, as there are a number of interesting large-scale structures which lie at low-Galactic latitude which will be surveyed in HI. The deep phase of the survey will be deeper than ALFALFA, and will cover a broader contiguous area of the sky than AGES at similar depth. The catalog will be used to construct an HI mass function over a large wedge of space, and to study the HI properties of galaxies in the various environments within the survey volume.
2.1 Large Scale Structure and the Local Velocity Field
Due to the declination limitations of the Arecibo Radio Telescope, there are two separate regions of the ZOA which we can map: the inner Galaxy, , and the outer Galaxy, . Known galaxies from the Lyon-Meudon Extragalactic Database (LEDA) and HIZOA in both of the accessible regions are plotted in the top panels of Figure 1. Optical surveys are compromised at mag, and are very ineffective where the extinction reaches 3 mag, as the correspondence of galaxy surface density with extinction shows (Fig 1 bottom). Further, particularly in the inner Galaxy, the near-infrared Two Micron All Sky Survey (2MASS, eg. Skrutskie et al. 2006), less affected by dust extinction than are optical surveys, is still defeated by the high Galactic stellar surface density of the bulge. Still, we do know something about the large-scale structures we will probe in this volume from galaxy distributions above and below the plane.
In the inner Galaxy ZOA region the ZOA intersects the Delphinus void (center v, km s-1 ; Fairall 1998 used for this and all following void locations). Also lying in the inner Galaxy ZOA is a portion of a smooth “sine-wave” shaped feature that can be traced across the whole southern sky (Kraan-Korteweg, Koribalski, & Juraszek 1999). This long, sinuous galaxy overdensity disappears into the ZOA at . The HIZOA survey indicates a possible border at between the Microscopium void ( v , 4500 km s-1 ) and the Cygnus void ( v , 3500 km s-1 ). This area will be covered by the ALFA ZOA full survey. At high velocities, very little is known about the large-scale structure in the area due to the heavy obscuration. This seems to be a generally empty region of the sky, judging from optical and IR galaxy counts, but it’s not clear if this is real. The 21 cm mapping will address this, since it is unaffected by dust and high stellar density.
In the outer Galaxy ZOA, the area to be probed includes the Gemini void (, b, v = 172∘, 9∘, 3000 km s-1) and Monoceros filament, a mass overdensity at low redshift, extending into the Arecibo sky at (Henning et al. 2005, Kraan-Korteweg et al. 2005). Also covered will be the Orion void (, b, v = 206∘, -2∘, 1500 km s-1), interesting because of two low velocity galaxies within its putative borders discovered with HIZOA, suggesting that it may not be a void at all. At higher velocities the Gemini void may continue - ALFA ZOA should determine this clearly. We will probe part of the Canis Major void (, b, v = 229∘, -13∘, 5000 km s-1; Donley et al. (2005) suggest its center may lie at , b = 220∘, 0∘.) The portion of the Pisces-Perseus chain which may connect to A569 (, b, v = 168∘, 23∘, 5900; Fairall 1998), as surmised by Pantoja et al. (1997) will be probed where it lies behind the Milky Way. In both the inner and outer Galaxy ZOA regions, ALFA ZOA will almost certainly uncover previously-unrecognized structures, as did its predecessor HIZOA.
In addition to improving our understanding of the local galaxy density field, ALFA ZOA will also help to improve our understanding of the local galaxy velocity field, and correspondingly, the local matter density field. Because the number of galaxies with known redshifts greatly exceeds the number of galaxies with redshift-independent distance indicators, several authors have attempted to reconstruct the velocity and matter density fields of the local universe using redshifts alone, operating under the assumption that the matter density field is related to the galaxy density field by some assumed biasing relation (e.g., Branchini et al. 1999, Erdogdu et al. 2006). However, because most galaxy surveys do not extend to low Galactic latitudes, we are missing an important part of the local velocity/density field. Even the near infrared, less affected by dust obscuration than the optical, retains a ZOA. In reconstructing density and velocity fields from the 2MASS Redshift Survey (Huchra et al. 2005), Erdogdu et al. (2006) are forced to deal in a statistical way with missing data in the ZOA, defined broadly to be within , but flaring significantly toward the Galactic Center.
3 Precursor Observations
Before the start of the multi-year survey, we conducted smaller ”precursor” observations, to develop optimal observing and reduction techniques. Observations were conducted using ALFA222http://www.naic.edu/alfa/ on the 305-m radio telescope located at Arecibo, Puerto Rico. The ALFA receiver has 7 independent beams, each with two orthogonal linear polarizations. The six outer beams are arranged in a hexagonal pattern around the central beam. At 1.4 GHz, the mean system temperature is 30K, and the mean half-power beam is 3.4 arcmin, with the outer beams more elliptical in shape than the symmetric central beam (see Fig. 3 of Auld et al. 2006). For more detailed information on ALFA, see Giovanelli et al. (2005). Two regions of sky straddling the Galactic plane were observed during these precursor observations. A 38-square degree area near was observed in June/July 2005 and May 2006. A 100-square degree region near was observed in October 2005. (Fig 1 shows search boundaries). A third region behind the Taurus molecular cloud was also observed using a similar mode, though with shorter effective integration time, and during the day. Results from this area are presented by Lamm et al. (2007), and in a forthcoming paper.
3.1 Observing Mode
The observations described in this paper were conducted simultaneously with GALFA surveys of Galactic HI (Stanimirovic et al. 2006). While the typical observing mode for extragalactic ALFA surveys is drift scanning, the observations described here were done in “nodding” mode. In this mode, the receiver either stays on the meridian and nods up and down in zenith angle, or is positioned at non-zero hour angle, and moves back and forth in azimuth (the latter technique is used only near declination , near the zenith, where nodding on the meridian will not work, due to technical limitations of the telescope). As the receiver nods and the Earth turns, the telescope traces a zigzag pattern on the sky as viewed in RA-Dec. The rotation angle of ALFA is selected to keep the separation between beams constant during the scans, with beam spacing of 1.8 arcmin orthogonal to the scan direction. Each subsequent day’s scanning begins at different LST, such that the spacing between the edge beams of adjacent scans is the same as that between beams in the same scan.
Because different days’ scans cross each other, each position on the sky is observed twice, separated by at least 24 hours. The repeated observations are used to improve the RFI rejection in the data. The motion of the receiver and the overlapping observations lead to an effective integration time of 8 seconds per beam. Calibration is handled by firing a high-temperature noise diode at the beginning of each scan, and at its halfway point.
3.2 Backend
While scanning, spectra were recorded every second using the Wide-band Arecibo Pulsar Processors (WAPPs) as the back-end signal processors. The WAPPs were configured to cover 100 MHz bandwidth centered at 1383 MHz. With rolloff in sensitivity at the bandpass extremes, the useful search range was -1000 km s-1 to 17,750 km s-1 . The 100 MHz band was divided into 4096 channels, producing a channel spacing of 24 kHz, or 5 km s-1 in the HI line. Because of the constant presence of the strong, narrow Galactic HI signal at zero velocity, which causes ringing in the spectra, Hanning smoothing was applied in the first stage of data reduction, increasing the velocity resolution by a factor of two, to 10 km s-1 .

4 Data Reduction
The spectral data were bandpass corrected, Hanning smoothed, and Doppler-corrected using the AIPS++ package LiveData, originally developed for the Parkes multibeam surveys (Barnes et al. 2001), with small modifications to accept the Arecibo CIMAFITS format. For each beam and polarization, a median bandpass calculated from the scan was removed. The relative gains of the ALFA beams (both polarizations) were taken into account at this stage. Also at this stage, the system temperature calibration was applied. The calibrated spectral data, weighted according to the beam shape and normalized by the beam response, were then gridded into cubes with a pixel size of 1 arcmin. Each output pixel is the median of spectra that lie within 1.5 arcmin of the center of the pixel. This step effectively removes outliers, an efficient method of mitigating transient RFI. Sources of RFI which are not transient in time remain in the data, in particular, several channels surrounding 7900 km s-1 and 15,600 km s-1 were ruined by almost constant RFI (L3 GPS and FAA radar, respectively). The velocity range occupied by Galactic HI is within -100 to 100 km s-1 , with dependence on Galactic longitude. High Velocity Clouds are also seen in the data, with large complexes reaching to km s-1 . These will be the subject of a forthcoming paper. Away from these velocities, and also away from the small region affected by the Crab Nebula the resulting rms for the survey was 5.5 - 6 mJy per beam. Full details of the bandpass estimation and gridding into datacubes is given by Barnes et al. (2001).
4.1 Search Method and Profile Parametrization
Each three-dimensional (RA-Dec-Vel) datacube was visually inspected over the entire usable velocity range by three independent searchers, using the visualization tool Karma KVIS (Gooch 1996). While high-latitude HI surveys, such as the HI Parkes All Sky Survey, have used automatic galaxy detection algorithms to produce galaxy candidate lists, we have found that the more complicated ZOA produces an unmanageable number of false detections due to increased continuum emission at low-Galactic latitude, and that the human eye-brain system is still far superior for finding galaxies and rejecting spurious signals. Lists of galaxy candidates were compiled independently by each searcher. Galaxy catalogs in the literature were not consulted at this stage, to ensure a uniformly HI-selected sample, and not some complicated function of HI properties and existing observations at other wavelengths. When all three searchers agreed, a candidate was accepted. In rare cases, when fewer than three searchers had noted a candidate, positions were re-examined, and sources with at least fives times the local rms noise over two or more channels were accepted, if their profile shapes were consistent with known HI objects, e.g. two-horned, flat-topped, Gaussian, or a combination.
The coordinates and HI parameters of each galaxy were then measured using the MIRIAD (Sault et al. 1995) task MBSPECT. MBSPECT fits the coordinates (centroid) of the HI emission, and then provides a weighted sum of the emission in each velocity plane to create a spectral profile. Visually inspecting each profile to determine a line-free range, a polynomial (typically a first, second, or third order polynomial, depending on the baseline shape) is fit to the baseline region, and then subtracted from the spectrum. The total flux is integrated across the line profile in the baseline-subtracted spectrum, and the widths are computed at 20% and 50% of the peak flux level, using the “width maximizing” technique of finding the outwardmost channels on either side of the profile with fluxes greater than 20% and 50% of the peak flux level respectively. The systemic velocity of the galaxy is calculated to be the midpoint of the profile at the 50% level. All of the galaxies are spatially unresolved by the 3.4 arcmin beam, with the exception of J1901+0651, with 5-6 arcmin extent.
4.2 A Posteriori Selection Function
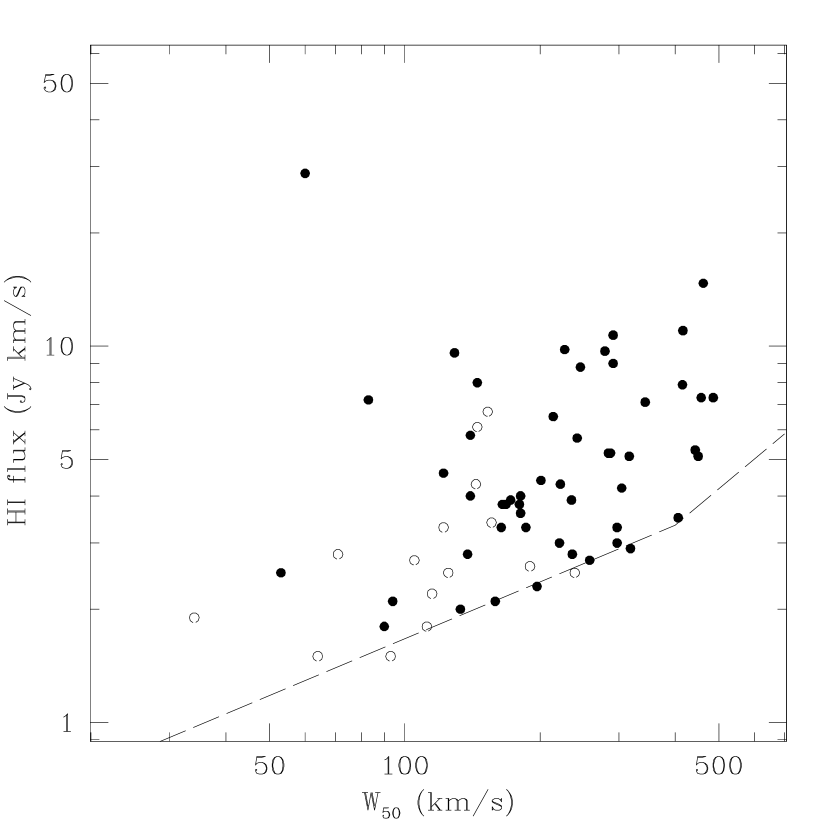
Because the datacubes were searched visually, there was no hardwired selection function, such as would be the case with an automatic galaxy-finding algorithm. In order to compare the ALFA ZOA selection function directly to other ALFA blind surveys, namely ALFALFA and AGES, we show in Figure 2 the detected galaxies’ HI flux densities versus their linewidths. The dotted line is not a fit to the data envelope, but rather shows a flux and linewidth dependent signal-to-noise ratio of 6.5 (following Saintonge (2007) and Cortese et al. (2008))
where w is either W50/ for linewidths less than 400 km s-1 , or 400/ for linewidths of 400 km s-1 or greater, where is the velocity resolution of the survey. (As noted by Saintonge (2007), 400 km s-1 marks the velocity width at which typical spectral baseline fluctuations become comparable to the width of the galaxy profile). For this survey, the velocity resolution is 10 km s-1 , and the rms is taken as the representative value of 5.75 mJy. As for ALFALFA and AGES, this linewidth and flux density dependent signal-to-noise threshold of 6.5 delineates the selection threshold quite well.
5 Overview of Galaxies Detected
5.1 HI Parameters
In the two low-latitude precursor regions observed, a total of 72 galaxies were detected: in the inner Galaxy region (38 square deg), and in the outer Galaxy region (100 square deg). Table 1 presents the HI parameters for these ALFA detections, with columns containing the following information:
Column (1).—Source name;
Columns (2) and (3).—Right ascension and declination (J2000.0) of the fitted position;
Columns (4) and (5).—Galactic latitude and longitude of the fitted position;
Column (6).—The HI flux integral;
Column (7).—The heliocentric velocity (cz) taken as the midpoint of the profile at the 50% level;
Columns (8) and (9).—The full velocity width of the HI line measured at the 50% and 20% levels respectively;
Column (10).—Distance to the galaxy, correcting the velocity to the Local Group frame:
and taking H0 = 71 km s-1 Mpc-1;
Column (11).—Logarithm of the HI mass.
The uncertainties on FHI, Vhel, W50, and W20 were calculated following the discussion in Koribalski et al. (2004). The error on the HI flux integral is
where is the peak flux, SN is the signal to noise ratio to , is the integrated flux, and is the velocity resolution of the data, 10 km/s. is the error in the peak flux
The uncertainty in the systemic velocity is
with
is a measure of the steepness of the profile edges. The uncertainties in the linewidths are given by
The uncertainties in the HI masses are derived from the uncertainties in the HI flux integrals.
Included in this table of 72 sources are six galaxies which are clearly detected, but whose signals lie on the edge of the survey region. They are assigned ALFA ZOA names, but since some 21-cm flux is missing, their positions, flux densities, and heliocentric velocities are indicative only (and marked with “:” in Table 1) and no further quantities are derived. Figure 3 presents the HI 21-cm spectra of the 66 galaxies with secure HI measurements.
| ALFAZOA | RA | Dec | l | b | FHI | Vhel | W50 | W20 | DLG | log MHI |
|---|---|---|---|---|---|---|---|---|---|---|
| (J2000.0) | (J2000.0) | (deg) | (deg) | (Jy km s-1 ) | (km s-1 ) | (km s-1 ) | (km s-1 ) | (Mpc) | (M) | |
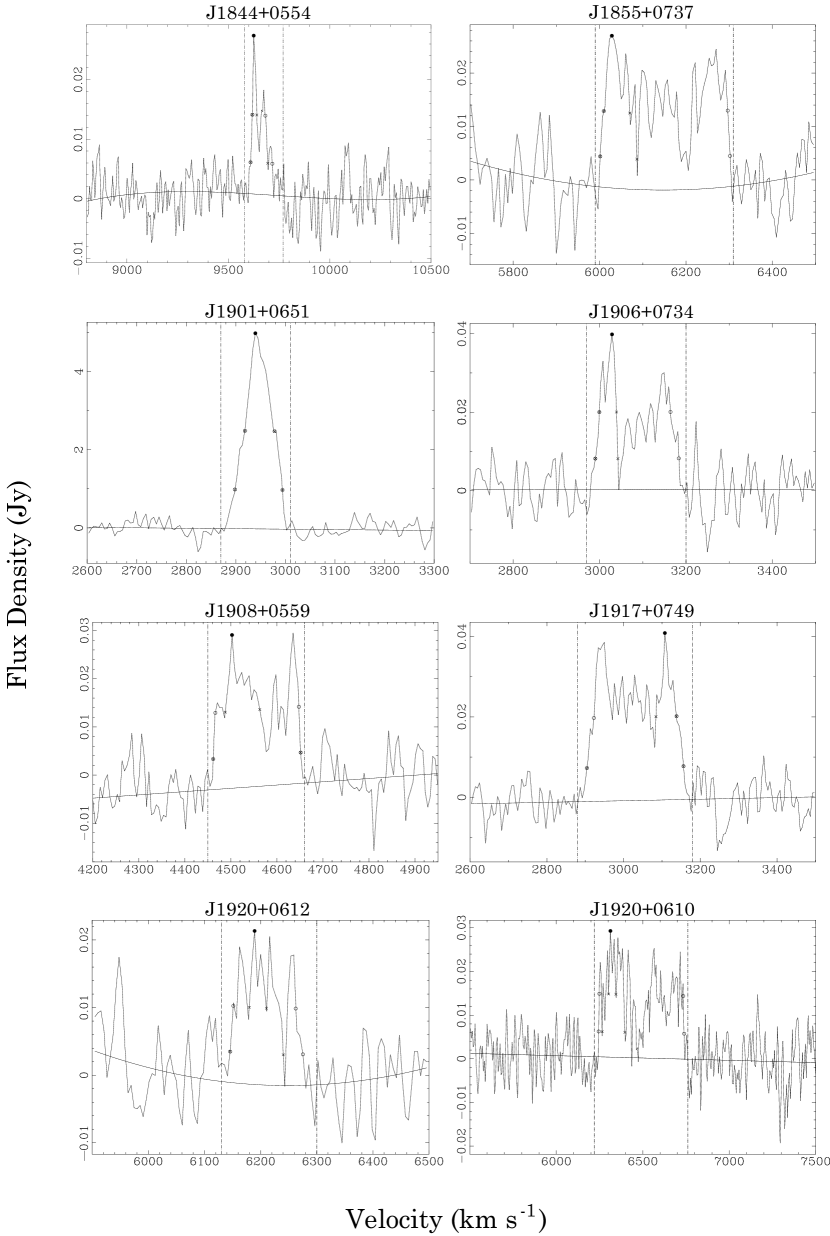
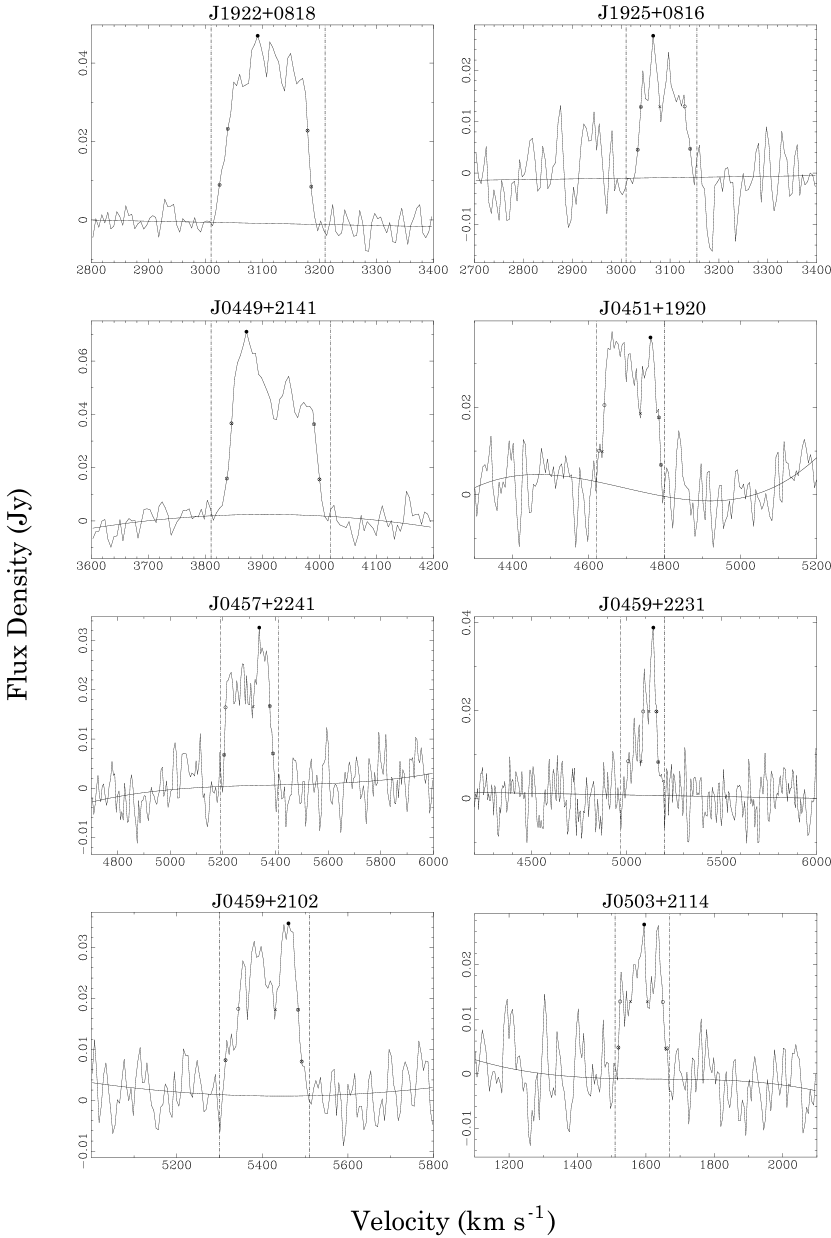
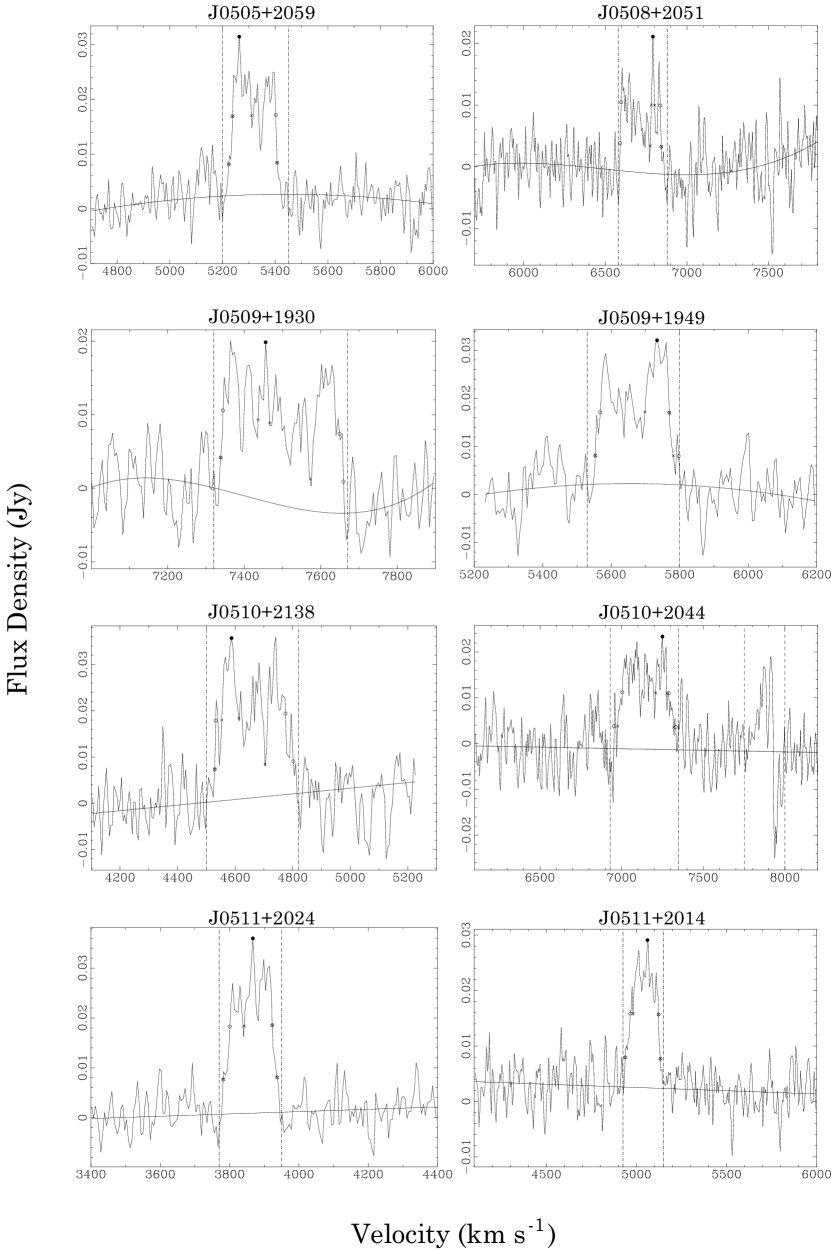
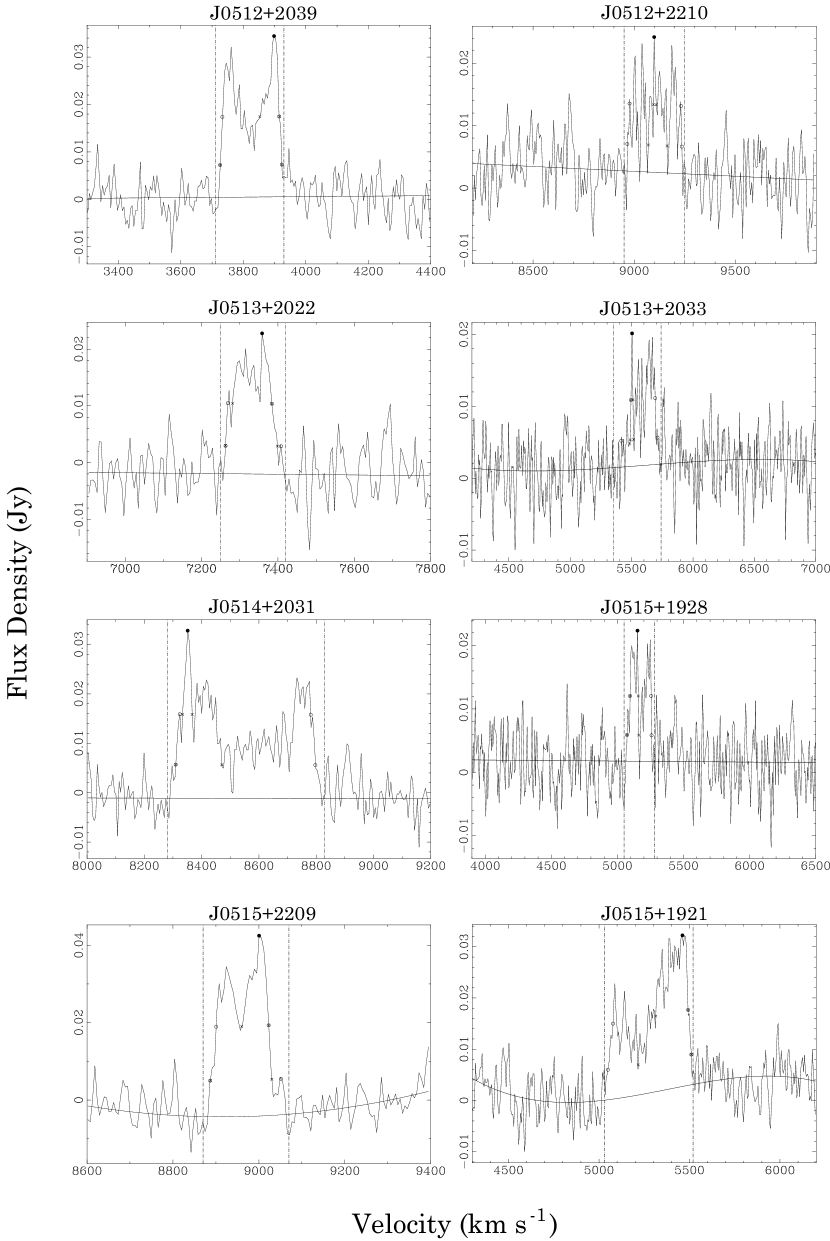
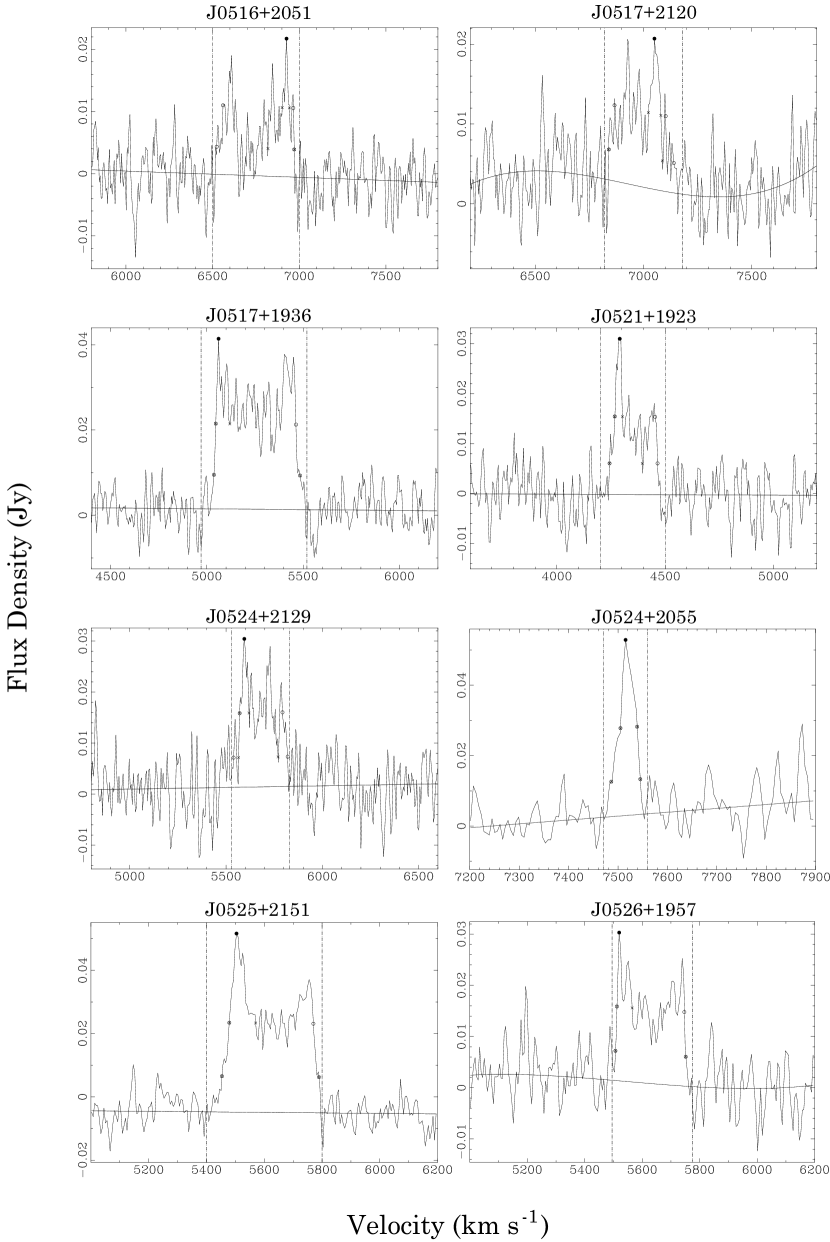
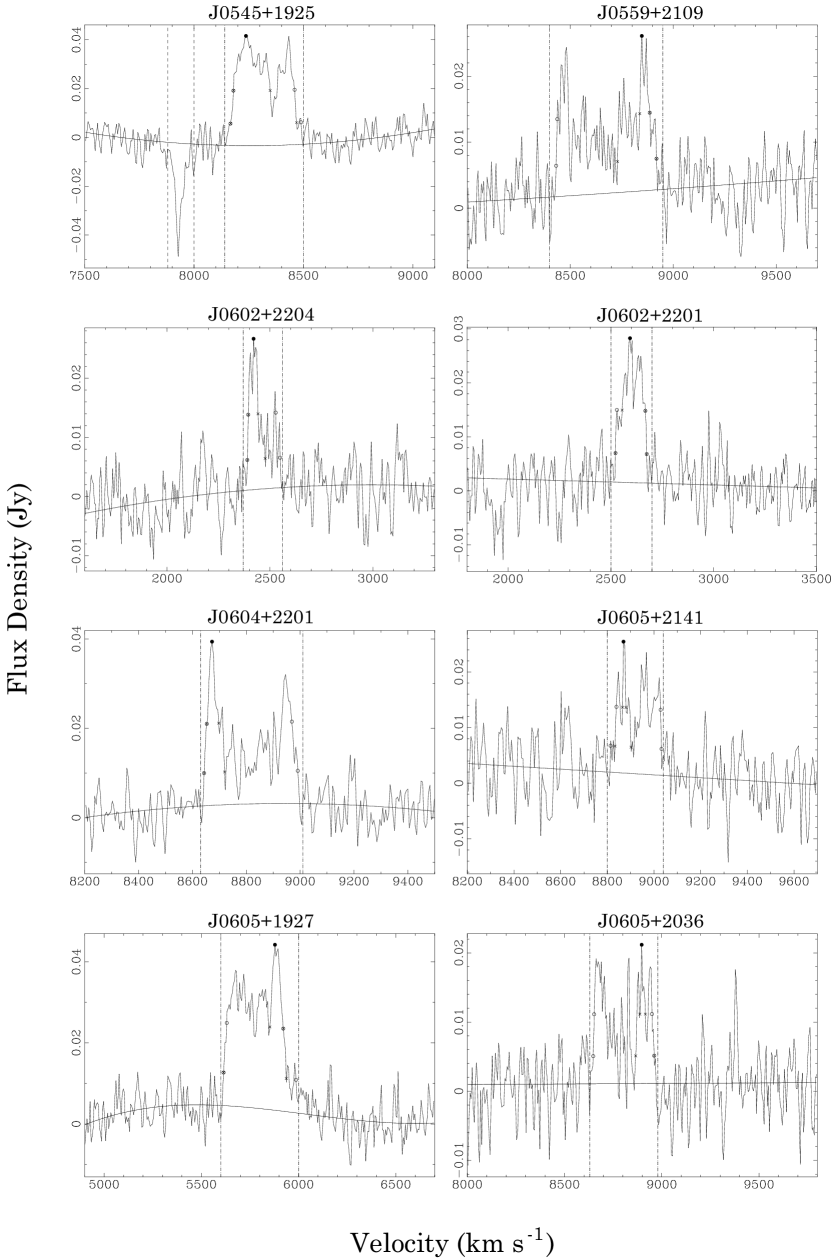
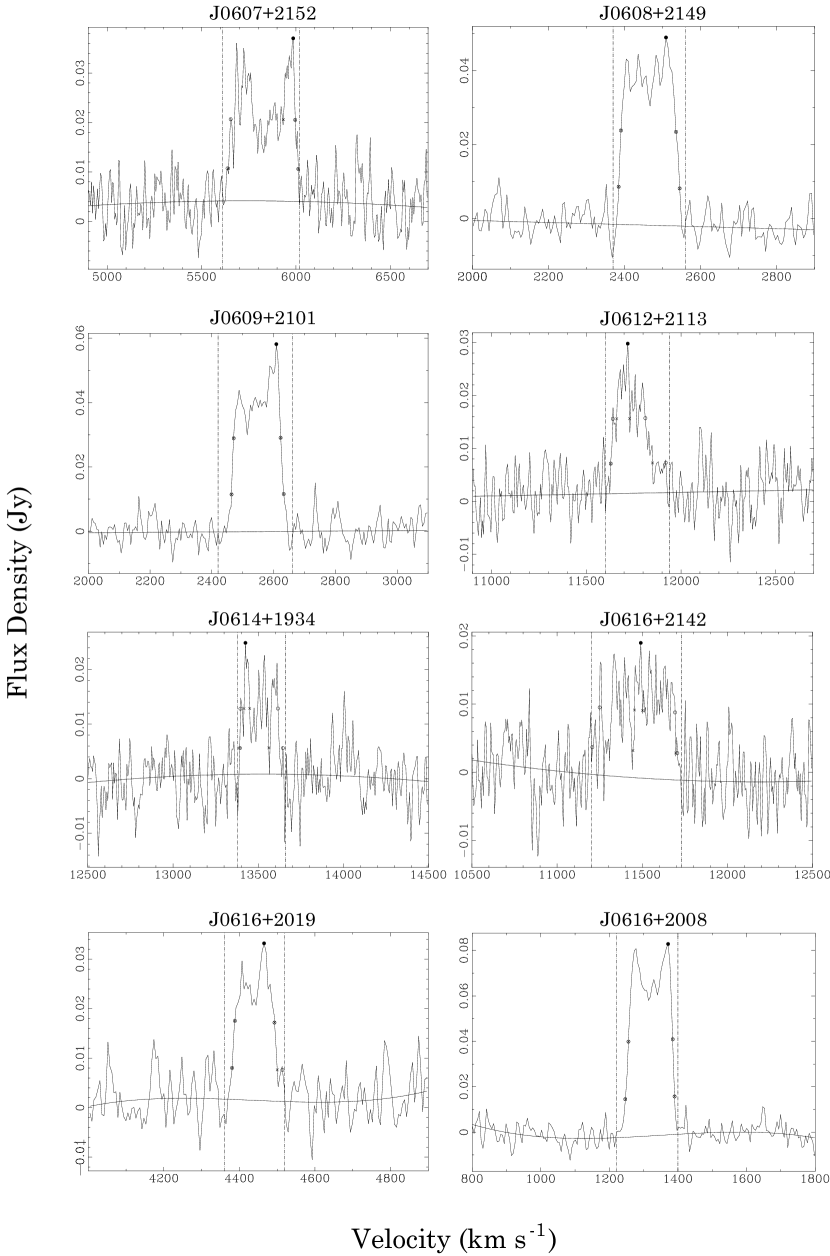
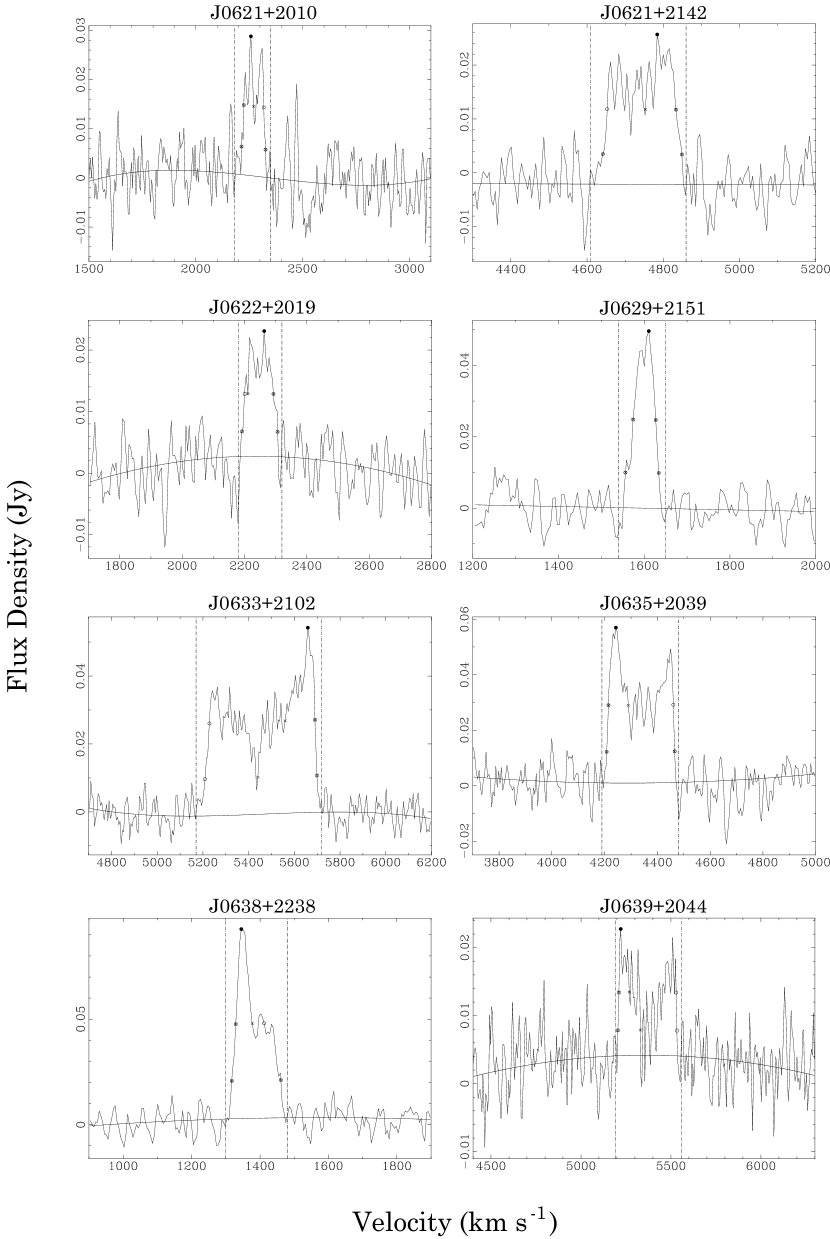
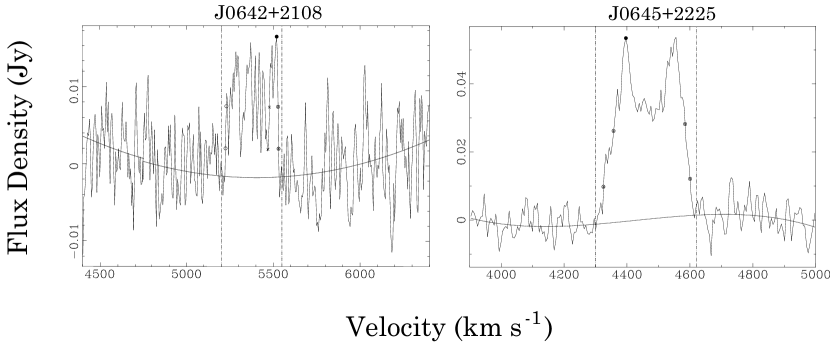

Figure 4 shows histograms of heliocentric velocity (top panel), HI flux density (middle panel), and HI linewidths at 50% of peak flux (bottom panel) for these objects. The distribution in heliocentric velocity, while averaged over some unrelated large-scale structures, shows an overdensity between 5000 - 6000 km s-1 due to galaxy distribution in the outer Galaxy region (described in Section 5.4). The HI flux density distribution shows that the survey becomes insensitive below about 2 Jy km s-1 . The average linewidth for the survey is 214 km s-1 with considerable spread, ranging from the narrowest source with 34 km s-1 linewidth, to the widest profile, with 486 km s-1 .
The values of HI mass range from Mto M, with a mean HI mass of M. Figure 5 shows the mass distribution of these 66 galaxies with secure HI measurements. The mean value and distribution in HI mass are consistent with expectation, eg. they are very similar to those of the HIZOA, which was conducted at similar sensitivity and depth.

5.2 Counterparts at Other Wavelengths
For each ALFA ZOA detection, the NASA Extragalactic Database (NED) was searched for cataloged galaxies at the location of the HI detection. The criterion for listing as a possible counterpart is a position within 3.5 arcmin of the fitted HI position. No velocity measurement of the counterpart is necessary for inclusion, but if a velocity is given, it must be within 100 km s-1 , otherwise it is excluded as a possible counterpart. Also, comparison was made to a recent pointed HI survey of 2MASS galaxies, which had one object in common with our survey (van Driel et al. 2009). Table 2 presents the 57 ALFA ZOA galaxies with possible counterparts as defined in this way, and includes:
Column (1).—Source name (an asterisk indicates the galaxy lies on an edge of the survey region, so parameters are uncertain);
Column (2).—Galactic latitude;
Column (3).—Foreground extinction AB estimated by the IRAS DIRBE maps of Schlegel et al. (1998);
Column (4).—Name of HI literature counterpart, if any;
Columns (5) and (6). —Angular separation, and velocity difference from HI counterpart (Literature - ALFA ZOA);
Columns (7) and (8).—Optical counterpart, if any, and angular separation;
Columns (9) and (10).—2MASS counterpart, if any, and angular separation;
Columns (11) and (12).—IRAS counterpart, if any, and angular separation;
Column (13).–Velocity difference between the ALFA ZOA source and any non-HI velocity measurement (Literature - ALFA ZOA).
Some galaxies have more than one possible counterpart; no attempt is made to judge amongst the candidates. For the galaxies which have 21-cm measurements in the literature [from NED, and Donley et al. (2005), Lu et al. (1990), Pantoja et al. (1997), Rosenberg and Schneider (2000), van Driel et al. (2009), Wong et al. (2006)], comparison between ALFA ZOA and literature values for the heliocentric systemic velocities, HI flux densities, and linewidths show good agreement (Fig. 6).
To assess the completeness of the survey, NED was queried to check for galaxies in these regions which have 21-cm redshifts in the literature, but were not detected by ALFA ZOA. In the square degrees, there are only three galaxies with literature 21-cm measurements that would indicate they are above our detection limit, but which were not found in the ALFA ZOA cubes. One of these objects appears in the inner Galaxy region, HIZOA J1843+06 (Donley et al. 2005). Two are in the outer Galaxy region, ADBS J053017+2233 (Rosenberg & Schneider 2000), and IRAS 05223+1908 (Lu et al. 1990). We re-examined the ALFA ZOA data at the locations of these sources, and while they should have been clear detections according to published values, we do not recover them in our data. From the available information, we cannot determine the reason for these three non-detections.

5.3 Inner Galaxy Detections
The first region observed, toward the heavily-obscured inner Galaxy, was selected to overlap the northern extension of the Parkes ZOA survey (Donley et al. 2005) with similar sensitivity, so we could check performance of the observing and analysis systems with known HI sources. We detected 10 HI galaxies in this area, including 7 of the Parkes galaxies, and three more HI sources: one associated with an IR galaxy, and two newly-discovered galaxies. Because of the thick obscuration in the optical and confusion in the NIR in this region, only one ALFA ZOA galaxy (10%) has a cataloged counterpart in any other waveband. This region was selected because it had already been covered by an HI survey of similar depth, thus we report no newly uncovered large-scale structures here, but refer the reader to Donley et al. 2005 for plots of HI galaxy distribution in this region, and connection to high latitude large-scale structure.
5.4 Outer Galaxy Detections
In the lower-extinction, less confused outer Galaxy region, 49 of the 62 galaxies (79%) detected by ALFA ZOA have counterparts (mostly 2MASS) but only 26 (42%) have previously published redshifts. The sky distribution is shown
| ALFAZOA | b | AB | HI | sep | Optical | sep | 2MASS | sep | IRAS | sep | ||
|---|---|---|---|---|---|---|---|---|---|---|---|---|
| (deg) | (mag) | (′) | (km s-1 ) | (′) | (′) | (′) | (km s-1 ) | |||||
| J1855+0737 | 2.63 | 17.1 | HIZOAJ1855+07 | 2.6 | 6 | |||||||
| J1901+0651 | 0.88 | 23.8 | HIZOAJ1901+06 | 1.2 | -5 | |||||||
| aka HIPASSJ1901+06 | ||||||||||||
| J1906+0734 | 0.09 | 66.5 | HIZOAJ1906+07 | 3.1 | 13 | |||||||
| J1908+0559 | -1.03 | 28.3 | HIZOAJ1908+05 | 0.2 | 12 | |||||||
| J1917+0749 | -2.16 | 8.4 | HIZOAJ1917+07 | 0.8 | 6 | |||||||
| J1920+0610 | -3.64 | 4.5 | IRAS19182+0604 | 0.4 | -49 | ZOAG041.78-03.65 | 0.4 | 2M19204508+0610446 | 1.1 | IRAS19182+0604 | 0.4 | |
| J1922+0818 | -2.94 | 4.4 | HIZOAJ1921+08 | 1.5 | 6 | |||||||
| aka HIPASSJ1922+08 | ||||||||||||
| J1925+0816 | -3.81 | 3.6 | HIZOAJ1926+08 | 1.5 | 3 | |||||||
| J0449+2141 | -14.49 | 1.7 | HIPASSJ0449+21 | 0.2 | 3 | UGC03177 | 0.2 | |||||
| J0457+2241 | -12.38 | 1.8 | 2M04575576+2239592 | 2.1 | ||||||||
| 2M04580046+2240042 | 2.6 | |||||||||||
| J0459+2102 | -12.98 | 1.6 | 2M04595592+2102028 | 0.5 | ||||||||
| 2M04595870+2058438 | 3.4 | |||||||||||
| J0505+2059 | -12.02 | 2.4 | UGC03243 | 0.2 | -5 | UGC03243 | 0.2 | 2M05051205+2059000 | 0.2 | |||
| J0509+1930 | -12.09 | 2.6 | 2M05091428+1930279 | 0.2 | ||||||||
| J0509+1949 | -11.83 | 2.6 | CAP0506+19a | 0.1 | 4 | 2M05094137+1949105 | 0.1 | |||||
| CAP0506+19b | 1.3 | 2M05094420+1948005 | 1.3 | |||||||||
| J0510+2138 | -10.66 | 2.5 | 2M05102162+2139250 | 0.8 | ||||||||
| J0510+2044 | -11.10 | 3.0 | 2M05104468+2044540 | 0.2 | ||||||||
| 2M05104097+2042320 | 2.3 | |||||||||||
| J0512+2039 | -10.88 | 3.0 | 2M05120483+2035593 | 3.4 | ||||||||
| J0512+2210 | -9.91 | 2.1 | 2M05124109+2209486 | 0.4 | ||||||||
| 2M05124879+2210306 | 1.8 | |||||||||||
| J0513+2033 | -10.70 | 2.9 | CAP0510+20 | 0.4 | -14 | 2M05132510+2033254 | 0.4 | IRAS05104+2029 | 0.4 | -67 | ||
| J0514+2031 | -10.54 | 2.8 | 2M05141577+2032095 | 0.4 | ||||||||
| J0515+1928 | -10.94 | 2.5 | 2M05151475+1931285 | 3.1 | ||||||||
| J0515+2209 | -9.41 | 2.3 | CAP0512+22 | 1.7 | -3 | 2M05151674+2210415 | 1.7 | IRAS05122+2207 | 1.7 | |||
| 2M05151487+2209455 | 1.9 | |||||||||||
| 2M05151551+2211245 | 2.4 | |||||||||||
| 2M05152921+2212137 | 2.9 | |||||||||||
| J0515+1921 | -10.92 | 2.5 | CAP0512+19 | 0.1 | -8 | PGC016993 | 0.1 | 2M05154347+1921467 | 0.1 | IRAS05127+1918 | 0.1 | 48 |
| 2M05153795+1919117 | 2.8 | |||||||||||
| J0516+2051 | -9.87 | 2.6 | CAP0513+20 | 0.4 | -17 | 2M05164511+2052126 | 0.4 | IRAS05137+2049 | 0.4 | |||
| J0517+2120 | -9.52 | 2.7 | 2M05170539+2121519 | 2.3 | ||||||||
| J0517+1936 | -10.40 | 2.5 | ADBS051733+1934 | 2.4 | 99 | 2M05174145+1936010 | 0.2 | |||||
| J0518+1909* | -10.40 | 2.2 | UGC03285 | 0.8 | 7 | PGC017079 | 0.8 | 2M05185631+1910219 | 0.8 | |||
| J0519+2256* | -8.15 | 3.6 | HIPASSJ0519+22 | 1.4 | 2 | 2M05193869+2257031 | 0.4 | |||||
| 2M05193160+2258441 | 2.6 | |||||||||||
| J0521+1923 | -9.72 | 1.9 | 2M05214377+1923370 | 0.5 | -1 | 2M05214377+1923370 | 0.5 | |||||
| J0524+2129 | -8.13 | 3.1 | 2M05235899+2128531 | 0.3 | IRAS05209+2126 | 0.3 | 14 | |||||
| 2M05240799+2131455 | 3.3 | |||||||||||
| J0525+2151 | -7.64 | 2.6 | CAP0522+21 | 0.3 | 4 | UGC03304 | 0.3 | 2M05252929+2151220 | 0.3 | IRAS05224+2148 | 0.3 | |
| 2M05252856+2147520 | 3.5 | |||||||||||
| J0526+1957 | -8.46 | 3.0 | 2M05263532+1957471 | 0.3 | ||||||||
| J0545+1925 | -5.03 | 2.6 | 2M05451023+1925174 | 0.4 | ||||||||
| J0548+1911* | -4.39 | 3.4 | ZOAG188.73-04.39 | 0.3 | -12 | ZOAG188.73-04.39 | 0.3 | 2M05485392+1911467 | 0.3 | IRAS05459+1910 | 0.3 | |
| J0552+2255* | -1.71 | 5.9 | 2M05525788+2255555 | 2.5 | ||||||||
| J0559+2109 | -1.21 | 6.3 | 2M05594285+2108465 | 0.6 | ||||||||
| J0602+2204 | -0.25 | 5.0 | 2M06021042+2203017 | 1.3 | ||||||||
| J0602+2201 | -0.20 | 4.7 | ZOAG187.89-00.20 | 0.3 | 2M06023546+2201525 | 0.3 | IRAS05595+2201 | 0.3 | -6 | |||
| J0604+2201 | 0.27 | 4.5 | 2M06045592+2201120 | 0.3 | IRAS06019+2201 | 0.3 | ||||||
| J0605+1927 | -0.88 | 6.6 | HIPASSJ0605+19 | 2.3 | -14 | 2M06052653+1927297 | 0.4 | |||||
| 2M06051648+1927519 | 2.8 | |||||||||||
| J0606+2036 | -0.05 | 6.4 | 2M06063438+2037119 | 2.8 | ||||||||
| 2M06064755+2039219 | 3.0 | |||||||||||
| J0607+2152 | 0.62 | 3.4 | IRAS06040+2152 | 0.1 | 4 | ZOAG188.54+00.62 | 0.1 | 2M06070237+2152194 | 0.1 | IRAS06040+2152 | 0.1 | |
| J0612+2113 | 1.47 | 3.8 | 2M06124440+2113302 | 0.3 | ||||||||
| 2M06124197+2113382 | 0.6 | |||||||||||
| 2M06125062+2113052 | 1.5 | |||||||||||
| 2M06122966+2114228 | 3.5 | |||||||||||
| J0614+1934 | 1.05 | 6.0 | 2M06143273+1934449 | 0.5 | ||||||||
| 2M06143467+1932174 | 2.8 | |||||||||||
| J0616+2142 | 2.41 | 4.9 | 2M06161256+2142233 | 0.1 | ||||||||
| J0620+2008 | 2.63 | 3.5 | ADBS062054+2008 | 0.4 | -2 | 2M06205100+2006513 | 1.7 | |||||
| aka HIPASSJ0620+20 | ||||||||||||
| J0621+2010 | 2.69 | 3.6 | ADBS062103+2010 | 0.7 | 20 | |||||||
| J0621+2256* | 4.00 | 6.6 | 2M06210911+2255353 | 0.4 | ||||||||
| J0621+2142 | 3.56 | 2.7 | 2M06214885+2142406 | 0.3 | ||||||||
| J0629+2151 | 5.24 | 1.4 | 2M06294499+2150344 | 2.1 | ||||||||
| J0633+2102 | 5.68 | 1.4 | HIPASSJ0633+21 | 0.3 | -3 | UGC03489 | 0.3 | 2M06333350+2102135 | 0.3 | IRAS06305+2104 | 0.3 | |
| 2M06334119+2101295 | 1.6 | |||||||||||
| J0635+2039 | 5.86 | 1.4 | HIPASSJ0635+20 | 0.4 | -8 | 2M06351132+2039470 | 0.4 | |||||
| J0638+2238 | 7.33 | 0.7 | HIPASSJ0637+22 | 0.4 | 19 | UGC03503 | 0.4 | |||||
| J0639+2044 | 6.81 | 0.9 | UGC03505 | 0.3 | 4 | UGC03505 | 0.3 | 2M06393660+2044335 | 0.3 | |||
| J0642+2108 | 7.50 | 0.7 | CAP0639+21 | 0.3 | 8 | 2M06420364+2108345 | 0.3 | IRAS06391+2111 | 0.3 | |||
| 2M06420114+2108435 | 0.6 | |||||||||||
| J0643+2252* | 8.49 | 1.2 | UGC03516 | 0.6 | 2 | PGC019483 | 0.6 | |||||
| J0645+2225 | 8.82 | 1.3 | HIPASSJ0645+22 | 0.2 | -6 | UGC03534 | 0.2 | 2M06454136+2225464 | 0.2 | |||
| 2M06454263+2224583 | 0.7 |
in the right panel of Figure 1, which also indicates the location of the Crab nebula. This strong continuum source locally raised the system temperature and disturbed the spectral baselines. The noise in the underdense region to the Galactic North of the Crab nebula is comparable to the average survey noise, indicating that the underdensity in galaxies there is probably real.
The velocity distribution of the ALFA ZOA galaxies plotted as a wedge diagram in RA, collapsed around the central declination of the search (), is shown in Figure 7. For this plot, cataloged galaxies with known velocity are also shown, and the wedge continues in RA beyond the limits of our survey (which is shown by the central wedge). Most notable in the ALFA ZOA galaxy distribution is an apparent overdensity of galaxies near , and between 5000 - 6000 km s-1 (). This overdensity is also evident in the optical and IR-selected sample of Pantoja et al. (1997, 2000), and the 2MASS sample of van Driel et al. (2009). The most obvious concentration near this velocity seen in the cataloged galaxies is the Cancer cluster, with its finger of God apparent at , 4500 km s-1 . The Perseus-Pisces chain, at similar velocity, enters the ZOA at (apparent in Fig 1). The ALFA ZOA concentration lies very roughly between the two on the sky. This overdensity lies close to the Orion concentration evident in the 2MASS Redshift Survey density field reconstruction (Erdogdu et al. 2006) in the shell at 6000 km s-1 . Also nearby in the reconstruction is the feature “C5”, at , with velocity peak at 5000 km s-1 . This may be evidence of a real overdensity of galaxies consistent with the large-scale structure reconstruction at low-Galactic latitude.
Also apparent in the wedge plot is the Taurus void (center at RA = 3.5h, Dec = +20∘, v = 4000 km s-1) which appears as underdensity on the low RA side, and possibly a portion of the Gemini void (center at RA = 6h, Dec = +40∘, v = 3000 km s-1).

6 The Future: Surveying the Entire Arecibo ZOA
The precursor observations of a relatively small area of the ZOA visible to the Arecibo Radio Telescope have shown that we can detect new galaxies behind the Milky Way, and with the redshifts provided by the 21-cm spectral line of HI, delineate large-scale structure at low Galactic latitude. These observations are only a prelude to a large survey of the ZOA, to be conducted in two phases, one shallow, and one deep. A shallow survey of the entire inner Galaxy region, square degrees, began in May 2008, in the nodding scan mode described here. Extrapolating from the detection rate of the precursor observations, we anticipate a final catalog in this region of about 500 galaxies. The vast majority will be new detections, as only 1/10th of the detections from the precursor inner Galaxy observations have a 2MASS counterpart in the extended source catalog. This is not surprising due to the high stellar surface density in the Galactic first quadrant. For the galaxies which do have counterparts at other wavelengths, we will provide high-quality redshifts. This area of the sky is almost uncharted territory (Fig 1), so we anticipate the discovery of many unknown galaxies and structures. Observations for this phase of the survey were completed in 2009.
Commensal observations with a deep survey for pulsars within began in July 2009. The multi-year survey began in the inner Galaxy, with intention to extend the survey to the outer Galaxy () in the future. These sensitive data will also be used by a team interested in surveying Galactic radio recombination lines. The integration time planned for this project is a lengthy 268 seconds per pointing (compare to 8 sec per beam in the nodding scan mode), with the sky covered by tiles of individual pointings. The higher sensitivity of this deep phase of the survey is expected to yield thousands of galaxies, including local low-mass objects, and HI galaxies at large distances.
This work is based on observations done at Arecibo Observatory. The Arecibo Observatory is part of the National Astronomy and Ionosphere Center, which is operated by Cornell University under a cooperative agreement with the National Science Foundation. We thank the Arecibo Observatory staff for help organizing these commensal observations, and Mark Calabretta for quickly adjusting the Parkes multibeam reduction software to accept the new format.
This research has made use of the NASA/IPAC Extragalactic Database (NED) which is operated by the Jet Propulsion Laboratory, California Institute of Technology, under contract with the National Aeronautics and Space Administration. We acknowledge the usage of the HyperLeda database (http://leda.univ-lyon1.fr).
PAH gratefully acknowledges support from NSF grant AST-0506676.
References
- (1) Auld, R., Minchin, R. F., Davies, J. I., Catinella, B., van Driel, W., Henning, P. A., Linder, S., Momjian, E., Muller, E., O’Neil, K., Sabatini, S., Schneider, S., Bothun, G., Cortese, L., Disney, M., Hoffman, G. L., Putman, M., Rosenberg, J. L., Baes, M., de Blok, W. J. G., Boselli, A., Brinks, E., Brosch, N., Irwin, J., Karachentsev, I. D., Kilborn, V. A., Koribalski, B., & Spekkens, K. 2006, MNRAS, 371, 1617
- (2) Barnes, D.G., Staveley-Smith, L., de Blok, W.J.G., Oosterloo, T., Stewart, I.M., Wright, A.E., Banks, G.D., Bhathal, R., Boyce, P.J., Calabretta, M.R., Disney, M.J., Drinkwater, M.J., Ekers, R.D., Freeman, K.C., Gibson, B.K., Green, A.J., Haynes, R.F., te Lintel Hekkert, P., Henning, P.A., Jerjen, H., Juraszek, S., Kesteven, M.J., Kilborn, V.A., Knezek, P.M., Koribalski, B., Kraan-Korteweg, R.C., Malin, D.F., Marquarding, M., Minchin, R.F., Mould, J.R., Price, R.M., Putman, M.E., Ryder, S.D., Sadler, E.M., Schröder, A., Stootman, F., Webster, R.L., Wilson, W.E., & Ye, T. 2001, MNRAS, 322, 486
- (3) Branchini, E., Teodoro, L., Frenk, C. S., Schmoldt, I., Efstathiou, G., White, S. D. M., Saunders, W., Sutherland, W., Rowan-Robinson, M., Keeble, O., Tadros, H., Maddox, S., & Oliver, S. 1999, MNRAS 308, 1
- (4) Cortese, L., Minchin, R.F., Auld, R.R., Davies, J.I., Catinella, B., Momjian, E., Rosenberg, J.L., Taylor, R., Gavazzi, G., O’Neil, K., Baes, M., Boselli, A., Bothun, G., Koribalski, B., Schneider, S., & van Driel, W. 2008, MNRAS, 383, 1519
- (5) Donley, J.L., Staveley-Smith, L., Kraan-Korteweg, R.C., Islas-Islas, J.M., Schröder, A., Henning, P.A., Koribalski, B., Mader, S., & Stewart, I. 2005, AJ 129, 220
- (6) Erdogdu, P., Lahav, O., Huchra, J.P., Colless, M., Cutri, R.M., Falco, E., George, T., Jarrett, T., Jones, D.H., Macri, L.M., Mader, J., Martimbeau, N., Pahre, M.A., Parker, Q.A., Rassat, A., & Saunders, W. 2006, MNRAS, 373, 45
- (7) Fairall, A.P. 1998, Large-Scale Structures in the Local Universe, (Chichester: Wiley)
- (8) Freudling, W. Staveley-Smith, L., Calabretta, M., Catinella, B., van Driel, W., Linder, S., Minchin, R., Momjian, E., Zwaan, M., & AUDS Team 2005, BAAS 37, 1316
- (9) Gooch, R.E., 1996, in ASP Conf. Ser. 101, Astronomical Data Analysis Software and Systems V, ed. G. H. Jacoby & J. Barnes (San Francisco: ASP), 80
- (10) Giovanelli, R., Haynes, M.P., Kent, B.R., Perillat, P., Saintonge, A., Brosch, N., Catinella, B., , Hoffman, G.L., Stierwalt, S., Spekkens, K., Lerner, M.L., Masters, K.L., Momjian, E., Rosenberg, J.L., Springob, C.M., Boselli, A., Charmandaris, V., Darling, J.K., Davies, J., Lambas, D.G., Gavazzi, G., Giovanardi, C., Hardy, E., Hunt, L.K., Iovino, A., Karachentsev, I.D., Karachentseva, V.E., Koopmann, R.A., Marinoni, C., Minchin, R., Muller, E., Putman, M., Pantoja, C., Salzer, J.J., Scodeggio, M., Skillman, E., Solanes, J.M., Valotto, C., van Driel, W., & van Zee, L. 2005, AJ 130, 2598
- (11) Henning, P.A., Kraan-Korteweg, R.C., Rivers, A.J., Loan, A.J., Lahav, O., & Burton, W.B. 1998, AJ 115, 584
- (12) Henning, P.A., Staveley-Smith, L., Ekers, R.D., Green, A.J., Haynes, R.F., Juraszek, S., Kesteven, M.J., Koribalski, B.S., Kraan-Korteweg. R.C., Price, R.M., Sadler, E.M., and Schröder, A. 2000, AJ 119, 2686
- (13) Henning, P.A., Kraan-Korteweg, R.C., & Staveley-Smith, L. 2005, in workshop on “Nearby Large-Scale Structures & the Zone of Avoidance”, ASP Conf. Ser. 329, eds. A.P. Fairall & P.A. Woudt, (San Francisco: ASP), 199
- (14) Huchra, J., Jarrett, T., Skrutskie, M., Cutri, R., Schneider, S., Macri, L., Steining, R., Mader, J., Martimbeau, N., & George, T. 2005, in workshop on “Nearby Large-Scale Structures & the Zone of Avoidance”, ASP Conf. Ser. 329, eds. A.P. Fairall & P.A. Woudt, (San Francisco: ASP), 135
- (15) Karachentsev, I.D., Sharina, M.E., Makarov, D.I., Dolphin, A.E., Grebel, E.K., Geisler, D., Guhathakurta, P., Hodge, P.W., Karachentseva, V.E., Sarajedini, A., & Seitzer, P. 2002, A&A 389, 812
- (16) Kraan-Korteweg, R.C. 1986, A&AS 66, 255
- (17) Kraan-Korteweg, R.C., Koribalski, B.S., & Juraszek, S. 1999, in ESO/ATNF Workshop on “Looking Deep in the Southern Sky”, eds. R. Morganti & Couch, Springer, 23
- (18) Kraan-Korteweg, R.C., Staveley-Smith, L., Donley, J., Koribalski, B. & Henning, P.A. 2005, in IAU Symp. 216, Maps of the Cosmos, eds. M. Colless and L. Staveley-Smith, (ASP: San Francisco), 203
- (19) Lamm, R., Minchin, R., Momjian, E., Lowenthal, J., Henning, P., Catinella, B., & ALFA ZOA Collaboration 2007, BAAS, 39, 965
- (20) Lu, N.Y., Dow, M.W., Houck, J.R., Salpeter, E.E., & Lewis, B.M. 1990, ApJ, 357, 388
- (21) Pantoja, C.A., Altschuler, D.R., Giovanardi, C., & Giovanelli, R. 1997, AJ, 113, 905
- (22) Pantoja, C.A., Giovanardi, C., Altschuler, D.R., Huchra, J.P., & Giovanelli, R. 2000, ASP Conf. Ser. 218, eds. R.C. Kraan-Korteweg, P.A. Henning, & H. Andernach, (San Francisco: ASP), 219
- (23) Peebles, P.J.E., Phelps, S.D., Shaya, E.J., & Tully, R.B. 2001, ApJ, 554, 104
- (24) Rivers, A.J. 2000, Ph.D. thesis, Univ. of New Mexico
- (25) Rosenberg, J.L. & Schneider, S.E. 2000, ApJS, 130, 177
- (26) Saintonge, A. 2007, AJ, 133, 2087
- (27) Sault, R.J., Teuben, P.J., & Wright, M.C.H. 1995, in ASP Conf. Ser. 77, Astronomical Data Analysis Software and Systems IV, ed. R.A. Shaw, H.E. Payne, & J.J.E. Hayes (San Francisco: ASP), 433
- (28) Schlegel, D.J., Finkbeiner, D.P., & Davis, M., 1998, ApJ, 500, 525
- (29) Shafi, Nebiha 2008, M.Sc. thesis, Univ. of Cape Town
- (30) Skrutskie, M.F., Cutri, R. M., Stiening, R., Weinberg, M. D., Schneider, S., Carpenter, J. M., Beichman, C., Capps, R., Chester, T., Elias, J., Huchra, J.,Liebert, J., Lonsdale, C., Monet, D.G., Price. S., Seitzer, P., Jarrett, T., Kirkpatrick, J.D., Gizis, J.E., Howard, E., Evans. T., Fowler, J., Fullmer, L., Hurt, R., Light, R., Kopan, E.L., Marsh, K.A., McCallon, H.L., Tam, R., Van Dyk, S., Wheelock, S. 2006, AJ 131, 1163
- (31) Stanimirovic, S., Putman, M., Heiles, C., Peek, J.E.G., Goldsmith, P.F., Koo, B.-C.,Krco, M., Lee, J.-J., Mock, J., Muller, E., Pandian, J.D., Parsons, A., Tang, Y., & Werthimer, D. 2006, ApJ 653, 1210
- (32) van Driel, W., Schneider, S.E., Kraan-Korteweg, R.C., & Monnier Ragaigne, D. 2009, A&A 505, 29
- (33) Wong, O.I., Ryan-Weber, E.V., Garcia-Appadoo, D.A., Webster, R.L., Staveley-Smith, L., Zwaan, M.A., Meyer, M.J., Barnes, D.G., Kilborn, V.A., Bhathal, R., de Blok W.J.G., Disney, M.J., Doyle, M.T., Drinkwater, M.J., Ekers, R.D., Freeman, K.C., Gibson, B.K., Gurovich, S., Harnett, J., Henning, P.A., Jerjen, H., Kesteven, M.J., Knezek, P.M., Koribalski, B.S., Mader, S., Marquarding, M., Minchin, R.F., O’Brien, J., Putman, M.E., Ryder, S.D., Sadler, E.M., Stevens, J., Stewart, I.M., Stootman, F., and Waugh, M. 2006, MNRAS 371, 1855