Influence of pore dielectric boundaries on the translocation barrier of DNA
Abstract
We investigate the impact of dielectric boundary forces on the translocation process of charged rigid DNA segments through solid neutral nanopores. We assess the electrostatic contribution to the translocation free energy barrier of a model DNA segment by evaluating the potential of mean force in absence and presence of polarization effects by means of coarse-grained molecular dynamics simulations. The effect of induced polarization charges has been taken into account by employing ICC⋆, a recently developed algorithm that can efficiently compute induced polarization charges induced on suitably discretized dielectric boundaries. Since water has a higher dielectric constant than the pore walls, polarization effects repel charged objects in the vicinity of the interface, with the effect of significantly increasing the free energy barrier. Another investigated side effect is the change of the counterion distribution around the charged polymer in presence of the induced pore charges. Furthermore we investigate the influence of adding salt to the solution.
I Introduction
The problem of polymer translocation through nanometer-sized pores has recently stimulated much experimental Storm et al. (2005); van Dorp et al. (2009); Fologea et al. (2005); Dekker et al. (2006); Keyser et al. (2006); Trepagnier et al. (2007); Gershow and Golovchenko (2007); Ghosal (2007); Maglia et al. (2008), theoretical Di Marzio and Mandell (1997); Muthukumar (1999); Lubensky and Nelson (1999); Chuang et al. (2001); Sakaue (2007); Dubbeldam et al. (2007); Kotsev and Kolomeisky (2007); Abdolvahab et al. (2008); Chatelain et al. (2008); McCauley et al. (2009) and simulation based Milchev et al. (2004); Aksimentiev et al. (2004); Matysiak et al. (2006); Luo et al. (2006); Fyta et al. (2006); Luan and Aksimentiev (2008); Melchionna et al. (2009) research, due to their major role in biological processes and to potential technological applications. Molecular transport is indeed one of the key functions fulfilled by the plasma and nuclear membranes of the cell, and a sizable amount of transport mechanisms which work in the cell are characterized by the same general design: namely, by the presence of pores, mostly through membrane proteins. The controlled transport of single molecules through synthetic or biological nanopores is considered as a versatile tool of single molecule sensing and to be a most promising candidate for rapid DNA sequencing. A recent review reported more than 100 experimental approaches Howorka and Siwy (2009) that try to unveil how these systems can be technologically used as a probe to the world of single molecules. Researchers employed biological nanopores, or crafted synthetic onesStorm et al. (2003), for different technological and scientific purposes, often with an aim towards DNA sequencing Branton et al. (1996); Henrickson et al. (2000); Lagerqvist et al. (2006).
The complex interplay of interactions – electrostatic, hydrodynamic and specific chemical ones – and the entropic properties of chain molecules makes a full understanding of these systems very difficult. In this article we investigate a contribution to the translocation free energy barrier of stiff DNA which has often been neglected so far, namely the role of the dielectric mismatch between solvent and pore. The presence of the interface between the highly polarizable aqueous solution () and the membrane which is much less polarizable () leads to repelling forces between charged objects and the pore wall. As DNA is a highly charged molecule this effect is likely not to be negligible and potentially gives rise to an energetic barrier that opposes transversing the pore. Its characteristics and dependence on the pore size, DNA length, or salt concentration are not known. In this work we answer some of the these questions by investigating the translocation properties of a model, rigid DNA fragment. Coarse-grained Molecular Dynamics (MD) simulations are employed to compute the mean force acting on the DNA fragment, taking explicitly into account the combined effect of the DNA counterions, salt ions at different ionic strengths, and of surface polarization charges generated by the presence of the dielectric mismatch.
This paper is organized as follows: in Sec. II, we briefly review some aspects of theoretical models and simulation approaches for the description of DNA translocation through pores, as well as the strategy of our approach; in Sec. III we describe some methodological details, starting with the recently developed ICC⋆ (induced charge computation) algorithm Tyagi et al. (submitted) that accurately calculates the induced polarization charges on the dielectric boundaries of the pore, continuing with the description of the DNA model and the procedure employed to estimate the free energy profile. In Sec. IV the results of our investigation are presented and discussed. The paper ends with some concluding remarks in Sec. V.
II DNA translocation free energy
In order to cross a pore, a polymer undergoes several distinct phases. The first phase is the diffusive transport of the polymer to within the vicinity of the pore entrance. It is diffusive also under an applied external field since the applied voltage drops only in vicinity of the pore.
Another phase can be attributed to the polymer entering the pore which implies a conformational change of the polymer, namely a stifffening, that is connected to an entropic loss of the chain conformation. This also implies that the DNA molecule experiences an interaction with the pore along the stretched end. This possibly imposes an additional barrier, depending on the electrostatic and chemical interactions within the pore.
The actual translocation process involves the threading of the polymer through the pore until the polymer reaches the other side of the pore. In all common experiments the process is driven by an external electrostatic field for two reasons: The first reason is that the ionic current through the pore is the observable that serves for sensing. The other reason is the entrance barrier that limits the frequency with which the polymer performs the actual translocation. This barrier is reduced by applying an external field and thus the translocation frequency is increased.
The translocation phase turns out to be very complex for flexible polymers. One of the major issues encountered in the description of flexible polymers is the fact that the relaxation time of very long polymers to thermodynamic equilibrium is longer than the translocation time itself Chuang et al. (2001); Gauthier and Slater (2008). Also when the polymer is shorter the relaxation of the chain still appears to be strongly coupled to the translocation process Gauthier and Slater (2009). This means that it is not possible to use the number of translocated monomers — as well as any other single generalized variable — as a reaction coordinate and to assume all other degrees of freedom to be relaxed (as is the case of Muthukumar’s model Muthukumar (1999)). This has a profound implication, because it shows that the translocation process is genuinely irreversible: theoretical approaches based on quasi-equilibrium such as mean force calculation or umbrella sampling are questionable for flexible polymers such as single stranded DNA (ssDNA), which has a persistence length of about 3 nm, that is comparable to or smaller than the thickness of usual pores. These difficulties are still not solved and form a very active field of research.
The electrostatic barrier was calculated in Ref. Zhang and Shklovskii (2007) for ssDNA in a biological -hemolysin pore, and a value of more than 10 was found. In these calculations the barrier is governed by the dielectric mismatch effect between the surrounding water and the membrane material that is less polarizable. This leads to a repelling force that drives uncompensated charges out of the pore. As this effect is of electrostatic origin it is obvious that it can be screened by adding salt to the system. This is consistent with the experimental findings that the rate with which DNA enters such a pore can be increased by more than one order of magnitude when increasing the salt concentration from 0.25 mmol/l to 0.5 mmol/l Bonthuis et al. (2006). To our knowledge no theoretical estimates of that barrier has been made for larger pores and double stranded DNA (dsDNA). dsDNA is rather stiff with a persistence length of 50 nm at physiological conditions. Hence the configurational entropy of not too long strands is small. In these cases the energetic barrier becomes more important to the dynamics of the translocation process and the entropic barrier which is large only for longer or more flexible chains becomes a secondary effect.
Previous findings based on simulations that take into account the dielectric contrast indicated that a dielectric contrast increases the tendency to neutralize charges in the pore Rabin and Tanaka (2005) and squeezes the counterion cloud Guo and Luijten (2009). The simulation works on this effect were restricted to generic pore models with small diameters not much larger than a nanometer and small simulation cells, because the employed scheme to solve Poisson’s equation in presence of dielectric discontinuities was computationally very demanding. Additionally it is questionable if the specific properties of the biological pores that were modelled and the properties of the solvent in these small pores should not taken into account in a more precise way. Works with fully electrostatic water models also focused on small pores (e.g. Aksimentiev et al. (2004); Luan and Aksimentiev (2008)) and do not allow one to distinguish polarization effects. With the recently developed ICC⋆ algorithm it is however possible to extend the range of systems available for MD simulations to larger pores and lower salt concentrations including dielectric boundary effects. This is because ICC⋆ can use arbitrary Coulomb solvers including the efficient and highly optimized Coulomb solvers typically used in MD, that almost scale linearly with the number of investigated charges. We looked specifically at a pore 5 nm in diameter which is about the smallest size of synthetic nanopores that is typically used in translocation experiments. Salt concentrations of no more than 10 mmol/l can be investigated while still being able to simulate a sufficiently large bulk reservoir. With a stiff model of dsDNA we investigated the capture barrier for two DNA segments of length 3 nm an 10 nm.
III Methods
III.1 The ICC⋆ algorithm
In order to present the ICC⋆ algorithm we make the following assumptions: An arbitrarily shaped object with permittivity is embedded in a dielectric continuum with permittivity , referred to as the outer and the inner medium. The Poisson equation in CGS units reads:
| (1) |
where is the electrostatic potential, a charge density that represents e.g. charged objects, and a generic, position-dependent, dielectric permittivity. Solving this equation in direct proximity of the boundary leads to the well known discontinuity of the normal component of the electric field
| (2) |
This dielectric jump can be reproduced locally by placing an infinitesimal charged disk in the outer medium, parallel to the boundary, if the charge density of the disk fulfills:
| (3) |
Here denotes the field as measured in the outer medium if the charged disk was not present. If the boundary is successively replaced by these charged surface segments the emerging field is identical to that of the original system. The ICC⋆ algorithm is an iterative procedure that allows to obtain a discretized analogous of this surface charge on a grid of arbitrary shape. Any Coulomb solver can be used to obtain the value of at each position of the discretized boundary. Coulomb solvers employed in molecular dynamics simulations can only handle point charges rather than charged disks. The far field of a charged disk, however, is indistinguishable from that of a point charge, so that at a certain distance from the surface (one or two disk diameters) the proper solution is recovered within good accuracy. In close proximity to the disk this approximation is not valid anymore; this implies two restrictions: On the one hand, charged objects in a molecular dynamics simulations must not approach closer that the disk radius (which is equivalent to distance between adjacent surface elements). On the other hand the mutual influence of adjacent surface segments carries the same inaccuracy in the near-field. For a plane boundary this inaccuracy is of no importance, since only the normal component of the electric field determines the charge at the boundary, which then vanishes. In presence of curved boundaries however the normal component is nonzero, therefore the discretization has to be refined so that the angle between the normal vectors of adjacent discretization points is small. We have found that employing a discretization point distance that is smaller than half of the local radius of curvature is sufficient.
The ICC⋆ algorithm works as follows: Initially, a surface discretization with appropriate normal vectors and the corresponding surface element size is chosen. Each of the surface segments is initialised with a small but nonzero value to probe the local field. With a fast Coulomb solver the field at each of the discretization points is calculated. Then a new charge is assigned to each surface point following the scheme:
| (4) |
where is obtained from eq. 3:
| (5) |
This procedure is iterated until a self-consistent solution is obtained. The factor is a free parameter that determines the stability and the speed of convergence of the relaxation scheme. It has turned out that a value of 0.9 yields perfect stability for all tested cases and optimal speed of convergence. This iteration scheme does not need to be repeated after every MD step, but only after the particle positions have changed noticeably, typically after 5-50 MD steps. Additional the small change of particle positions leads only to a small change in the boundary element charge, so each ICC⋆ update usually only needs 1-2 iteration steps.
III.2 The DNA model and simulation details
For the simulation we used the following model and parameters: The dsDNA molecule was represented as a chain of spherical beads (50 beads per nm) forming a cylinder, constrained to fixed positions. Equal charges were assigned to each bead, in order to reach the line charge density of dsDNA ( nm). Mobile counterions, as well as salt ions, were represented as monovalent point charges, mutually interacting – besides Coulomb interaction – with the purely repulsive Weeks–Chandler–Anderson (WCA) potential
| (6) |
where nm corresponds to an average size of the ions, including the first
hydration shell,
and . DNA beads and mobile
ions interact also via a WCA potential to mimic the steric repulsion of dsDNA, whereas
in this case nm, corresponding to a DNA diameter of 2 nm (the value of
being unaltered). The temperature was fixed to 300 K,
and the Bjerrum length to 0.7 nm. The pore was modeled as a reflecting
structureless, cylindrical cavity in a 8 nm thick wall. The pore diameter was
set to 5 nm, and the pore openings were smoothed with a torus shape
of radius 1 nm.
The system composed of the DNA fragment, mobile ions and the pore was set up in a cubic
simulation box with edge lengths of 20 nm, with periodic boundary conditions in all three
directions. The electrostatic interaction
was calculated using the P3M algorithmHockney and Eastwood (1988), choosing the parameters so to minimize the
errors in the calculated forces Deserno and Holm (1998a, b); Arnold and Holm (2005).
The time-step in simulation units was set to 0.002, and the ICC⋆ algorithm was applied
every 10 integration steps. This assured that at least 99.99% of the particle moved less then
0.1 nm between ICC⋆ updates. The simulations were performed in the canonical
ensemble by integrating the Langevin equation using the velocity Verlet scheme.
The calculations were performed with different salt concentrations between 0 and 10 mmol/l and DNA segments of two different lengths: a small fragment of 3 nm corresponding to about 15 base pairs and a longer segment of 10 nm corresponding to about 40 base pairs. These salt concentrations cover the range from and idealized salt free case to 10 mmol/l. All simulations were performed with the freely available simulation package ESPResSo Limbach et al. (2006).
III.3 Free Energy Profile
The main subject of this investigation is the free energy profile of the model rigid DNA fragment across a nanopore as generated by the rearrangement of the mobile ion distribution and by the influence of the dielectric mismatch. As we want to consider the electrostatic aspects of the barrier of a stiff molecule, it is reasonable to constrain the molecule to the path where we expect the lowest electrostatic barrier: the motion in the pore axis, where the nearest approach to the pore wall is minimal. This lowers the dimensionality of the problem and thus decreases computational complexity. To get the free energy profile as a function of the only reaction coordinate , the axial coordinate of the DNA fragment center the following simple a thermodynamic integration is used.
Recovering the free energy profile, as the potential of mean force is then, for this system, straightforwardCiccotti et al. (2005); Kirkwood (1935). Only one DNA degree of freedom is left – the position along the pore axis, , – and it is employed as a reaction coordinate describing the pore crossing. The derivative of the free energy with respect to the DNA fragment center can be therefore be written as
| (7) |
or, in other words,
Here the symbol identifies an ensemble where the coordinate is constrained to have the value . Note that since both the reaction coordinate and the constraints are linear in the Cartesian coordinates, there is no difference between constrained or conditional probabilities, and the Fixman Fixman (1978) potential for this problem is just a constant. The “standard” free energy therefore coincides with the geometrical one Hartmann and Schütte (2007), and no ambiguity is left about which quantity is being computed.
The generalized force coincides with the component of the (Cartesian) force on the DNA along the pore axis, where is the potential energy. Eventually, the free energy profile can be obtained by thermodynamic integration as
| (8) |
where defines the zero point of the free energy. We chose where the DNA is midway from the two periodic images of the pore, which the best approximation possible of a DNA molecule far away from the pore. In the coordinate system used in this work this corresponds to . Finally we employed the simple rectangle method in order to perform the thermodynamic integration, introducing systematic errors of order , which were found to be small compared to the statistical ones.
IV Results and Discussion
In order to determine the effect of the dielectric boundary forces we
performed simulations where the ICC⋆ was turned on reducing the
permittivity of the membrane material to , and
simulations where the ICC⋆ was not active which corresponds to a
permittivity of in the whole simulation box.
The mean force was taken at equidistant points every 1 nm.
| DNA len. | conc. | no. counterions | no. coions | barrier in |
|---|---|---|---|---|
| 3 nm | 0 mol/l | 17 | 0 | 15.7 0.3 |
| 3 mol/l | 25 | 8 | 12.6 0.3 | |
| 10 mol/l | 46 | 29 | 8.6 0.3 | |
| 10 nm | 0 mol/l | 58 | 0 | 21.1 0.9 |
| 3 mol/l | 66 | 8 | 20.1 0.7 | |
| 10 mol/l | 87 | 29 | 16.8 0.7 |
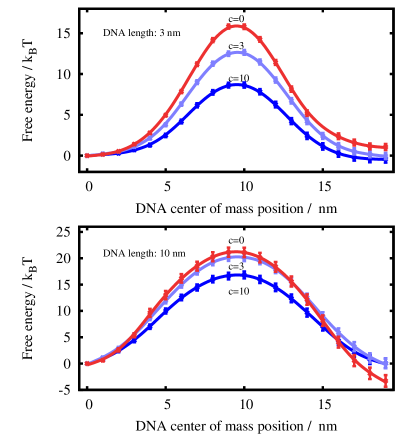
Fig. 1 shows the potential of mean force obtained for all
three salt concentrations taking into account the dielectric boundary
conditions for both DNA lengths. Table 1 summarizes the
barrier heights and the number of ions involved in each
simulation. The potential of mean force forms a bell-shaped barrier
whose height depends on the salt concentration. The height of the
barrier is striking as we obtain for the salt free case at least 15
or 40 kJ/mol for the DNA segments of both sizes. A barrier of
this size would slow down any process by six orders of magnitude.
However the barrier height decreases substantially with increasing salt
concentration. For the short DNA strand the barrier is cut to half
the original height by adding 10 mmol/l monovalent salt. For the
longer DNA strand the decrease of the barrier is smaller. Surprising
is also the fact that the potential of mean force of the short DNA
strand is already more than 1 at 2 nm, where DNA end is
about 4 nm, so six Bjerrum lengths
away from the pore opening.
For simulations without ICC⋆ we observed barriers of 1.5 and 4 for the short and the long DNA strand independent on the salt concentration (not shown). In order to understand this barrier and to gain insight about the role of salt ions in the ICC⋆ case we turn to structural properties of the ion distribution when the DNA is centered in the pore.
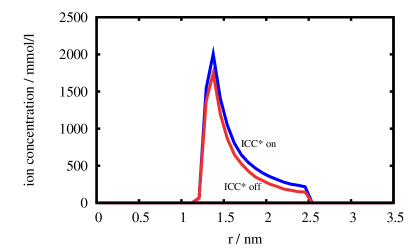
Fig. 2 shows the ion density for the 10 millimolar case
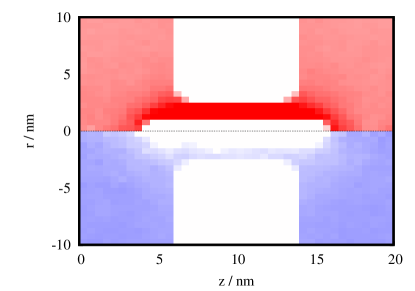
as a function of the radius and the axial coordinate. The counterion density is strongly increased in direct proximity of the DNA. Coions are depleted in the vicinity of the like-charged DNA molecule. An exact investigation of the numbers shows however that far away from the DNA molecule the density of anions and cations is identical. By looking at the radial distribution of coions and counterions in the middle of the pore (fig. 3), it can be seen that the condensed ions exhibit a peak concentration of more than 1.5 mol/l, also for the salt free case. Taking into account the dielectric boundary forces this effect is increased as charge neutralization is amplified. This is similar to the effect that Rabin and Tanaka Rabin and Tanaka (2005) found for smaller pores.
We also observe that the density of counterions does not decay to the bulk value and in fact is higher than 200 mmol/l at the wall both for the salt and the salt-free case. This shows that the pore confinement does not allow the formation of a complete Debye layer, the high charge is thus only partly screened. This leads to a compression of the counterion cloud in vicinity of the pore and to an effective entropic barrier, as observed also in the simulations without ICC⋆.
V Conclusions
In this work we focused on the effect of polarization charges induced by the presence of a dielectric mismatch between the pore and the aqueous environment in which the DNA molecule, its counterions, and salt ions reside. In order to achieve this goal, we employed a coarse-grained model that represents the DNA fragment with overlapping charged beads. The mobile counterions and salt ions were modeled explicitly and the induced surface charges were computed using the recently developed ICC⋆ algorithm.
We computed the potential of mean force across the pore for two polymer lengths (3 and 10 nm) at ionic strength ranging from zero to 10 mmol/l. The polarization contribution to the free energy barrier in the salt-free case is remarkably high. The barrier was found to be about 25 for the longest fragment, whereas it is only 4 in absence of the dielectric boundary force. Polarization effects have been shown to decrease significantly when only a small amount of salt is added to the system. In our model chain fluctuations and deviations from an axial orientation of the DNA molecule have been neglected. However, it is likely that also flexible molecules experience similar barriers. This would strongly affect the kinetics of the translocation process, but this effect can be decreased by increasing the ionic strength of the surrounding solution.
VI Acknowledgements
We gratefully acknowledge financial support by the DFG through SFB716-TP C5. We furthermore thank O. A. Hickey for a critical reading of the manuscript and the ESPResSo team for providing support.
References
- Storm et al. (2005) A. Storm, C. Storm, J. Chen, H. Zandbergen, J. Joanny, and C. Dekker, Nano Lett. 5, 1193 (2005).
- van Dorp et al. (2009) S. van Dorp, U. Keyser, N. Dekker, C. Dekker, and S. Lemay, Nature Physics 5, 347 (2009).
- Fologea et al. (2005) D. Fologea, M. Gershow, B. Ledden, D. McNabb, J. Golovchenko, and J. Li, Nano Lett. 5, 1905 (2005).
- Dekker et al. (2006) N. H. Dekker, R. M. M. Smeets, U. F. Keyser, D. Krapf, M.-Y. Wu, and C. Dekker, Nano Lett. 6, 89 (2006).
- Keyser et al. (2006) U. Keyser, B. Koeleman, S. Van Dorp, D. Krapf, R. Smeets, S. Lemay, N. Dekker, and C. Dekker, Nature Physics 2, 473 (2006).
- Trepagnier et al. (2007) E. Trepagnier, A. Radenovic, D. Sivak, P. Geissler, J. Liphardt, et al., Nano Lett. 7, 2824 (2007).
- Gershow and Golovchenko (2007) M. Gershow and J. Golovchenko, Nature Nanotech. 2, 775 (2007).
- Ghosal (2007) S. Ghosal, Phys. Rev. E 76, 61916 (2007).
- Maglia et al. (2008) G. Maglia, M. R. Restrepo, E. Mikhailova, and H. Bayley, Proceedings of the National Academy of Sciences 105, 19720 (2008).
- Di Marzio and Mandell (1997) E. Di Marzio and A. Mandell, J. Chem. Phys. 107, 5510 (1997).
- Muthukumar (1999) M. Muthukumar, J. Chem. Phys. 111, 10371 (1999).
- Lubensky and Nelson (1999) D. Lubensky and D. Nelson, Biophys. J. 77, 1824 (1999).
- Chuang et al. (2001) J. Chuang, Y. Kantor, and M. Kardar, Phys. Rev. E 65, 11802 (2001).
- Sakaue (2007) T. Sakaue, Phys. Rev. E 76, 21803 (2007).
- Dubbeldam et al. (2007) J. Dubbeldam, A. Milchev, V. Rostiashvili, and T. Vilgis, Europhys. Lett. 79, 18002 (2007).
- Kotsev and Kolomeisky (2007) S. Kotsev and A. Kolomeisky, J. Chem. Phys. 127, 185103 (2007).
- Abdolvahab et al. (2008) R. Abdolvahab, F. Roshani, A. Nourmohammad, M. Sahimi, and M. Tabar, J. Chem. Phys. 129, 235102 (2008).
- Chatelain et al. (2008) C. Chatelain, Y. Kantor, and M. Kardar, Phys. Rev. E 78, 21129 (2008).
- McCauley et al. (2009) M. McCauley, R. Forties, U. Gerland, and R. Bundschuh, Phys. Biol. 6, 036006 (2009).
- Milchev et al. (2004) A. Milchev, K. Binder, and A. Bhattacharya, J. Chem. Phys. 121, 6042 (2004).
- Aksimentiev et al. (2004) A. Aksimentiev, J. Heng, G. Timp, and K. Schulten, Biophys. J. 87, 2086 (2004).
- Matysiak et al. (2006) S. Matysiak, A. Montesi, M. Pasquali, A. Kolomeisky, and C. Clementi, Phys. Rev. Lett. 96, 118103 (2006).
- Luo et al. (2006) K. Luo, T. Ala-Nissila, and S. Ying, J. Chem. Phys. 124, 034714 (2006).
- Fyta et al. (2006) M. Fyta, S. Melchionna, E. Kaxiras, and S. Succi, Multiscale Modeling & Simulation 5, 1156 (2006).
- Luan and Aksimentiev (2008) B. Luan and A. Aksimentiev, Phys. Rev. E 78, 21912 (2008).
- Melchionna et al. (2009) S. Melchionna, M. Bernaschi, M. Fyta, E. Kaxiras, and S. Succi, Phys. Rev. E 79, 30901 (2009).
- Howorka and Siwy (2009) S. Howorka and Z. Siwy, Chemical Society Reviews 38, 2360 (2009).
- Storm et al. (2003) A. Storm, J. Chen, X. Ling, H. Zandbergen, and C. Dekker, Nature materials 2, 537 (2003).
- Branton et al. (1996) D. Branton, J. J. Kasianowicz, E. Brandin, and D. W. Deamer, Proc. Natl. Acad. Sci. U. S. A. 93, 13770 (1996).
- Henrickson et al. (2000) S. Henrickson, M. Misakian, B. Robertson, and J. Kasianowicz, Phys. Rev. Lett. 85, 3057 (2000).
- Lagerqvist et al. (2006) J. Lagerqvist, M. Zwolak, and M. Di Ventra, Nano Lett. 6, 779 (2006).
- Tyagi et al. (submitted) S. Tyagi, M. Süzen, M. Sega, C. Holm, and M. Barbosa, J. Chem. Phys. (submitted).
- Gauthier and Slater (2008) M. Gauthier and G. Slater, Eur. Phys. J. E 25, 17 (2008).
- Gauthier and Slater (2009) M. Gauthier and G. Slater, Phys. Rev. E 79, 21802 (2009).
- Zhang and Shklovskii (2007) J. Zhang and B. Shklovskii, Phys. Rev. E 75, 021906 (2007).
- Bonthuis et al. (2006) D. J. Bonthuis, J. Zhang, B. Hornblower, J. Mathé, B. I. Shklovskii, and A. Meller, Phys. Rev. Lett. 97, 128104 (2006).
- Rabin and Tanaka (2005) Y. Rabin and M. Tanaka, Phys. Rev. Lett. 94, 148103 (2005).
- Guo and Luijten (2009) L. Guo and E. Luijten, Intl. J. Mod. Phys. C 20, 1485 (2009).
- Hockney and Eastwood (1988) R. Hockney and J. Eastwood, Computer simulation using particles (Taylor & Francis, 1988).
- Arnold and Holm (2005) A. Arnold and C. Holm, Adv. Polym. Sci. 185, 59 (2005).
- Deserno and Holm (1998a) M. Deserno and C. Holm, The Journal of Chemical Physics 109, 7694 (1998a).
- Deserno and Holm (1998b) M. Deserno and C. Holm, The Journal of Chemical Physics 109, 7678 (1998b).
- Limbach et al. (2006) H. Limbach, A. Arnold, B. Mann, and C. Holm, Computer Physics Communications 174, 704 (2006).
- Ciccotti et al. (2005) G. Ciccotti, R. Kapral, and E. Vanden-Eijnden, Chemphyschem 6, 1809 (2005).
- Kirkwood (1935) J. G. Kirkwood, The Journal of Chemical Physics 3, 300 (1935).
- Fixman (1978) M. Fixman, The Journal of Chemical Physics 69, 1527 (1978).
- Hartmann and Schütte (2007) C. Hartmann and C. Schütte, Physica D: Nonlinear Phenomena 228, 59 (2007), ISSN 0167-2789.