Concerning the Distance to the Center of the Milky Way and its Structure
Abstract
The distance to the Galactic center inferred from OGLE RR Lyrae variables observed in the direction of the bulge is kpc. An accurate determination of is hindered by countless effects that include an ambiguous extinction law, a bias for smaller values of because of a preferential sampling of variable stars toward the near side of the bulge owing to extinction, and an uncertainty in characterizing how a mean distance to the group of variable stars relates to . A -based period-reddening relation for RR Lyrae variables is derived to map extinction throughout the bulge. The reddening inferred from RR Lyrae variables in the Galactic bulge, LMC, SMC, and IC 1613 match that established from OGLE red clump giants and classical Cepheids. RR Lyrae variables obey a period-colour () relation that is relatively insensitive to metallicity. Edge-on and face-on illustrations of the Milky Way are constructed by mapping the bulge RR Lyrae variables in tandem with cataloged red clump giants, globular clusters, planetary nebulae, classical Cepheids, young open clusters, HII regions, and molecular clouds. The sample of RR Lyrae variables do not trace a prominent Galactic bar or triaxial bulge oriented at .
1 Introduction
Recent estimates of the distance to the center of Milky Way range from kpc (Groenewegen & Blommaert, 2005; Bica et al., 2006; Feast et al., 2008; Groenewegen et al., 2008; Vanhollebeke et al., 2009; Majaess et al., 2009; Matsunaga et al., 2009). The standard error associated with as inferred from variable stars is often smallest owing to sizeable statistics (, se). Yet it remains a challenge to identify and mitigate the dominant source of error, namely the systemic uncertainties. In this study, several effects are discussed that conspire to inhibit an accurate determination of from the photometry of variable stars. RR Lyrae variables detected in the direction of the bulge by OGLE are utilized to estimate the distance to the Galactic center, to map extinction throughout the region surveyed, and to assess the morphology of the Galaxy in harmony with red clump giants and pertinent tracers.
2 Analysis
2.1 Sample & Distribution
The sample of RR Lyrae variables used here is that compiled by Collinge, Sumi, & Fabrycky (2006) from the OGLE survey of Galactic bulge fields (Udalski et al., 1992, 2002; Sumi, 2004). Readers are referred to the comprehensive discussion in Collinge et al. (2006) regarding the construction of the database. Stars exhibiting spurious distances were not included in the present analysis.
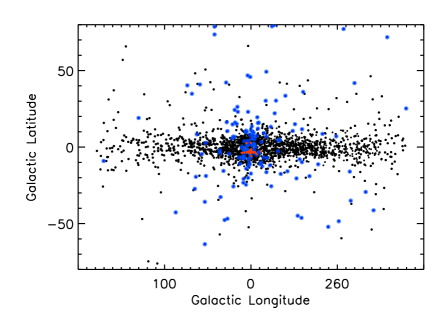
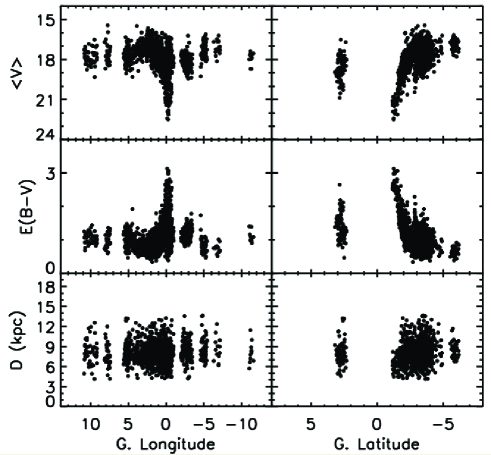
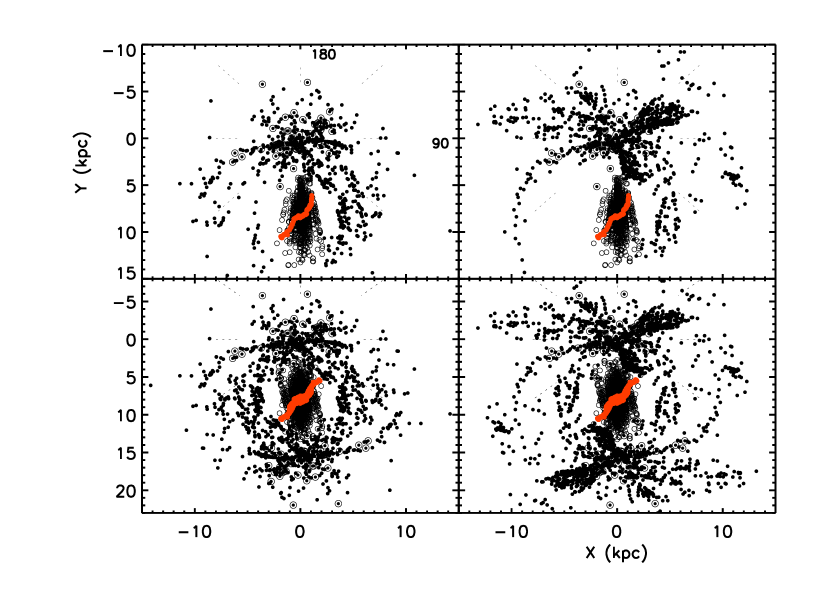
It is instructive to begin by examining the distribution of RR Lyrae variables in position, magnitude, extinction, and distance space. The locations of the variables are mapped on an edge-on model of our Galaxy as illustrated by planetary nebulae and globular clusters (Fig. 1). The distribution of planetary nebulae in Galactic coordinate space was compiled from the catalogs of Kohoutek (2001) and MASH I & II (Parker et al., 2006; Miszalski et al., 2008). Harris (1996) tabulated the relevant data for globular clusters. Planetary nebulae, whose progenitors are primarily old low mass objects, outline the Galactic bulge where their distribution peaks rather clearly (see Fig. 1 of Majaess et al., 2007). RR Lyrae variables are not sampled in areas tied to anomalous extinction near the plane (, Fig. 2), and a similar absence is noted for planetary nebulae (Fig. 1, right).
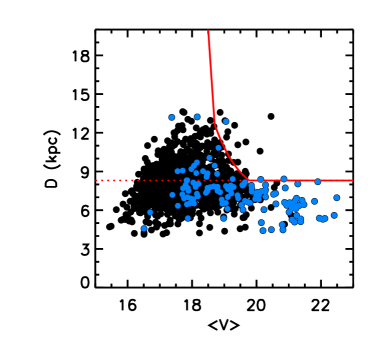
The distribution of the sample’s mean magnitude as a function of Galactic position indicates uneven sampling (Fig. 2). The survey proceeds deeper in tandem with the need to overcome increasing extinction toward the Galactic plane, namely at , at , to at .
2.2 Extinction
Extinction throughout the bulge can be assessed by constructing a period-reddening relation for RR Lyrae variables, in similar fashion to classical Cepheids (Majaess et al., 2008, 2009c). That relation shall also facilitate the mapping of interstellar reddening for regions throughout the Milky Way and beyond. An RR Lyrae variable’s colour excess may be approximated by assuming that:
where , , and are coefficients that can be derived by minimizing the statistic for a calibrating data set, and and are mean photometric magnitudes in different passbands. The calibrators are RR Lyrae variables in the globular clusters M3 (Hartman et al., 2005), M54 (Layden & Sarajedini, 2000), M92 (Kopacki, 2001), and NGC 6441 (Pritzl et al., 2003). Reddenings for the calibrating globular clusters were acquired from various studies (e.g., Harris, 1996; Majaess et al., 2009c). The optimum solution is:
| (1) |
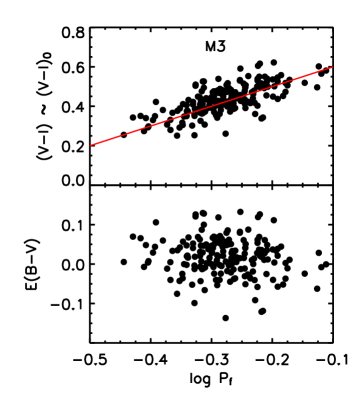
which reproduces the calibrating set with an average uncertainty of magnitude. The true scatter applying to use of the relationship for individual RR Lyrae variables may be larger, particularly for stars near the edge of the instability strip. The relation can provide first order estimates to complement space reddenings (Benedict et al., 2002, 2007; Laney & Caldwell, 2007; Turner, 2010). RR Lyrae variables pulsating in the overtone were shifted by to yield the equivalent fundamental mode period (Walker & Nemec, 1996; Soszynski et al., 2003; Gruberbauer et al., 2007; Hurdis, 2009). Alternatively, M3 offers a unique opportunity to infer the intrinsic colours of RR Lyrae variables directly since foreground extinction along the globular cluster’s line of sight is negligible (McClure & Racine, 1969). Thus a formal fit to photometry of RR Lyrae variables in M3 may be employed to establish reddenings. An interpretation of Benkő et al. (2006) M3 photometry is given in Fig. 3.
Reddenings for locations sampled by the survey are mapped as a function of Galactic position (Fig. 2). The following general trend can be inferred regarding extinction throughout the bulge, namely that it is not symmetric or uniform. For example, across the reddening varies from approximately (Fig. 2). The reddening throughout the entire sample ranges from , with extinction increasing to a maximum near the dust ridden Galactic plane (Fig. 2). The estimated colour-excess is in satisfactory agreement with that inferred by Sumi (2004) from adjacent OGLE red clump giants (Fig. 4).

| Object | Classical Cepheids | RR Lyrae Var. | Red Clump Giants | Zaritsky et al. 2004 | Photometry |
|---|---|---|---|---|---|
| (Udalski et al., 1999) | (Ngeow et al., 2009) | ||||
| LMC | (1,2,6,7,8) | ||||
| SMC | - | (1,3) | |||
| IC1613 | - | - | (4,5) |
Note. — (1) Udalski et al. (1999), (2) Soszynski et al. (2009), (3) Soszynski et al. (2002), (4) Dolphin et al. (2001), (5) Udalski et al. (2001), (6) Soszynski et al. (2008b), (7) Cioni et al. (2000), (8) Massey (2002). The classical Cepheid reddenings are inferred from the Galactic calibration of Majaess et al. (2009c). *** The colour excess varies with position across the Magellanic Clouds and shall be elaborated upon elsewhere.
The robustness of equation 1 may be further evaluated. Drawing upon photometry for RR Lyrae variables in the LMC (Udalski et al., 1998; Soszynski et al., 2003, 2009), SMC (Udalski et al., 1998; Soszynski et al., 2002), and IC 1613 (Dolphin et al., 2001), the resulting mean reddenings for the galaxies are consistent with estimates inferred from red clump giants, a Galactic classical Cepheid relation, and other means (Table 1). That indicates RR Lyrae variables adhere to a period-colour () relation which is relatively insensitive to metallicity. Perhaps an expected result granted the slope of near infrared RR Lyrae variable and Cepheid distance relations are comparatively unaffected by chemical composition (Longmore et al., 1990; Udalski et al., 2001; Bono, 2003b; Pietrzyński et al., 2004; Persson et al., 2004; Sollima et al., 2006; Del Principe et al., 2006; Benedict et al., 2007; van Leeuwen et al., 2007; Fouqué et al., 2007; Matsunaga et al., 2006; Majaess et al., 2008, 2009, 2009c; Majaess, 2009d). By contrast, readers should exhibit caution when employing relations for Cepheid and RR Lyrae variables of differing abundance (Caldwell & Coulson, 1985; Madore & Freedman, 1991; Chiosi et al., 1993; Tammann et al., 2003; Di Criscienzo et al., 2007; Majaess et al., 2008, 2009c). The computed colour-excess of the brightest member of the variable class, RR Lyrae, is . That agrees with both a value cited by Feast et al. (2008) and a field reddening inferred from 2MASS photometry using methods tested elsewhere (Bonatto et al., 2004, 2006; Majaess et al., 2007, 2008; Bonatto & Bica, 2009; Turner et al., 2009b, d; Turner, 2010). The implied absolute magnitude for RR Lyrae is , assuming (eqn. 1) and pc (Benedict et al., 2002; Bono et al., 2002; Majaess, 2009d). To establish the parameters photometry from The Amateur Sky Survey for RR Lyrae was utilized (Droege et al., 2006), although concerns persist regarding the survey’s photometric zeropoint and the star’s modulating amplitude. An ephemeris to phase the & data was adopted from the GEOS RR Lyr database (Boninsegna et al., 2002; Le Borgne et al., 2004, 2007).
2.3 Distance
A Type II Cepheid reddening-free relation is employed to provide distances for the sample of RR Lyrae variables (Eqn. 2, Majaess et al., 2009). Relying exclusively on the photometric surveys of fellow researchers, Majaess (2009d) reaffirmed that to first order SX Phe, RR Lyrae variables, and Type II Cepheids may adhere to a common period-magnitude-colour relation (see also the interesting results of Matsunaga et al., 2006). A Wesenheit diagram and function illustrate the underlying period-magnitude continuity unifying variables of the population II instability strip (Majaess, 2009d), although perhaps somewhat imperfectly. Admittedly, small statistics inhibit an elaborate analysis toward the SX Phe regime and RR Lyrae variables may exhibit a steeper Wesenheit function than Type II Cepheids. However, distances inferred from Eqn. 2 of Majaess et al. (2009) are, however, largely insensitive to that latter putative difference (Fig. 10, see also Majaess 2009d). The slopes of the Wesenheit functions characterizing shorter-period Type II Cepheids and RR Lyrae variables are generally consistent with the predictions of Marconi, Di Criscienzo, & collaborators, underscoring the viability of their research team’s pulsation models. Readers are referred to studies by van den Bergh (1968), Madore (1982), Opolski (1983), Kovacs & Jurcsik (1997); Kovács & Walker (2001), Di Criscienzo, Marconi, & Caputo (2004), Madore & Freedman (1991, 2009), and Turner (2010) for a broader discussion regarding RR Lyrae and Cepheid Wesenheit relations. The calibrators of the Majaess et al. (2009) distance relation were OGLE LMC Type II Cepheids (Udalski et al., 1999; Soszynski et al., 2008), with an adopted zeropoint to the LMC established from classical Cepheids and other means (, Laney & Stobie, 1994; Gibson, 2000; Freedman et al., 2001; Benedict et al., 2002; Majaess et al., 2008; Majaess, 2009d). The classical Cepheid zeropoint to the LMC was inferred from the photometry of Udalski et al. (1999) and Sebo et al. (2002), using the reddening-free distance relation of Majaess et al. (2008). That relation is tied to a restricted subsample of Galactic cluster Cepheids (e.g., Turner & Burke, 2002) and Cepheids with new HST parallaxes (Benedict et al., 2007).
The mean distance to the sample of RR Lyrae variables observed in the direction of the bulge is kpc (). Yet what is the relation to , the distance to the Galactic center? The mean is if the sampling were uniform across a symmetric bulge. However, a fraction of RR Lyrae variables are not sampled equally at the rear and forefront of the bulge. Indeed, as the survey nears the Galactic plane, the effects of extinction increase the magnitude threshold needed to adequately sample the bulge beyond the limit of the survey (Fig. 2, 5). The mean distance inferred from RR Lyrae variables near is kpc, while at larger Galactic latitudes it is approximately a kiloparsec further (Fig. 2, 5). RR Lyrae variables fainter than and nearest to the Galactic plane are not observed beyond kpc (Fig. 5). Establishing from that limited subsample shall yield a result systemically too close. The data were therefore excluded from the derivation of . Majaess et al. (2009) suggested the impact of the bias may be assessed by ascertaining via an alternative approach, namely by adding an estimate for the radius of the bulge to the distance to its near side. Admittedly, that approach introduces new uncertainties and is idealistic granted the bulge may be triaxial (Fig. 6).
Establishing the distance to the Galactic center from either bulge Type II Cepheids (Kubiak & Udalski, 2003; Majaess et al., 2009) or RR Lyrae variables yields an analogous result ( kpc). However, that result depends rather sensitively on the extinction law adopted, particularly since the reddenings are inherently large (Fig. 2). The nature of the extinction law toward the bulge is actively debated and is thus a primary source of uncertainty in the determination of (Gould et al., 2001; Udalski, 2003; Ruffle et al., 2004; Sumi, 2004; Kunder & Chaboyer, 2008). The Majaess et al. (2009) distance relation employed here assumes an extinction law similar to that cited for bulge stars by Udalski (2003). In hindsight, however, perhaps the least squares approach adopted by Majaess et al. (2008, 2009) to obtain the coefficients of the Cepheid (Type I & II) distance relations, which includes an estimate for the pseudo extinction law term, should be forgone in favour of relations derived assuming an extinction law a priori. The matter shall be elaborated upon in a separate study. Nevertheless, the distance derived here to the center of the Milky Way agrees with that inferred by geometric means ( kpc, Vanhollebeke et al., 2009, Table 1). Note, however, that geometric-based estimates of exhibit scatter and non-zero uncertainties, important details which are often overlooked including previously by the author (Majaess et al., 2009).
2.4 Galactic Structure
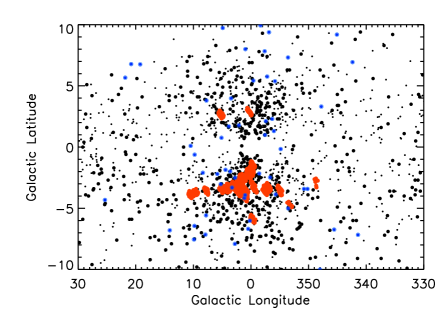
One commonly proposed scenario has the Milky Way exhibiting a bar oriented at along the sun-Galactic center line. The reputed bar typically extends from , being nearer to the Sun for positive . However, RR Lyrae variables do not appear to delineate a prominent bar or triaxial bulge at (Fig. 2, 6). Incidentally, nor is extinction in the region of anomalous, as otherwise expected if observing through a dense thick bar (Fig. 2, 6). A formal fit to the variable star sample binned in yields , which is also in agreement with an axisymmetric distribution (Fig. 6, top). Alcock et al. (1998) and Kunder et al. (2008) likewise note that there is marginal evidence for a bar in the distribution of bulge RR Lyrae variables. Readers are referred to their studies for a comprehensive discussion of the proposed rationale.
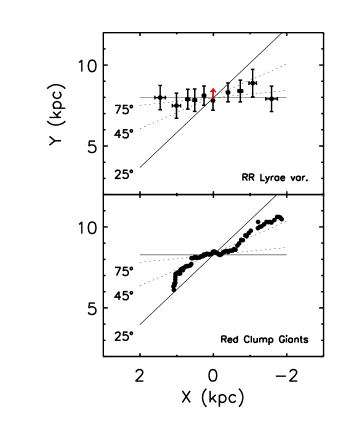
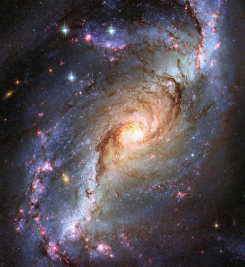
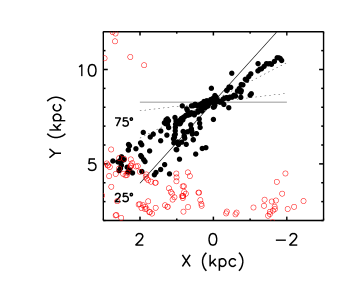
Nishiyama et al. (2005, 2006) infrared survey of red clump giants put forth detailed evidence that the Milky Way exhibits a distinct nuclear structure nested within a primary bar (Fig. 6, middle). Indeed, considering the inner region of the galaxy NGC 1672 as a template (Fig. 6, bottom), the Nishiyama et al. data may imply the presence of two minor pseudo spiral arms or spurs (note the dust lanes) that emanate from a nuclear structure and then reconnect to an underlying primary bar. The nested feature is oriented at an angle () consistent with the distribution of most RR Lyrae variables (Fig. 6). RR Lyrae variables may in part sample that region which is nearly axisymmetric. While the pseudo minor spiral arms connect to a primary bar at . The angle as often cited in the literature may be a mischaracterization or average of two (or multiple) distinct features (Fig. 6, middle). There lacks consensus on defining how that parameter should be ascertained from the data (Fig. 6, middle — e.g., a bulk mean, a mean from tip to tip, a mean for each structure & (preferred), etc.). The observations of Nishiyama et al. are based on high resolution sampling: intervals from at . By contrast, the data in Fig. 6 (top) consist of an admixture of RR Lyrae variables at differing (Fig. 1, 2). That complicates an interpretation of the RR Lyrae distribution since a degeneracy emerges owing to a correlation between distance and Galactic latitude (, Fig. 2). For example, the most distant and deviant point in Fig. 6 (top) is inferred from high latitude bulge variables observed through low extinction (, Fig. 2). Furthermore, Sumi (2004) remarked that the ratio of total to selective extinction may vary weakly as a function of galactic longitude, increasing from positive to negative . The effect on distances becomes magnified granted the reddenings are inherently large toward the Galactic bulge and near the plane. Adopting a mean may tend to produce nearer distances for objects at positive relative to objects at negative . That follows the orientation of the proposed bar. Admittedly, if that bias is real it affects the results derived here for the distribution of bulge RR Lyrae variables.
The red clump giant observations of Nishiyama et al. were adopted verbatim and yet the seminal nature of the implied result demands rigorous scrutiny. Indeed, the reader should know there are countless concerns, as with all distance candles. For example, a compilation of results for red clump giants observed toward the Galactic bulge exhibits unsatisfactory scatter (Fig. 7). The scatter at increasing distance from the Galactic center is exacerbated from sampling spiral features in the young disk (Fig. 7). A separate overview of the conclusions from various red clump giant studies is given in §2.2 & Table 1 of Vanhollebeke et al. (2009). The interpretation and evidence presented by Stanek et al. (1994), Rattenbury et al. (2007), and Cabrera-Lavers et al. (2008) should likewise be considered.
A face-on perspective of the Milky Way (Fig. 8) is now assembled from cataloged RR Lyrae variables (Collinge et al., 2006), red clump giants (Nishiyama et al., 2005, 2006), classical Cepheids (e.g., Szabados, 1977, 1980, 1981; Berdnikov et al., 2000), young open clusters (Dias et al., 2002; Mermilliod & Paunzen, 2003), HII regions & molecular clouds (Hou et al., 2009). Classical Cepheids, young open clusters, HII regions, and molecular clouds trace the Milky Way’s younger spiral arms (Walraven et al., 1958; Bok, 1959; Kraft & Schmidt, 1963; Tammann, 1970; Opolski, 1988; Efremov, 1997; Majaess et al., 2009, 2009b). An overdensity of HII regions and molecular clouds is observed near the interaction between the reputed bar and young disk [X,Y1.5,4 kpc] (Fig. 8). Interestingly, the Sagittarius-Carina arm may emanate from that region since it in part stems or branches from rather than (Majaess et al. 2009, 2009b, see also Fig. 5 in Russeil 2003). Superposed logarithmic spiral patterns ineptly characterize distinct features near the Sun, particularly segments of the putative Orion spur or Local and Sagittarius-Carina arms (Russeil, 2003; Majaess et al., 2009, 2009b; Hou et al., 2009). Added flexibility is needed to consider spurs, and spiral arms that merge, branch, twist unexpectedly, and exhibit a degree of flocculence. Such features are common amongst a sizeable fraction of the Universe’s galaxies, while perfect grand-design spiral patterns are less prevalent (browse the Atlas of Galaxies or Galaxy Zoo Project, Sandage & Bedke 1988; Raddick et al. 2009). Indeed, the commonly espoused scenario of the Sun within a spur indicates that such features are likely not unique, and exist elsewhere throughout the Galaxy. More work is needed here, and a holistic approach that integrates RR Lyrae variable and red clump giant populations into analyses of the Galaxy’s overall structure may facilitate an interpretation.

Complementing the edge-on illustration of the Milky Way displayed earlier (Fig. 1), 2MASS IR observations imply that the Milky Way exhibits a peanut shaped bulge (Fig. 9, see also Weiland et al., 1994). That profile is argued by fellow researchers to indicate a bar seen edge-on (Chung & Bureau, 2004, and references therein). Conversely, the morphology of the Galactic bulge appears somewhat spherical in optical images (Gaposckin, 1960; Brunier & Tapissier, 2009; Mellinger, 2009). However, the bulge assumes a peanut-like geometry once anomalous extinction across the Aquila Rift is accounted for (Straižys et al., 2003; Majaess et al., 2009b, and references therein). Readers are encouraged to correlate CO markers tied to molecular complexes in Aquila and Lupus with the corresponding dark rifts in A. Mellinger’s photographic mosaic of the Galaxy (see Fig. 6 of Dame et al., 2001).
3 Summary & Future Research
In this study, RR Lyrae variables cataloged by Collinge, Sumi, & Fabrycky (2006) from the OGLE survey were used to determine the distance to the Galactic center, to map extinction throughout the sample, and to facilitate an interpretation of the Milky Way’s structure.
The implied distance to the center of the Galaxy is kpc. An accurate determination of is hindered by countless sources. It is insightful to examine a sample’s distribution in position, magnitude, and extinction space, to assess how the mean distance to a group of variable stars detected in the direction of the Galactic bulge relates to (Fig. 1, 2, 5). Extinction imposes a preferential sampling of stars toward the near side of the bulge. Consequently, a mean distance inferred from that restricted subsample shall promote smaller values of . The effect is particularly acute for RR Lyrae variables near the Galactic plane (, Fig. 2), where excessive extinction increases the magnitude threshold needed to adequately sample the bulge beyond the limit of the survey (Fig. 2, 5). Furthermore, the supposed presence of a Galactic bar may bias estimates of depending on which bulge region(s) are sampled. shall be systemically too large if inferred solely from bulge stars at negative that may outline the far side of the reputed Galactic bar (Fig. 6). Caution is warranted when ascertaining from groups of stars exhibiting poor statistics and sampling limited regions of the bulge. Additional concerns persist regarding an ambiguous extinction law for bulge stars (important, Gould et al., 2001; Udalski, 2003; Ruffle et al., 2004; Sumi, 2004; Kunder & Chaboyer, 2008), an uncertainty in the LMC’s zeropoint which is implicitly tied to the -based reddening-free distance relations employed here (Gibson, 2000; Freedman et al., 2001; Benedict et al., 2002; Tammann et al., 2003), an ongoing debate surrounding the contested effects of metallicity for Cepheid and RR Lyrae variables (Udalski et al., 2001; Freedman et al., 2001; Feast, 2003; Smith, 2004; Mottini et al., 2004; Pietrzyński et al., 2004; Romaniello et al., 2005; Sollima et al., 2006; Macri et al., 2006; Bono et al., 2008; Scowcroft et al., 2009; Romaniello et al., 2008; Majaess et al., 2008; Catelan, 2009; Majaess et al., 2009, 2009c; Majaess, 2009d), the effects of photometric contamination (e.g., blending & crowding) on distances computed to variable stars (Stanek & Udalski, 1999; Mochejska et al., 2000, 2001, 2002; Macri, 2001; Freedman et al., 2001; Vilardell et al., 2007; Smith et al., 2007; Majaess et al., 2009c), and floating photometric zeropoints owing to the difficulties in achieving standardization, particularly across a range in colour (e.g., Turner, 1990; Stetson et al., 2004; Saha et al., 2006; Joner et al., 2008). The author suggests the evidence indicates that -based RR Lyrae and Cepheid distance and period-colour relations are relatively insensitive to metallcity, and thus by consequence, that the distance offset observed between metal-rich and metal-poor classical Cepheids occupying the inner and less crowded outer regions of remote galaxies arises primarily from other source(s) (Majaess et al., 2009c; Majaess, 2009d, see also Udalski et al. 2001; Pietrzyński et al. 2004; Bono et al. 2008). Readers are encouraged to also consider the dissenting views and varied interpretations presented in the works cited earlier. Firm constraints on the effects of metallicity, and hence crowding and blending, may arise from a direct comparison of RR Lyrae variables, Type II Cepheids, and classical Cepheids at a common and comparitively nearby zeropoint (e.g., SMC, IC 1613).
The sample of RR Lyrae variables do not trace the signatures of a prominent bar or triaxial bulge oriented at (Fig. 2, 6), as noted previously (Alcock et al., 1998, and references therein). The stars exhibit a more axisymmetric distribution and may outline, in part, a nuclear structure (Fig. 6). A confident interpretation is complicated by the admixture of RR Lyrae variables at varying galactic positions. By contrast, younger red clump giants may delineate a nearly axisymmetric nuclear structure (, Fig. 6) nested within a primary Galactic bar (). Yet there are pertinent concerns with the aforementioned interpretation, and that found in the literature (§2.4, Fig. 6 & 7). First, a compilation of results from several studies on red clump giants exhibits considerable scatter (Fig. 7). The scatter at increasing distance from the center of the Milky Way arises partly from sampling spiral features in the young disk (Fig. 7). Third, as currently cited in the literature may be a mischaracterization or average of two (or multiple) distinct features (e.g., & , Fig. 6). The structure of the Galaxy’s inner region may be too complex to be ascribed a single linear term or angle (Fig. 6). Lastly, curiously, extinction in the region of as inferred from RR Lyrae variables is not anomalous, as otherwise expected if observing through a dense thick bar delineated by red clump giants (Fig. 2, 6).
Edge-on and face-on illustrations of the Milky Way are constructed by mapping the OGLE RR Lyrae variable sample in tandem with cataloged red clump giants, planetary nebulae, globular clusters, classical Cepheids, young open clusters, HII regions, and molecular clouds (Fig. 1, 8). An abundance of HII regions and molecular clouds are observed near the boundary between the reputed Galactic bar and young disk [X,Y1.5,4 kpc] (Fig. 8). Moreover, the Sagittarius-Carina spiral arm may in part originally stem or branch from near that region (Fig. 8).

A -based RR Lyrae period-reddening relation derived here reaffirms that extinction throughout the bulge is highly inhomogeneous, varying from (Eqn. 1 & Fig. 2). RR Lyrae variables, red clump giants, and classical Cepheids provide consistent reddenings for the Galactic bulge, LMC, SMC, and IC 1613 (Table 1). The -based RR Lyrae colour-excess relation appears relatively insensitive to metallicity and may be further refined by obtaining multiband photometry for variables in globular clusters (e.g., Sawyer, 1939; Demers & Wehlau, 1977; Layden et al., 1999; Clement et al., 2001; Pritzl et al., 2003; Horne, 2005; Benkő et al., 2006; Samus et al., 2009). A sizeable portion of the observing program at the Abbey Ridge Observatory (Lane, 2007; Majaess et al., 2008b; Turner et al., 2009a) shall be dedicated to such an endeavour. Modest telescopes may serve a pertinent role in such research (Percy, 1980, 1986; Szabados, 2003; Paczyński, 2006; Genet et al., 2009; Turner et al., 2009a).
RR Lyrae variables follow period-colour and scatter-reduced Wesenheit period-magnitude-colour relations as demonstrated here and elsewhere (Kovacs & Jurcsik, 1997; Kovács & Walker, 2001; Soszynski et al., 2003; Di Criscienzo, Marconi, & Caputo, 2004; Benkő, Bakos, & Nuspl, 2006; Di Criscienzo et al., 2007; Soszynski et al., 2009; Majaess, 2009d). A pertinent example is the RR Lyrae demographic in the globular cluster IC 4499 (Fig. 10, photometry from Walker & Nemec 1996). The Wesenheit function may be inferred without a priori knowledge of the colour-excess, and the distances ensue. Indeed, the Wesenheit function shall be readily employed upon the release of data from the upcoming Gaia survey since the relation may be calibrated directly via parallax and apparent magnitudes, mitigating the propagation of uncertainties tied to extinction corrections (Gaia: Bono, 2003a; Eyer, 2006; Eyer et al., 2009). In the interim, however, further work is needed to scrutinize the Wesenheit approach to investigating RR Lyrae variables, and to shift from a broad outlook to assessing finer details (e.g., is the relation marginally non-linear, particularly toward the RRe regime, etc). Applying a strict [Fe/H]- correlation to infer the distance to individual RR Lyrae variables with differing periods may yield inaccurate results. The [Fe/H]- relation displays considerable spread at a given metallicity (Fig. 1, Pritzl et al., 2000). Abundance estimates often exhibit sizeable random and systemic uncertainties, in contrast to individual pulsation periods. Moreover, the correlation is neither linear or universal (e.g., NGC 6441 & NGC 6388 Pritzl et al., 2000; Bono, 2003b; Catelan, 2009). Applying a strict [Fe/H]- relation to RR Lyrae variables with differing periods at a common zeropoint may yield an acceptable mean distance pending a series of ideal circumstances, including where the overestimated distances for shorter-period variables perfectly balance the underestimated distances of longer period variables (e.g., Majaess et al., 2009c, although remedied in Majaess 2009d via a reddening-free period-magnitude-colour treatment). Admittedly, the aforementioned relation is invaluable in assessing the abundance of a target population to first order, etc. Yet there are also innumerable advantages to employing Wesenheit and period-magnitude relations to characterize RR Lyrae variables (see also Bono, 2003b; Dall’Ora et al., 2004, 2006, 2008; Catelan, 2009).
Lastly, geometric-based distances to the Galactic center (Eisenhauer et al., 2005; Reid et al., 2009), nearby variables (Benedict et al., 2002, 2007; van Leeuwen et al., 2007), open clusters (e.g., Turner & Burke, 2002; Soderblom et al., 2005; van Leeuwen, 2009), globular clusters (e.g., Cen, van de Ven et al., 2006), and the galaxies M33 & M106 (Argon et al., 1998; Brunthaler et al., 2005; Herrnstein et al., 2005): appear to in sum bolster and consolidate the scale established by Cepheids and RR Lyrae variables (Macri et al., 2006; Sarajedini et al., 2006; Majaess et al., 2008; Feast et al., 2008; Feast, 2008; Groenewegen et al., 2008; Scowcroft et al., 2009; Majaess et al., 2009, 2009c; Majaess, 2009d; Turner, 2010). Yet a significant challenge remains to identify and then mitigate the uncertainties beyond the threshold, beyond first order.
acknowledgements
I am grateful to fellow researchers M. Collinge, T. Sumi, S. Nishiyama, L. Hou, J. Benkő, A. Walker, J. Nemec, F. Benedict, G. Kopacki, B. Pritzl, A. Layden, A. Dolphin, A. Sarajedini, J. Hartman, I. Soszyński & the OGLE team, whose comprehensive surveys were the foundation of the study, to the AAVSO (M. Saladyga & A. Henden), CDS, arXiv, NASA ADS, 2MASS, Hubble Heritage, and the RASC. The following works facilitated the preparation of the research: Elmegreen (1985), Alcock et al. (1998), Bono (2003b), Smith (2004), Di Criscienzo et al. (2004), Feast (2008), Cabrera-Lavers et al. (2008), and Marconi (2009).
References
- Alcock et al. (1998) Alcock, C., et al. 1998, ApJ, 492, 190
- Argon et al. (1998) Argon, A. L., Greenhill, L. J., Moran, J. M., Reid, M. J., & Menten, K. M. 1998, IAU Colloq. 164: Radio Emission from Galactic and Extragalactic Compact Sources, 144, 235
- Benedict et al. (2002) Benedict G. F. et al., 2002, AJ, 123, 473
- Benedict et al. (2007) Benedict G. F. et al., 2007, AJ, 133, 1810
- Benkő et al. (2006) Benkő, J. M., Bakos, G. Á., & Nuspl, J. 2006, MNRAS, 372, 1657
- Berdnikov et al. (2000) Berdnikov, L. N., Dambis, A. K., & Vozyakova, O. V. 2000, A&AS, 143, 211
- Berdnikov et al. (2006) Berdnikov, L. N., Efremov, Y. N., Glushkova, E. V., & Turner, D. G. 2006, Odessa Astronomical Publications, 18, 26
- Bica et al. (2006) Bica, E., Bonatto, C., Barbuy, B., & Ortolani, S. 2006, A&A, 450, 105
- Bok (1959) Bok, B. J. 1959, The Observatory, 79, 58
- Bonatto et al. (2004) Bonatto, C., Bica, E., & Girardi, L. 2004, A&A, 415, 571
- Bonatto et al. (2006) Bonatto, C., Bica, E., Ortolani, S., & Barbuy, B. 2006, A&A, 453, 121
- Bonatto & Bica (2009) Bonatto, C., & Bica, E. 2009, MNRAS, 397, 1915
- Boninsegna et al. (2002) Boninsegna, R., Vandenbroere, J., Le Borgne, J. F., & The Geos Team 2002, IAU Colloq. 185: Radial and Nonradial Pulsationsn as Probes of Stellar Physics, 259, 166
- Bono et al. (2002) Bono, G., Caputo, F., Castellani, V., Marconi, M., & Storm, J. 2002, MNRAS, 332, L78
- Bono (2003a) Bono, G. 2003 (a), GAIA Spectroscopy: Science and Technology, 298, 245
- Bono (2003b) Bono, G. 2003 (b), Stellar Candles for the Extragalactic Distance Scale, 635, 85
- Bono et al. (2008) Bono, G., Caputo, F., Fiorentino, G., Marconi, M., & Musella, I. 2008, ApJ, 684, 102
- Brunier & Tapissier (2009) Brunier, S., Tapissier, F., ESO GigaGalaxy Zoom Team, 2009. APOD, http://apod.nasa.gov/apod/ap090926.html , Nemiroff & Bonnell (1995)
- Brunthaler et al. (2005) Brunthaler, A., Reid, M. J., Falcke, H., Greenhill, L. J., & Henkel, C. 2005, Science, 307, 1440
- Cabrera-Lavers et al. (2008) Cabrera-Lavers, A., González-Fernández, C., Garzón, F., Hammersley, P. L., & López-Corredoira, M. 2008, A&A, 491, 781
- Caldwell & Coulson (1985) Caldwell, J. A. R., & Coulson, I. M. 1985, MNRAS, 212, 879
- Catelan (2009) Catelan, M. 2009, Ap&SS, 320, 261
- Chiosi et al. (1993) Chiosi, C., Wood, P. R., & Capitanio, N. 1993, ApJS, 86, 541
- Chung & Bureau (2004) Chung, A., & Bureau, M. 2004, AJ, 127, 3192
- Cioni et al. (2000) Cioni, M.-R., et al. 2000, A&AS, 144, 235
- Clement et al. (2001) Clement, C. M., et al. 2001, AJ, 122, 2587
- Collinge et al. (2006) Collinge, M. J., Sumi, T., & Fabrycky, D. 2006, ApJ, 651, 197
- Cutri et al. (2003) Cutri, R. M., et al. 2003, The IRSA 2MASS All-Sky Point Source Catalog, NASA/IPAC Infrared Science Archive. http://irsa.ipac.caltech.edu/applications/Gator/
- Dall’Ora et al. (2004) Dall’Ora, M., et al. 2004, ApJ, 610, 269
- Dall’Ora et al. (2006) Dall’Ora, M., et al. 2006, Memorie della Societa Astronomica Italiana, 77, 214
- Dall’Ora et al. (2008) Dall’Ora, M., et al. 2008, Memorie della Societa Astronomica Italiana, 79, 355
- Dame et al. (2001) Dame, T. M., Hartmann, D., & Thaddeus, P. 2001, ApJ, 547, 792
- Del Principe et al. (2006) Del Principe, M., et al. 2006, ApJ, 652, 362
- Demers & Wehlau (1977) Demers, S., & Wehlau, A. 1977, AJ, 82, 620
- Dias et al. (2002) Dias, W. S., Alessi, B. S., Moitinho, A., & Lépine, J. R. D. 2002, A&A, 389, 871
- Di Criscienzo et al. (2004) Di Criscienzo, M., Marconi, M., & Caputo, F. 2004, ApJ, 612, 1092
- Di Criscienzo et al. (2007) Di Criscienzo, M., Caputo, F., Marconi, M., & Cassisi, S. 2007, A&A, 471, 893
- Dolphin et al. (2001) Dolphin, A. E., et al. 2001, ApJ, 550, 554
- Droege et al. (2006) Droege T. F., Richmond M. W., Sallman M. P., Creager R. P., 2006, PASP, 118, 1666
- Eisenhauer et al. (2005) Eisenhauer, F., et al. 2005, ApJ, 628, 246
- Efremov (1997) Efremov, Y. N. 1997, Astronomy Letters, 23, 579
- Elmegreen (1985) Elmegreen, D. M. 1985, The Milky Way Galaxy, 106, 255
- Eyer & Mignard (2005) Eyer, L., & Mignard, F. 2005, MNRAS, 361, 1136
- Eyer (2006) Eyer, L. 2006, Memorie della Societa Astronomica Italiana, 77, 549
- Eyer et al. (2009) Eyer, L., Mowlavi, N., Varadi, M., Spano, M., Lecoeur-Taibi, I., & Clementini, G. 2009, SF2A-2009: Proceedings of the Annual meeting of the French Society of Astronomy and Astrophysics, held 29 June - 4 July 2009 in Besançon, France. Eds.: M. Heydari-Malayeri, C. Reylé and R. Samadi, p.45, 45
- Feast (2003) Feast, M. 2003, Stellar Candles for the Extragalactic Distance Scale, 635, 45
- Feast et al. (2008) Feast M. W., Laney C. D., Kinman T. D., van Leeuwen F., Whitelock P. A., 2008, MNRAS, 386, 2115
- Feast (2008) Feast, M. W. 2008, arXiv:0806.3019
- Freedman et al. (2001) Freedman W. L. et al., 2001, ApJ, 553, 47
- Fouqué et al. (2007) Fouqué P. et al., 2007, A&A, 476, 73
- Gaposckin (1960) Gaposckin, S. 1960, Vistas in Astronomy, 3, 289
- Genet et al. (2009) Genet, R. M., Johnson, J. M., Wallen, V., 2009, Small Telescopes and Astronomical Research, Collins Foundation Press.
- Gibson (2000) Gibson, B. K. 2000, Memorie della Societa Astronomica Italiana, 71, 693
- Gould et al. (2001) Gould, A., Stutz, A., & Frogel, J. A. 2001, ApJ, 547, 590
- Groenewegen & Blommaert (2005) Groenewegen, M. A. T., & Blommaert, J. A. D. L. 2005, A&A, 443, 143
- Groenewegen et al. (2008) Groenewegen M. A. T., Udalski A., Bono, G., 2008, A&A, 481, 441
- Gruberbauer et al. (2007) Gruberbauer, M., et al. 2007, MNRAS, 379, 1498
- Harris (1996) Harris, W. E. 1996, AJ, 112, 1487
- Hartman et al. (2005) Hartman, J. D., Kaluzny, J., Szentgyorgyi, A., & Stanek, K. Z. 2005, AJ, 129, 1596
- Herrnstein et al. (2005) Herrnstein J. R., Moran J. M., Greenhill L. J., Trotter A.S., 2005, ApJ, 629, 719
- Horne (2005) Horne, J. D. 2005, Journal of the American Association of Variable Star Observers (JAAVSO), 34, 61
- Hou et al. (2009) Hou, L. G., Han, J. L., & Shi, W. B. 2009, A&A, 499, 473
- Hurdis (2009) Hurdis, D. A. 2009, Journal of the American Association of Variable Star Observers (JAAVSO), 37, 28
- Joner et al. (2008) Joner, M. D., Taylor, B. J., Laney, C. D., & van Wyk, F. 2008, AJ, 136, 1546
- Kopacki (2001) Kopacki, G. 2001, A&A, 369, 862
- Kohoutek (2001) Kohoutek L., 2001, A&A, 378, 843
- Kovacs & Jurcsik (1997) Kovacs, G., & Jurcsik, J. 1997, A&A, 322, 218
- Kovács & Walker (2001) Kovács, G., & Walker, A. R. 2001, A&A, 371, 579
- Kraft & Schmidt (1963) Kraft R. P., Schmidt M., 1963, ApJ, 137, 249
- Kubiak & Udalski (2003) Kubiak M., Udalski A., 2003, Acta Astr., 53, 117
- Kunder & Chaboyer (2008) Kunder, A., & Chaboyer, B. 2008, AJ, 136, 2441
- Kunder et al. (2008) Kunder, A., Popowski, P., Cook, K. H., & Chaboyer, B. 2008, AJ, 135, 631
- Lane (2007) Lane D. J., 2007, 96th Spring Meeting of the AAVSO, http://www.aavso.org/aavso/meetings/spring07present/Lane.ppt
- Laney & Stobie (1994) Laney, C. D., & Stobie, R. S. 1994, MNRAS, 266, 441
- Laney & Caldwell (2007) Laney, C. D., & Caldwell, J. A. R. 2007, MNRAS, 377, 147
- Layden et al. (1999) Layden, A. C., Ritter, L. A., Welch, D. L., & Webb, T. M. A. 1999, AJ, 117, 1313
- Layden & Sarajedini (2000) Layden, A. C., & Sarajedini, A. 2000, AJ, 119, 1760
- Le Borgne et al. (2004) Le Borgne, J. F., Klotz, A., & Boer, M. 2004, IBVS, 5568, 1
- Le Borgne et al. (2007) Le Borgne, J. F., et al. 2007, A&A, 476, 307
- Longmore et al. (1990) Longmore, A. J., Dixon, R., Skillen, I., Jameson, R. F., & Fernley, J. A. 1990, MNRAS, 247, 684
- Macri (2001) Macri, L. M., 2001, Ph.D. Thesis
- Macri et al. (2006) Macri, L. M., Stanek, K. Z., Bersier, D., Greenhill, L. J., & Reid, M. J. 2006, ApJ, 652, 1133
- Madore (1982) Madore B. F., 1982, ApJ, 253, 575
- Madore & Freedman (1991) Madore, B. F., & Freedman, W. L. 1991, PASP, 103, 933
- Madore & Freedman (2009) Madore, B. F., & Freedman, W. L. 2009, ApJ, 696, 1498
- Majaess et al. (2007) Majaess D. J., Turner D. G., Lane D. J., 2007, PASP, 119, 1349
- Majaess et al. (2008) Majaess D. J., Turner D. G., Lane D. J., 2008, MNRAS, 390, 1539
- Majaess et al. (2008b) Majaess D. J., Turner D. G., Lane D. J., Moncrieff K. E., 2008 (b), JAAVSO, 36, 90
- Majaess et al. (2009) Majaess, D. J., Turner, D. G., & Lane, D. J. 2009, MNRAS, 398, 263
- Majaess et al. (2009b) Majaess, D. J., Turner, D. G., & Lane, D. J. 2009 (b), Journal of the American Association of Variable Star Observers (JAAVSO), 37, 179
- Majaess et al. (2009c) Majaess, D., Turner, D., & Lane, D. 2009 (c), Acta Astronomica, 59, 403
- Majaess (2009d) Majaess, D. J. 2009, arXiv:0912.2928
- Marconi & Di Criscienzo (2007) Marconi, M., & Di Criscienzo, M. 2007, A&A, 467, 223
- Marconi (2009) Marconi, M. 2009, arXiv:0909.0900
- Massey (2002) Massey, P. 2002, ApJS, 141, 81
- Matsunaga et al. (2006) Matsunaga, N., et al. 2006, MNRAS, 370, 1979
- Matsunaga et al. (2009) Matsunaga, N., Kawadu, T., Nishiyama, S., Nagayama, T., Hatano, H., Tamura, M., Glass, I. S., & Nagata, T. 2009, MNRAS, 399, 1709
- McClure & Racine (1969) McClure, R. D., & Racine, R. 1969, AJ, 74, 1000
- Mellinger (2009) Mellinger, A. 2009, arXiv:0908.4360
- Mermilliod & Paunzen (2003) Mermilliod, J.-C., & Paunzen, E. 2003, A&A, 410, 511
- Minniti et al. (2010) Minniti, D., et al. 2010, New Astronomy, 15, 433
- Miszalski et al. (2008) Miszalski, B., Parker, Q. A., Acker, A., Birkby, J. L., Frew, D. J., & Kovacevic, A. 2008, MNRAS, 384, 525
- Mochejska et al. (2000) Mochejska, B. J., Macri, L. M., Sasselov, D. D., & Stanek, K. Z. 2000, AJ, 120, 810
- Mochejska et al. (2001) Mochejska, B. J., Macri, L. M., Sasselov, D. D., & Stanek, K. Z. 2001, arXiv:astro-ph/0103440
- Mochejska et al. (2002) Mochejska, B. J., 2002, , Ph.D. Thesis
- Mottini et al. (2004) Mottini, M., Romaniello, M., Primas, F., Groenewegen, M., Bono, G., & Francois, P. 2004, arXiv:astro-ph/0411190
- Nemiroff & Bonnell (1995) Nemiroff, R. J., & Bonnell, J. T. 1995, Bulletin of the American Astronomical Society, 27, 1291
- Ngeow et al. (2009) Ngeow, C.-C., Kanbur, S. M., Neilson, H. R., Nanthakumar, A., & Buonaccorsi, J. 2009, ApJ, 693, 691
- Nishiyama et al. (2005) Nishiyama, S., et al. 2005, ApJ, 621, L105
- Nishiyama et al. (2006) Nishiyama, S., Nagata, T., & IRSF/SIRIUS team 2006, Journal of Physics Conference Series, 54, 62
- Opolski (1983) Opolski A., 1983, IBVS, 2425, 1
- Opolski (1988) Opolski, A. 1988, Acta Astronomica, 38, 375
- Paczyński (2006) Paczyński, B. 2006, PASP, 118, 1621
- Parker et al. (2006) Parker, Q. A., et al. 2006, MNRAS, 373, 79
- Percy (1980) Percy J. R., 1980, JRASC, 74, 334
- Percy (1986) Percy, J. R. 1986, Study of Variable Stars using Small Telescopes
- Persson et al. (2004) Persson, S. E., Madore, B. F., Krzemiński, W., Freedman, W. L., Roth, M., & Murphy, D. C. 2004, AJ, 128, 2239
- Pietrzyński et al. (2004) Pietrzyński, G., Gieren, W., Udalski, A., Bresolin, F., Kudritzki, R.-P., Soszyński, I., Szymański, M., & Kubiak, M. 2004, AJ, 128, 2815
- Pritzl et al. (2000) Pritzl, B., Smith, H. A., Catelan, M., & Sweigart, A. V. 2000, ApJ, 530, L41
- Pritzl et al. (2003) Pritzl B. J., Smith H. A., Stetson P. B., Catelan M., Sweigart A. V., Layden A. C., Rich R. M., 2003, AJ, 126, 1381
- Raddick et al. (2009) Raddick, M. J., Bracey, G., Gay, P. L., Lintott, C. J., Murray, P., Schawinski, K., Szalay, A. S., & Vandenberg, J. 2009, arXiv:0909.2925
- Rattenbury et al. (2007) Rattenbury, N. J., Mao, S., Sumi, T., & Smith, M. C. 2007, MNRAS, 378, 1064
- Reid et al. (2009) Reid, M. J., Menten, K. M., Zheng, X. W., Brunthaler, A., & Xu, Y. 2009, arXiv:0908.3637
- Romaniello et al. (2005) Romaniello, M., Primas, F., Mottini, M., Groenewegen, M., Bono, G., & François, P. 2005, A&A, 429, L37
- Romaniello et al. (2008) Romaniello, M., et al. 2008, A&A, 488, 731
- Ruffle et al. (2004) Ruffle, P. M. E., Zijlstra, A. A., Walsh, J. R., Gray, M. D., Gesicki, K., Minniti, D., & Comeron, F. 2004, MNRAS, 353, 796
- Russeil (2003) Russeil, D. 2003, A&A, 397, 133
- Saha et al. (2006) Saha, A., Thim, F., Tammann, G. A., Reindl, B., & Sandage, A. 2006, ApJS, 165, 108
- Samus et al. (2009) Samus, N. N., Kazarovets, E. V., Pastukhova, E. N., Tsvetkova, T. M., & Durlevich, O. V. 2009, PASP, 121, 1378
- Sandage & Bedke (1988) Sandage, A., & Bedke, J. 1988, NASA Special Publication, 496,
- Sarajedini et al. (2006) Sarajedini, A., Barker, M. K., Geisler, D., Harding, P., & Schommer, R. 2006, AJ, 132, 1361
- Sawyer (1939) Sawyer, H. B. 1939, Publications of the David Dunlap Observatory, 1, 125
- Scowcroft et al. (2009) Scowcroft, V., Bersier, D., Mould, J. R., & Wood, P. R. 2009, MNRAS, 396, 1287
- Sebo et al. (2002) Sebo, K. M., et al. 2002, ApJS, 142, 71
- Smith (2004) Smith, H. A. 2004, RR Lyrae Stars, by Horace A. Smith, pp. 166. ISBN 0521548179. Cambridge, UK: Cambridge University Press, September 2004
- Smith et al. (2007) Smith, M. C., Woźniak, P., Mao, S., & Sumi, T. 2007, MNRAS, 380, 805
- Soderblom et al. (2005) Soderblom, D. R., Nelan, E., Benedict, G. F., McArthur, B., Ramirez, I., Spiesman, W., & Jones, B. F. 2005, AJ, 129, 1616
- Sollima et al. (2006) Sollima, A., Cacciari, C., & Valenti, E. 2006, MNRAS, 372, 1675
- Soszynski et al. (2002) Soszynski, I., et al. 2002, Acta Astronomica, 52, 369
- Soszynski et al. (2003) Soszynski, I., et al. 2003, Acta Astronomica, 53, 93
- Soszynski et al. (2008) Soszynski, I., et al. 2008, Acta Astronomica, 58, 293
- Soszynski et al. (2008b) Soszynski, I., et al. 2008 (b), Acta Astronomica, 58, 163
- Soszynski et al. (2009) Soszynski, I., et al. 2009, Acta Astronomica, 59, 1
- Stanek et al. (1994) Stanek, K. Z., Mateo, M., Udalski, A., Szymanski, M., Kaluzny, J., & Kubiak, M. 1994, ApJ, 429, L73
- Stanek & Udalski (1999) Stanek, K. Z., & Udalski, A. 1999, arXiv:astro-ph/9909346
- Stetson et al. (2004) Stetson, P. B., McClure, R. D., & VandenBerg, D. A. 2004, PASP, 116, 1012
- Straižys et al. (2003) Straižys, V., Černis, K., & Bartašiūtė, S. 2003, A&A, 405, 585
- Sumi (2004) Sumi, T. 2004, MNRAS, 349, 193
- Szabados (1977) Szabados, L. 1977, Commmunications of the Konkoly Observatory Hungary, 70, 1
- Szabados (1980) Szabados, L. 1980, Commmunications of the Konkoly Observatory Hungary, 76, 1
- Szabados (1981) Szabados, L. 1981, Commmunications of the Konkoly Observatory Hungary, 77, 1
- Szabados (2003) Szabados, L. 2003, Astrophysics and Space Science Library, 289, 207
- Tammann (1970) Tammann, G. A. 1970, The Spiral Structure of our Galaxy, 38, 236
- Tammann et al. (2003) Tammann, G. A., Sandage, A., & Reindl, B. 2003, A&A, 404, 423
- Turner (1990) Turner, D. G. 1990, PASP, 102, 1331
- Turner & Burke (2002) Turner D. G., Burke J. F., 2002, AJ, 124, 2931
- Turner (2010) Turner, D. G. 2010, Ap&SS, 326, 219
- Turner et al. (2009a) Turner, D. G., Majaess, D. J., Lane, D. J., Szabados, L., Kovtyukh, V. V., Usenko, I. A., & Berdnikov, L. N. 2009 (a), American Institute of Physics Conference Series, 1170, 108
- Turner et al. (2009b) Turner, D. G., Kovtyukh, V. V., Majaess, D. J., Lane, D. J., & Moncrieff, K. E. 2009 (b), Astronomische Nachrichten, 330, 807
- Turner et al. (2009d) Turner, D. G., Forbes, D., Leonard, P. J. T., Abdel-Latif, M. A.-S., Majaess, D. J., & Berdnikov, L. N. 2009, MNRAS(c), 397, 1046
- Udalski et al. (1992) Udalski, A., Szymanski, M., Kaluzny, J., Kubiak, M., & Mateo, M. 1992, Acta Astronomica, 42, 253
- Udalski et al. (1998) Udalski, A., Szymanski, M., Kubiak, M., Pietrzynski, G., Wozniak, P., & Zebrun, K. 1998, Acta Astronomica, 48, 1
- Udalski (1998) Udalski, A. 1998 (b), Acta Astronomica, 48, 113
- Udalski et al. (1999) Udalski A. et al., 1999, Acta Astr., 49, 223
- Udalski et al. (2001) Udalski, A., Wyrzykowski, L., Pietrzynski, G., Szewczyk, O., Szymanski, M., Kubiak, M., Soszynski, I., & Zebrun, K. 2001, Acta Astronomica, 51, 221
- Udalski et al. (2002) Udalski, A., et al. 2002, Acta Astronomica, 52, 217
- Udalski (2003) Udalski, A. 2003, ApJ, 590, 284
- Vanhollebeke et al. (2009) Vanhollebeke, E., Groenewegen, M. A. T., & Girardi, L. 2009, A&A, 498, 95
- van den Bergh (1968) van den Bergh S., 1968, JRASC, 62, 145
- van de Ven et al. (2006) van de Ven, G., van den Bosch, R. C. E., Verolme, E. K., & de Zeeuw, P. T. 2006, A&A, 445, 513
- van Leeuwen et al. (2007) van Leeuwen, F., Feast, M. W., Whitelock, P. A., & Laney, C. D. 2007, MNRAS, 379, 723
- van Leeuwen (2009) van Leeuwen, F. 2009, A&A, 497, 209
- Vilardell et al. (2007) Vilardell, F., Jordi, C., & Ribas, I. 2007, A&A, 473, 847
- Walker & Nemec (1996) Walker, A. R., & Nemec, J. M. 1996, AJ, 112, 2026
- Walraven et al. (1958) Walraven, T., Muller, A. B., & Oosterhoff, P. T. 1958, Bull. Astron. Inst. Netherlands, 14, 81
- Weiland et al. (1994) Weiland, J. L., et al. 1994, ApJ, 425, L81
- Zaritsky et al. (2004) Zaritsky, D., Harris, J., Thompson, I. B., & Grebel, E. K. 2004, AJ, 128, 1606