Absence of magnetic phase separation in MnSi under pressure
Abstract
We report muon spin spectroscopy data (SR) obtained under hydrostatic pressure on a large single crystal of the itinerant helimagnet MnSi, and recorded down to and up to . Up to the critical pressure kbar, where the magnetic order is suppressed, the SR data unambiguously demonstrate that the ground state of the system is magnetic with no indication of any phase separation.
pacs:
75.30.-m,, 71.20.Lp, 76.75.+iThe strongly correlated intermetallic cubic compound MnSi has been known for a long time to order magnetically below in a long period helical structure. Williams et al. (1966); Ishikawa et al. (1976) The first-order nature of the transition has only been demonstrated quite recently.Stishov et al. (2008); Petrova and Stishov (2009) The study of the effect of pressure on the magnetic phase has shown that the transition temperature decreases with pressure, remaining first order, and tending to zero at . Thompson et al. (1989); Petrova et al. (2009)
It is well known that phase separation might occur near the temperature of a first order-phase transition. Previous muon spin rotation and relaxation (SR) experiments by Uemura and coworkers indicated a Magnetic Phase Separation (MPS) in MnSi.Uemura et al. (2007) Prior to the SR work, a Nuclear Magnetic Resonance (NMR) study suggested MPS in the same pressure range just below .Yu et al. (2004) However, since the NMR sample had to be powderized, strains problems could induce extrinsic MPS. Hence, probing a single crystal, as it has been done in Ref. Uemura et al., 2007, is certainly an advantage. However, the validity of the conclusions drawn from these measurements can be questioned since, according to Fig. 2c of Ref. Uemura et al., 2007, solely one spontaneous frequency was detected below rather than two, as expected from previous ambient pressure measurements.Kadono et al. (1990) In addition, the measurements were performed only down to , which might be an issue when studying the behaviour of the system near where goes to 0.
To clarify such issues, we have carried out a series of accurate SR experiments under pressure down to on a large MnSi single crystal. The main result of our study is that, up to and at low temperatures, the full sample volume becomes magnetic. Therefore, despite the first order nature of the phase transition that is clearly confirmed by our data, no phase separation is detected in MnSi.
Due to its unique sensitivity to slow spin fluctuations and its local probe character providing the possibility to distinguish paramagnetic and magnetically ordered volume fractions,Dalmas de Réotier and Yaouanc (1997); Amato (1997); Dalmas de Réotier et al. (2004); Amato et al. (2004) no matter the compound chemical composition, the SR spectroscopy is well suited to probe whether MPS is effectively an intrinsic property of MnSi. Since our main interest was on the existence of MPS, most of the SR measurements were performed with the so-called Weak-Transverse-Field (WTF) method, which is well adapted to determine the magnetic volume fraction. A small field, in our case, is applied perpendicular to the muon polarization . The depolarization function for the muons stopping in the sample is then the sum of two precessing components. While the one which arises from the paramagnetic volume precesses at a frequency associated to the applied field and is weakly damped, the other one related to muons stopped in the magnetically ordered phase, precesses at a frequency corresponding to the spontaneous field and exhibits a strong depolarization. This latter damping stems from the relatively large magnetic field distribution at the muon site inherent to an ordered magnetic state. By carefully determining the amplitude of these components, the volume ratio between the magnetic and paramagnetic phases can be accurately determined as a function of temperature and pressure. Measurements in zero applied magnetic field were also performed at different pressures.
The SR measurements were carried out at the General Purpose Decay-Channel (GPD) spectrometer of the Swiss Muon Source (SS, Paul Scherrer Institute, Villigen, Switzerland).
A detailed description of the pressure cell used for the SR measurements is given elsewhere.Andreica (2001); Sakarya et al. (2010) Relative to previous works, some improvements were made. The pressure cell was mounted either on the sample stick of a Janis 4He-flow cryostat or on the cold finger of an Oxford Instrument 3He cryostat. The temperature range from down to could hence be covered. The extension to low temperature by more than an order of magnitude relative to previous SR work Uemura et al. (2007) is a key ingredient to unravel the new features reported in the present study. For each pressure in this study, the exact pressure applied on the sample was measured in situ at low temperature using the pressure dependence of the superconducting transition temperatures of small pieces of either In or Pb placed inside the pressure cell. It is worth mentioning that the pressure determination was performed at similar temperatures as the SR measurements themselves. The pressure transmitting medium was a 1:1 mixture of n-pentane and isoamyl alcohol which is known for the excellent hydrostaticity conditions it provides in our pressure range of interest and for the absence of hysteresis effects.Butch et al. (2009)
The MnSi sample was a cylinder of diameter and length cut from a single crystal prepared similarly as the one used in previously published ambient pressure SR measurements,Yaouanc et al. (2005) elastic neutron scattering investigation under pressureFåk et al. (2005) and thermal expansion studiesMiyake et al. (2009) under pressure. The single crystal was grown by the Czochralsky pulling technique from a stoichiometric melt of high purity elements () using radio-frequency heating and a cold copper crucible. The residual resistivity ratio of such prepared crystals is about 40. Scanning electron microscope microanalysis and backscattered electron images reveal neither any deviation from the known crystal structure nor any presence of foreign phase. The possibility for off-stoichiometry was carefully investigated by examining the polycrystalline ingot remaining after a pulling especially designed to consume 99 % of the initial load, instead of 25 % for normal growth. No sizeable fraction of any foreign phase was found in the remaining ingot, confirming a stoichiometry in the ratio 1:1 in our MnSi single crystal.
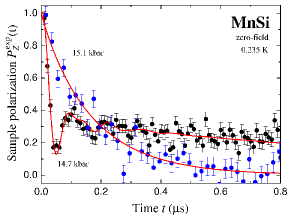
In Fig. 1 a zero-field SR spectrum
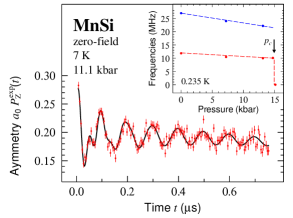
recorded at under is reported. It serves to display the sample and pressure quality. The beating of the expected two oscillating components is clearly seen. Had the field distribution in the sample been large, due for example to a large pressure gradient or sample inhomogeneity, the higher frequency would not have been detected. Note that this higher frequency precession was not observed in the previous SR work under pressure.Uemura et al. (2007) The pressure dependence of the two low temperature spontaneously precessing frequencies, which reflect the pressure dependence of the order parameter, is displayed in the insert of Fig. 1. An abrupt change is observed between 14.7 and 15.1 kbar, confirming the first order nature of the phase transition. Belitz and coworkers predicted this type of transition to occur in weak ferromagnets.Belitz et al. (1999)
Examples of WTF spectra are shown in Fig. 2.
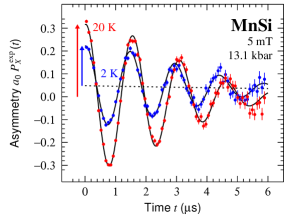
Muons stopped both in the pressure cell and in the MnSi crystal contribute to them. The muons implanted in paramagnetic MnSi and in the (non magnetic) pressure cell precess at a frequency which differs from only by a small Knight shift; = 851.6 Mrad.s-1.T-1 is the muon gyromagnetic ratio. Muons stopped in magnetically ordered MnSi precess at a much higher frequency (see Fig. 1 and note the time scale). Since at low temperature and room pressure it is known that the whole volume of MnSi is magnetically ordered, it is simple matter to derive the pressure cell contribution to the signal. It is then possible to determine the MnSi magnetic volume fraction. The results are shown in Fig. 3 as a function of temperature and pressure.
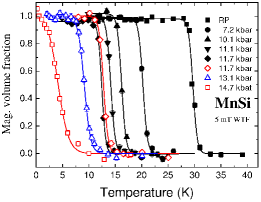
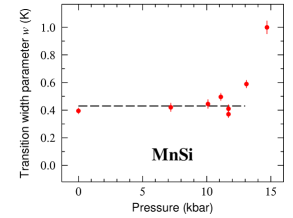
The most obvious feature is that the whole sample volume is magnetically ordered at low temperature for all the applied pressures. The magnetic volume fraction is fitted to the phenomenological law . With this formula, for a given pressure, is the temperature at which half of the sample volume is magnetic. The pressure dependence of will be shown and compared to the literature results in Fig. 6. Up to 13 kbar, the width of the transition observed in Fig. 3 is relatively narrow, pressure independent and about two times narrower than previously reported. Uemura et al. (2007) The data taken at single out themselves: the transition width is more pronounced. This trend if confirmed in Fig. 4 by the plot of the fit parameter which is proportional to the width of the magnetic transition.
We present in Fig. 5 two zero-field spectra recorded at 14.7 and 15.1 kbar, respectively.
The pressure at which the spontaneous SR frequencies disappear from the SR spectra at low temperatures is taken as the critical pressure , where the magnetic ground state is suppressed.
The pressure dependence of the low temperature magnetic volume fraction derived from our measurements as well as of the critical temperature are plotted in Fig. 6.
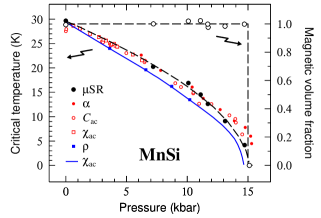
The pressure dependence of the critical temperature is consistent with recently published results obtained by various techniques (thermal expansion, specific heat and ac-susceptibility) up to about . The possible discrepancy at higher pressure (although the experimental points are somewhat distributed) may be due to the effect of different pressure media.Miyake et al. (2009)
It may be that the sample and pressure quality plays a role in the appearance of MPS. A very clear example is given by the research on URu2Si2; see Ref. Amitsuka et al., 2007 and references therein. Better sample and pressure quality results in a sharper transition in URu2Si2, i.e. no MPS is observed.
Finally we interpret the data recorded in the vicinity of .
We first estimate a bound on the characteristic fluctuation time for the spin dynamics under at . Since we clearly observe oscillations up to , see Fig. 5, the two spontaneous fields do not flip in this time range.Dalmas de Réotier et al. (2006) Therefore the time characterizing the fluctuations of the two spontaneous fields is at least as long as .
We now discuss the pressure inhomogeneity in our measurements. It seems that a pressure distribution of is a reasonable value.Rüetschi and Jaccard (2007); Miyake et al. (2009) Because the depolarization function measured at under is fully characteristic of a paramagnetic state and the one recorded under at the same temperature reflects a magnetic state, we infer . Since we have now some insight on the quality of the applied pressure, we can interpret the anomalous large width of the temperature dependence of the magnetic volume fraction observed at ; see Fig. 3. We expect the SR spectra to depend strongly on the pressure near . In fact, we note that the width at in our case has about the value found by Uemura and collaboratorsUemura et al. (2007) at low pressure for which they did not observe MPS.
In conclusion, our work shows the importance of pressure homogeneity and access to low temperatures for getting reliable information on the phase separation problem. We have shown that no MPS is present in MnSi at low temperature. Our data are consistent with the existence at low temperature of a sharp transition at the critical pressure . Pfleiderer and collaborators (see also Ref. Fåk et al., 2005) have recently argued for a partial magnetic order above .Pfleiderer et al. (2004) We expect that SR should be able to study its dynamics.
We acknowledge useful conversations with B. Fåk. This research project has been partially supported by the European Commission under the 6th Framework Programme through the Key Action: Strengthening the European Research Area, Research Infrastructures (Contract number: RII3-CT-2003-505925). DA acknowledges financial support from the Romanian CNCSIS project 444/2009. Three of us (PDR, AY and AA) were partially supported by the “Programme d’action integrée PAI franco-suisse Germaine de Staël”. Part of this work was performed at the Swiss Muon Source, Paul Scherrer Institute, Villigen, Switzerland.
References
- Williams et al. (1966) H. J. Williams, J. H. Wernick, R. C. Sherwood, and G. K. Wertheim, J. Appl. Phys. 37, 1256 (1966).
- Ishikawa et al. (1976) Y. Ishikawa, K. Tajima, D. Bloch, and M. Roth, Solid State Commun. 19, 525 (1976).
- Stishov et al. (2008) S. M. Stishov, A. E. Petrova, S. Khasanov, G. K. Panova, A. A. Shikov, J. C. Lashley, D. Wu, and T. A. Lograsso, J. Phys.: Condens. Matter 20, 235222 (2008).
- Petrova and Stishov (2009) A. E. Petrova and S. M. Stishov, J. Phys.: Condens. Matter 21, 196001 (2009).
- Thompson et al. (1989) J. D. Thompson, Z. Fisk, and G. G. Lonzarich, Physica B 161, 317 (1989).
- Petrova et al. (2009) A. E. Petrova, V. N. Krasnorussky, T. A. Lograsso, and S. M. Stishov, Phys. Rev. B 79, 100401(R) (2009).
- Uemura et al. (2007) Y. J. Uemura, T. Goto, I. M. Gat-Malureanu, J. P. Carlo, P. L. Russo, A. T. Savici, A. Aczel, G. J. MacDougall, J. A. Rodriguez, G. M. Luke, et al., Nature Physics 3, 29 (2007).
- Yu et al. (2004) W. Yu, F. Zamborszky, J. D. Thompson, J. L. Sarrao, M. E. Torelli, Z. Fisk, and S. E. Brown, Phys. Rev. Lett. 92, 086403 (2004).
- Kadono et al. (1990) R. Kadono, T. Matsuzaki, T. Yamazaki, S. R. Kreitzman, and J. H. Brewer, Phys. Rev. B 42, 6515 (1990).
- Dalmas de Réotier and Yaouanc (1997) P. Dalmas de Réotier and A. Yaouanc, J. Phys.: Condens. Matter 9, 9113 (1997).
- Amato (1997) A. Amato, Rev. Mod. Phys. 69, 1119 (1997).
- Dalmas de Réotier et al. (2004) P. Dalmas de Réotier, P. C. M. Gubbens, and A. Yaouanc, J. Phys.: Condens. Matter 16, S4687 (2004).
- Amato et al. (2004) A. Amato, M. J. Graf, A. de Visser, H. Amitsuka, D. Andreica, and A. Schenck, J. Phys.: Condens. Matter 16, S4403 (2004).
- Andreica (2001) D. Andreica, PhD thesis, Chapter 5 (ETH, Zürich, 2001).
- Sakarya et al. (2010) S. Sakarya, P. C. M. Gubbens, A. Yaouanc, P. Dalmas de Réotier, D. Andreica, A. Amato, U. Zimmermann, N. H. van Dijk, E. Brück, Y. Huang, et al. (2010), accepted for publication in Phys. Rev. B.
- Butch et al. (2009) N. P. Butch, J. R. Jeffries, D. A. Zocco, and M. B. Maple, High Pressure Research 9, 335 (2009), see also arXiv:0902.2232.
- Yaouanc et al. (2005) A. Yaouanc, P. Dalmas de Réotier, P. C. M. Gubbens, S. Sakarya, G. Lapertot, A. D. Hillier, and P. King, J. Phys.: Condens. Matter 17, L129 (2005).
- Fåk et al. (2005) B. Fåk, R. A. Sadykov, J. Flouquet, and G. Lapertot, J. Phys.: Condens. Matter 17, 1635 (2005).
- Miyake et al. (2009) A. Miyake, A. Villaume, Y. Haga, G. Knebel, B. Salce, G. Lapertot, and J. Flouquet, J. Phys. Soc. Jpn. 78, 044703 (2009).
- Belitz et al. (1999) D. Belitz, T. R. Kirkpatrick, and T. Vojta, Phys. Rev. Lett. 82, 4707 (1999).
- Pfleiderer et al. (1997) C. Pfleiderer, G. J. McMullan, S. R. Julian, and G. G. Lonzarich, Phys. Rev. B 55, 8330 (1997).
- Petrova et al. (2006) A. E. Petrova, V. N. Krasnorussky, J. Sarrao, and S. M. Stishov, Phys. Rev. B 73, 052409 (2006).
- Thessieu et al. (1995) C. Thessieu, J. Flouquet, G. Lapertot, A. N. Stepanov, and D. Jaccard, Solid State Commun. 95, 707 (1995).
- Amitsuka et al. (2007) H. Amitsuka, K. Matsuda, I. Kawasaki, K. Tenya, M. Yokoyama, C. Sekine, N. Tateiwa, T. C. Kobayashi, S. Kawarazaki, and H. Yoshizawa, J. Magn. Magn. Mater. 310, 214 (2007).
- Dalmas de Réotier et al. (2006) P. Dalmas de Réotier, A. Yaouanc, L. Keller, A. Cervellino, B. Roessli, C. Baines, A. Forget, C. Vaju, P. C. M. Gubbens, A. Amato, et al., Phys. Rev. Lett. 96, 127202 (2006).
- Rüetschi and Jaccard (2007) A. S. Rüetschi and D. Jaccard, Rev. Sci. Instrum. 78, 123901 (2007).
- Pfleiderer et al. (2004) C. Pfleiderer, D. Reznik, L. Pintschovius, H. v. Löhneysen, M. Garst, and A. Rosch, Nature 427, 227 (2004).