High Resolution Observations of Dust Continuum Emission at 340 GHz from the Low-mass T Tauri Star FN Tauri
Abstract
FN Tau is a rare example of very low-mass T Tauri stars that exhibits a spatially resolved nebulosity in near-infrared scattering light. To directly derive the parameters of a circumstellar disk around FN Tau, observations of dust continuum emission at 340 GHz are carried out with the Submillimeter Array (SMA). A point-like dust continuum emission was detected with a synthesized beam of in FWHM. From the analysis of the visibility plot, the radius of the emission is estimated to be , corresponding to 41 AU. This is much smaller than the radius of the nebulosity, for its brighter part at 1.6 µm. The 340 GHz continuum emission observed with the SMA and the photometric data at are explained by a power-law disk model whose outer radius and mass are 41 AU and , respectively, if the exponent of dust mass opacity () is assumed to be . The disk model cannot fully reproduce the flux density at 230 GHz obtained with the IRAM 30-meter telescope, suggesting that there is another extended “halo” component that is missed in the SMA observations. By requiring the halo not to be detected with the SMA, the lower limit to the size of the halo is evaluated to be between 174 AU and 574 AU, depending on the assumed value. This size is comparable to the near-infrared nebulosity, implying that the halo unseen with the SMA corresponds to the origin of the near-infrared nebulosity. The halo can contain mass comparable to or at most 8 times greater than that of the inner power-law disk, but its surface density should be lower than that at the outer edge of the power-law disk by more than one order of magnitude. The physical nature of the halo is unclear, but it may be the periphery of a flared circumstellar disk that is not described well in terms of a power-law disk model, or a remnant of a protostellar envelope having flattened structure.
1 Introduction
Hundreds of exoplanets were discovered in the last 15 years (Marcy et al., 2005; Mayor et al., 2005). Many planetary systems have a configuration completely different from the solar system, requiring us a comprehensive theory for planet formation (e.g., Ida & Lin, 2004). Diversity of the exoplanets may stem from a variety of the properties of their precursors, i.e., protoplanetary disks. Kokubo & Ida (2002), for example, proposed the idea that the planet configuration formed in a disk depends on its initial material distribution. Dust continuum emission at millimeter and submillimeter wavelengths is an important tracer to the total mass or surface density of the disks. Indeed, a sensitive multiwavelength submillimeter continuum survey of 153 young stellar objects in the Taurus-Auriga regions by Andrews & Williams (2005) revealed that circumstellar disk masses are lognormally distributed with a mean total mass of and a large dispersion (0.5 dex) when the gas-to-dust mass ratio of 100 is adopted. Meanwhile, imaging surveys of Sun-like single T Tauri stars were carried out with millimeter and submillimeter interferometers that can resolve disk emission (Kitamura et al., 2002; Andrews & Williams, 2007). They obtained not only typical values or evolutionary trends of various disk parameters but also found scatters around them, which can be interpreted as a diversity.
Typical values of disk parameters or what kind of planet is likely to form must also depend on the stellar mass. Planet formation around stars with a mass lower than Sun-like stars is especially intriguing, since these are the most abundant stars in our galaxy. Scholz et al. (2006) conducted sensitive 1.3 mm observations of 20 young brown dwarfs in the Taurus star-forming region and found that their disk masses range from to several Jupiter masses, indicating that the disk mass relative to the star is comparable to those derived for coeval low-mass () stars, namely, % to 5 % in most cases. They also found that at least 25% of the targets are likely to have disks with radii greater than 10 AU, implying that the dynamical ejection of embryos (Bate, Bonnell, & Bromm, 2002) might not be the dominant formation process for brown dwarfs (see also Luhman et al., 2007). These results may suggest that there may be no essential difference in the process for the formation of a star-disk system between Sun-like stars and less massive stars including brown dwarfs. Compared to the Sun-like stars, however, the typical mass and surface density of the disks around M dwarfs and brown dwarfs are expected to be lower while the snow line is located at a smaller radius. Such differences in the initial condition may suppress the formation of gas giants but may result in higher frequency of icy Neptune-mass planets (Laughlin et al., 2004; Ida & Lin, 2005). Although these theoretical predictions seem to be supported by recent planet searches around M dwarfs (Beaulieau et al., 2006; Johnson et al., 2007), physical properties of the disks around their younger counterparts should be studied further to verify the above considerations.
Another important clue for understanding the planet formation process in the disks is dust grain property such as composition, crystallinity, and size distribution. These have been studied by spectroscopic observations of silicate emission features at mid-infrared wavelengths and have been observed toward many young stars ranging from brown dwarfs to Herbig Ae/Be stars (for review, see Natta et al., 2007). For Sun-like stars, for example, Sargent et al. (2006) analyzed m emission spectra of 12 T Tauri stars in the Taurus-Auriga dark clouds and TW Hydrae obtained with Infrared Spectrograph (IRS) on board the Spitzer Space Telescope. They found that later spectral type stars can have relatively large amounts of crystalline silicates in their surrounding disks. More recently, a comparative study of the dust and gas properties of disks around young Sun-like stars (K1-M5) and cool stars including brown dwarfs (M5-M9) was made by Pascucci et al. (2009). They revealed that lower-mass stars including brown dwarfs tend to show weaker features at m, indicating that the features are dominated by more “processed” dust grains than those from disks around higher-mass Herbig Ae/Be stars (see also Apai et al., 2005). These systematic trends may be related to the fact that the location of the 10 m silicate emission zone is closer to the star as the stellar luminosity is lower; the larger crystallinity seen toward cooler stars can be accounted for if the size of dust grains in the inner regions is systematically larger because the contribution to the spectrum from amorphous silicates diminishes more rapidly with grain growth (m) than that from crystalline silicates do (Kessler-Silacci et al., 2007). Although these features arise from the optically thin surface layer of the inner regions of the disks and might not necessarily reflect the properties of the bulk silicate dust in the observed disk, these are the direct evidence for dust processing (i.e., dust growth and crystallization), which can be regarded as the first step to the formation of planets.
FN Tau (catalog ) (Haro 6-2 (catalog )) is a relatively rare example of low-mass T Tauri stars whose near-infrared scattering light shows clear appearance of disk-like morphology (Kudo et al., 2008). It is a single star with a spectral type of M5, located at the distance of 140 pc. The stellar mass and age are estimated to be 0.11 and yr, respectively (Muzerolle et al., 2003). Existence of a circumstellar disk was suggested by excess emission at infrared and millimeter wavelengths (Strom et al., 1989; Beckwith et al., 1990). Significant fraction of crystalline silicate grains was inferred from mid-infrared spectroscopic observations, as commonly be seen in the cases of other cool T Tauri stars (Sargent et al., 2006; Forrest et al., 2004), suggesting that grain processing is taking place at least in the disk inner regions. Recent high-resolution imaging at by Kudo et al. (2008) discovered circumstellar nebulosity. The shape of the nebulosity is almost circular, and the azimuthally averaged radial profile of the brightness follows power-law forms of in and in . Based on the fact that the exponent of the former law agrees with that observed in the nebulosity around TW Hya (Weinberger et al., 2002), which can be explained in terms of scattering light from the surface of a flared disk (Krist et al., 2000; Trilling et al., 2001), they argued that the origin of near-infrared nebulosity around FN Tau (catalog ) is also a flared circumstellar disk. Assuming that dust emission at 1.3 mm ( mJy; Beckwith et al., 1990) comes from the same regions as the nebulosity, the disk mass was estimated to be . To derive the disk parameters more directly, however, higher-resolution observations at submillimeter wavelengths are essential.
This paper presents simultaneous observations of dust continuum emission at 340 GHz and CO () from FN Tau (catalog ) with the Submillimeter Array (SMA)111 The Submillimeter Array is a joint project between the Smithsonian Astrophysical Observatory and the Academia Sinica Institute of Astronomy and Astrophysics and is funded by the Smithsonian Institution and the Academia Sinica.. High angular resolution provided by the SMA has allowed us to constrain better the distribution of circumstellar material. We describe the details of the observations in §2 and present the results in §3. Based on our results as well as those obtained by previous studies, we discuss in §4 the circumstellar structure of FN Tau (catalog ), including the disk parameters and the origin of the near-infrared nebulosity.
2 Observations
SMA observations of FN Tau (catalog ) were carried out on 2008 July 11 (UT). 4K-cooled SIS mixer receivers were tuned at the central frequencies 336.00488 GHz and 345.53059 GHz for the lower and upper sidebands, respectively, and the continuum emission was received with a bandwidth of 1.7 GHz for each sideband. Data of CO () were simultaneously obtained with a frequency resolution of 101.5 kHz, corresponding to a velocity resolution of 0.088 km s-1. The extended antenna configuration consisting of 7 antennas provided baselines ranging from 39 k to 258 k. The largest brightness distribution to which these observations are sensitive enough (more than 50% level) is in FWHM when the distribution is Gaussian (Wilner & Welch, 1994). Uranus was observed to obtain the passband characteristics of the system, while the two quasars 3C111 and 0336+323 were observed every 15 minutes to track the time variation of the complex gain. The system temperature during the observations, , was K.
Visibility data were calibrated with the IDL MIR package, which was originally developed by the Owens Valley Radio Observatory as the MMA software package (Scoville et al., 1993) and later adapted for the SMA. After the correction for the visibility amplitude using , the gain table constructed from the 3C111 data was applied to the visibilities of FN Tau (catalog ) and 0336+323; the flux density of 3C111 at 340 GHz was derived to be 1.04 Jy from the comparison with Uranus. Calibrated visibilities of 0336+323 were carefully inspected to identify visibilities taken under poor conditions. All the visibilities identified were flagged out before further analyses in §3. Data from both the sidebands were combined in the analyses of the continuum emission, hence the effective central frequency is 340.767735 GHz. Imaging from the calibrated visibilities was made with Astronomical Image Processing System (AIPS) developed at the National Radio Astronomy Observatory (NRAO).
3 Results
3.1 Continuum Emission
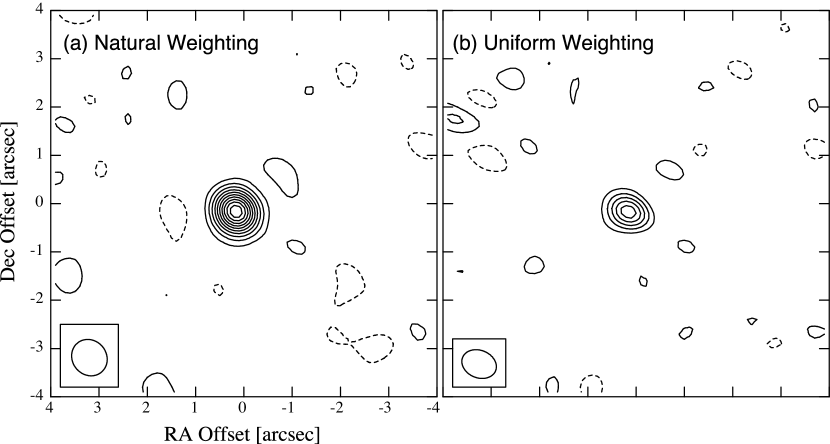
Figure 1 shows the maps of the continuum emission from FN Tau (catalog ) constructed with the CLEAN algorithm under two different visibility weightings. Natural weighting provides a synthesized beam of (P.A. = 38°) in FWHM, and the rms level in the emission-free regions is 1.7 mJy beam-1, corresponding to 0.0324 K in brightness temperature. Gaussian fit to the detected emission reveals that the emission has a total flux density of mJy with no significant extension compared to the beam size. A sharper beam, (P.A. = 68°) in FWHM, is given in the uniform weighting, but the detected emission is again point-like with a flux density of mJy. Although these results can be regarded as the detection of a point source, slightly smaller flux density with the uniform weighting may suggest that the spatial extent of the emission could marginally be resolved. Similar comparison has also been made for 0336+323, which must be a perfect point source, and the detected flux densities are mJy for the natural weighting and mJy for the uniform weighting; unlike the case of FN Tau (catalog ), there is little difference between these two weightings.
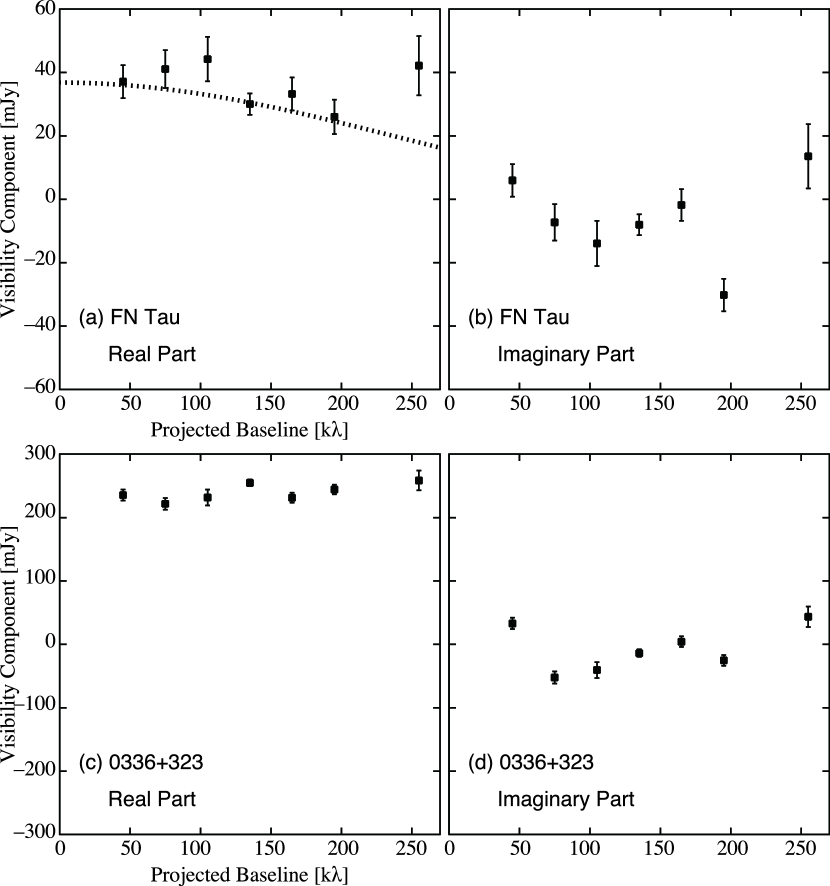
These situations can also be confirmed by the visibility plots (Figure 2). When a point source located at the phase center is observed, the real part of its visibility is a constant equal to its flux density while the imaginary part is zero for all the baselines. Indeed, these characteristics can be clearly seen in the visibility plots for 0336+323. Visibility plots for FN Tau (catalog ) also show similar characteristics, but the imaginary part at k is nearly zero while the real part in k is slightly smaller than that at shorter baselines. These can be explained by a circularly symmetric distribution of the emission with a finite extent. The submillimeter continuum emission from FN Tau (catalog ) is likely to have such a nature because the circumstellar nebulosity at near-infrared exhibits a circularly symmetric brightness distribution (Kudo et al., 2008). At baseline lengths greater than 180 k, however, the imaginary part has non-zero values, possibly due to higher phase noise. Thus the deviation from the perfect point-source case cannot confidently be identified in our results.
Upper limit to the apparent size of the emission is estimated from a comparison with the analytic solution for the case of uniform brightness. Visibility amplitude for a disk with uniform brightness, , is expressed by
| (1) |
where is Bessel function of the first kind, and are the total flux density and apparent radius of the disk, respectively, and is projected baseline length in units of the observed wavelength (e.g., Wilner & Welch, 1994). peaks at with and takes the 80% level of when . In the case of FN Tau (catalog ), the real part of the visibility is mJy, or 80% of the total flux (37 mJy), at k. This means , or 41 AU in radius, when Equation (1) is applied. Indeed, the solution for still traces the SMA data fairly well as shown in Figure 2(a). The outer radius of the detected emission is therefore estimated to be AU, significantly smaller than that of the near-infrared nebulosity ( AU for the bright part; Kudo et al., 2008).
Continuum flux density of FN Tau (catalog ) was also measured to be mJy at 230 GHz with the beam of the IRAM 30-meter telescope (Beckwith et al., 1990). Flux density measured at 340 GHz with the SMA (37 mJy) is significantly smaller than the value simply extrapolated from the measurement at 230 GHz with , where is the exponent of dust absorption coefficient for the disks around T Tauri stars ranging from 0 to 2 (e.g., Kitamura et al., 2002; Andrews & Williams, 2007). This suggests that some fraction of dust emission is missed in the SMA observations; this issue will be examined further in §4.1.
3.2 CO Emission
After averaging visibilities in five contiguous frequency channels, we made maps of CO () with a velocity resolution of 0.44 km s-1. Natural weighting provides an rms noise level of 100 mJy beam-1 with a synthesized beam of (P.A. = 38°), or 2 K in brightness temperature, but no significant emission was detected.
The disk component which is AU in radius and is detected with the dust continuum can also emit the radiation of CO (), but our sensitivity seems insufficient to reveal the CO emission as follows. When the disk is perfectly face-on and emits the CO line whose brightness temperature is K, as suggested by the model fit in §4.1, beam dilution will make the observed intensity as low as 7.7 K, which is just below the level. Note that this estimate is for an optimistic case because the emission from the disk is assumed to fall in a single velocity channel because of the perfect face-on configuration (e.g., Omodaka et al., 1992). The Keplarian rotational velocity around FN Tau (catalog ) will be km s-1 at AU, and the observed velocity width will be km s-1 if the inclination angle is 20°, as inferred by Kudo et al. (2008). In such a case, only a partial area will emit the CO radiation for a single velocity channel and the observed intensity will become lower. Furthermore, FN Tau (catalog ) is located in the L1495 cloud where the extended CO emission is very strong (e.g., Mizuno et al., 1995) while the SMA is sensitive only to the increment from these extended components, which makes the detection even more difficult. More sensitive observations will be required to reveal the compact CO emission associated with the star.
4 Discussion
4.1 Fitting of Compact Dust Emission with a Power-law Disk Model
4.1.1 case
The continuum emission detected with the SMA should originate from the disk around FN Tau (catalog ). Kudo et al. (2008) adopted a power-law disk model with inner and outer cutoffs (e.g., Kitamura et al., 2002) and derived disk parameters by fitting the spectral energy distribution, including measurement at 230 GHz with the IRAM telescope (Beckwith et al., 1990). They assumed that the gas-to-dust mass ratio is 100 and that the mass opacity of dust particles, , at millimeter and submillimeter wavelengths can be expressed as
| (2) |
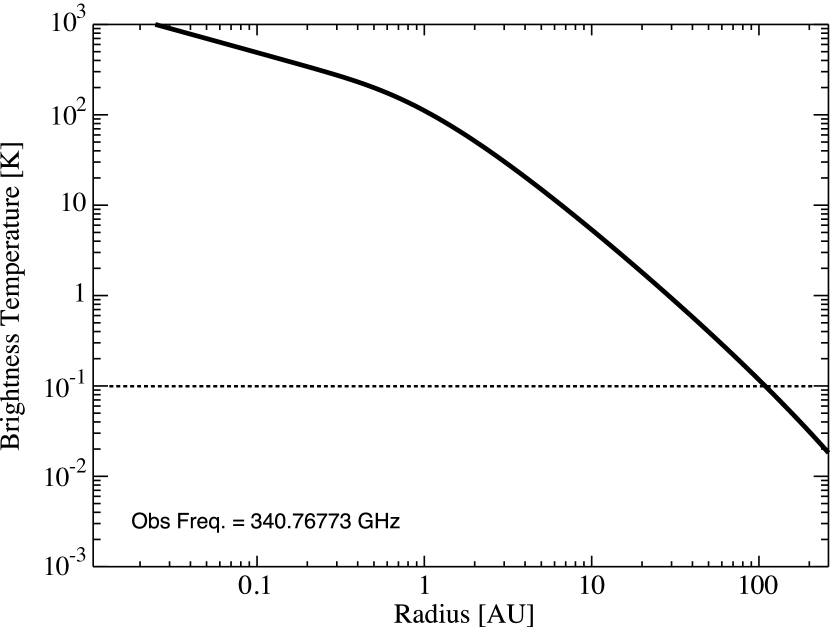
with . Kudo et al. (2008) also assumed that the bright inner part of the near-infrared nebulosity, in diameter, coincides with the disk size. The emission component detected with the SMA at 340 GHz, however, is much weaker than 100 mJy expected from the disk parameters obtained by Kudo et al. (2008). Moreover, its size is so small that the beam of the SMA could not resolve the spatial distribution. This is not due to an artifact caused by the finite sensitivity of our observations; as shown in Figure 3, the model disk derived by Kudo et al. (2008) has a brightness temperature at 340 GHz higher than the 3 level of our observations inside AU in radius, and the SMA would resolve the emission if the power-law disk had a radius greater than 100 AU. The present observations, therefore, prove that the assumption by Kudo et al. (2008) that the radius of the power-law disk coincides with the extent of near-infrared nebulosity is invalid.
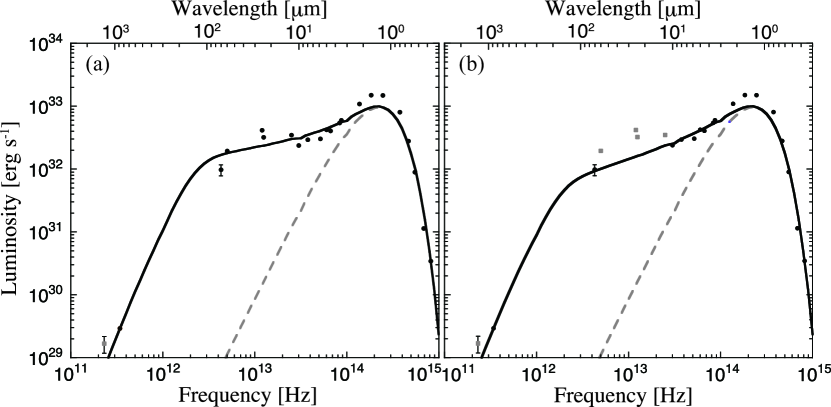
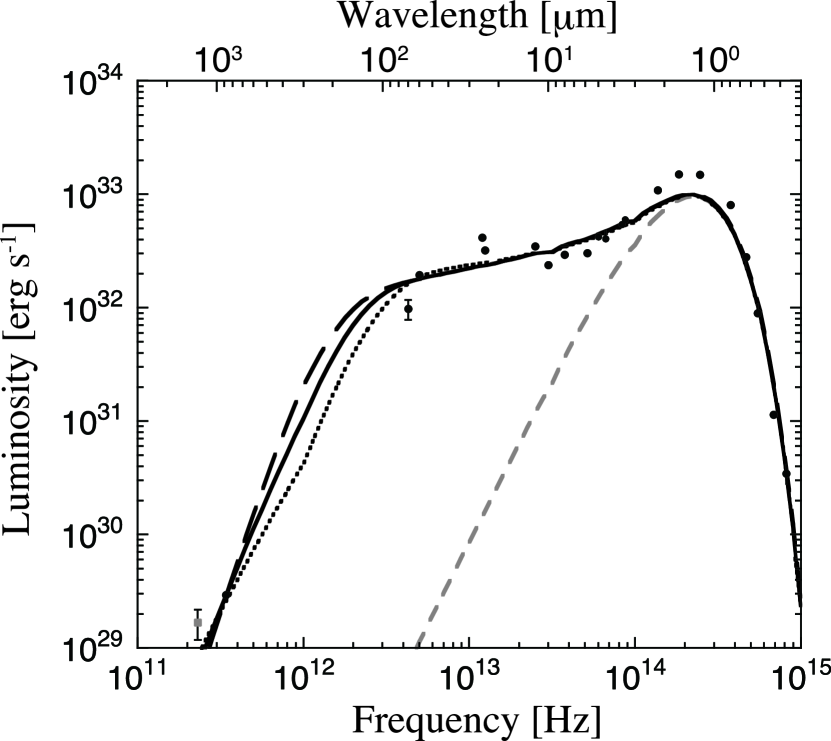
We therefore reexamine the disk parameters by fitting the spectral energy distribution with the same power-law disk model as that in Kudo et al. (2008) but under a different assumption that the outer radius of the disk is 41 AU, or the upper limit to the outer radius of the emission detected with the SMA (see §3.1). Indeed, the emission at m expected from the model disk in Kudo et al. (2008) is attributed to the region well inside 41 AU in radius. In the present model fit, we include the flux density at 340 GHz with the SMA, but the result at 230 GHz obtained with the IRAM telescope (Beckwith et al., 1990) is excluded because its beam size ( in FWHM) is so large that emission from a cold extended component outside the power-law disk may also be contained. At infrared wavelengths, photometric data obtained with the Spitzer Space telescope at 3.6, 4.5, 5.8, 8.0, 24 and 70 m (Spitzer Taurus Catalog October 2008 v2.1)222The photometric data in the Spitzer Taurus Catalog are taken from http://irsa.ipac.caltech.edu/index.html. are included in addition to those used by Kudo et al. (2008), while the data point at 100 m is excluded because this is merely an upper limit obtained with IRAS. The best fit disk parameters are summarized in the first row of Table 1, and the comparison between the spectral energy distribution of the model and the observed photometric data is shown in Figure 4(). Compared to the disk parameters inferred by Kudo et al. (2008), the surface density distribution in Table 1 is comparable while the temperature is slightly lower with a steeper radial distribution. Because of the smaller outer radius, the total disk mass is , only 15% of the estimate by Kudo et al. (2008).
Although the result shown in Figure 4() is for the best fit case, it still exhibits notable discrepancies in two wavelength ranges: (i) at near-infrared of m, in which the photometric data are mainly taken from the 2MASS catalogue, and (ii) at wavelengths longer than m. As shown in the following, the discrepancy at near-infrared is probably due to the contribution of the circumstellar nebulosity in scattering light, which is not included in the model. Photometric magnitude of FN Tau in the H-band from the 2MASS catalogue is 8.67 mag, corresponding to erg s-1 cm-2 in , but this contains both the thermal radiation from the star-disk system and the scattering light from the circumstellar nebulosity. The contribution from the star in the model is calculated to be erg s-1 cm-2, which is consistent with photometric measurements of M5 stars (Pickles, 1998). Thermal radiation from the model disk is estimated to be 10% of the stellar radiation at this wavelength, hence the amount of discrepancy, or the contribution of scattering light, is derived to be erg s-1 cm-2. On the other hand, the flux density of the nebulosity in the H-band image by Kudo et al. (2008) is 6.9 mJy, or erg s-1 cm-2. This is only 55 % of the excess emission estimated above, but it does not include the contribution from the area blocked by the occulting mask of the coronagraph ( in diameter) and the spider pattern of the telescope. If the contribution from the blocked area is taken into consideration, the nebulosity component can account for the discrepancy at near-infrared in the model fit.
The situation at longer wavelengths, which are important in deriving the disk temperature distribution, seems more complicated. Figure 4() shows that the observed fluxes in m are systematically smaller than the model while those in m are systematically larger than the model. These disagreements could be resolved if we adopt a more elaborate disk model with a flared surface layer of superheated dust grains (e.g., Chiang & Goldreigh, 1997) because the surface layer can contribute additional fluxes mainly at the latter wavelength range. We should examine in detail these effects when we would investigate the vertical structure at smaller radii, but this is beyond the scope of this paper. To estimate the total mass or the surface density of the disk based on our SMA results, a simple power-law disk model may be acceptable because almost whole the disk emission at millimeter and submillimeter wavelengths are expected to originate from a single layer, i.e., the interior region near the mid-plane which is the dominant mass reservoir (Chiang & Goldreigh, 1997). For the temperature distribution of the interior region, a better estimate could be obtained with a model fit in which photometric data that might be severely affected by the contribution from the surface layer are eliminated. As shown in Figure 4() and the fourth row of Table 1, the result of the model fit without data at m, which exhibit significant upward deviations from the model in Figure 4(), gives us a disk mass 40 % higher than the case shown in Figure 4() due to the lower derived temperature. For the and cases in §4.1.2 and in Table 1, we will only show the results of the model fits in which all the infrared data are included, but the disk mass can be higher than those shown in Table 1 by 40 % in the model fits without data at m, as similar to the case.
The disk models in Figures 4() and 4() predict that the flux density at 230 GHz is mJy. This is significantly smaller than the flux density measured by the beam of the IRAM telescope, mJy (Beckwith et al., 1990). Since this measurement was made with a chopping position for the sky subtraction just (4200 AU) apart from the star, contributions by the extended background should mostly be canceled out and the detected emission is likely to originate from some circumstellar components. One can also confirm easily that the contamination from the extended CO () line is negligible when one takes into account the fact that the frequency bandwidth of this observation was 50 GHz. The above comparison, therefore, suggests that the flux density measured with the IRAM telescope contains a slight excess of mJy from the power-law disk model with , and that there is another component which is missed in the present SMA observations. The possible origin of this missing component, together with apparent disagreement in size between the emission seen in the SMA image and the near-infrared nebulosity, will be discussed in §4.2.
4.1.2 Cases of Other Values
Since there is no photometric data at other millimeter and submillimeter wavelengths with a similar beam size as that of the SMA, we cannot directly determine inside the disk, or AU. We therefore made model fits with other values, 0 and 2, to evaluate uncertainties in derived physical quantities. The obtained disk parameters are summarized in Table 1, and the comparisons between the spectral energy distributions of the models and the observed photometric data are shown in Figure 5. The parameters related to the temperature distribution in Table 1 are almost insensitive to the change in because these are essentially determined by data points in the infrared range where the disk is optically thick. The surface density and disk mass, on the other hand, can be varied by a factor of 3 compared to the case according as the change of following Equation (2).
Although there are large uncertainties in the estimates for the disk mass and surface density, we can obtain several robust conclusions. First, the estimated disk mass is at most , which corresponds to 1.4 times the maximum mass in the case of Table 1. This is just an order of Jupiter mass and seems insufficient to build a gas giant planet. As discussed by Kudo et al. (2008), it is most likely that only small terrestrial or icy planets will form (Kokubo & Ida, 2002). Secondly, the disk size ( AU) is significantly smaller than the typical disk radius for solar-type T Tauri stars derived from a similar model fit including SMA data ( AU; Andrews & Williams, 2007), but the spectral energy distribution of FN Tau can be explained by a power-law disk model as similar to the cases of other solar-type T Tauri stars (Kitamura et al., 2002; Andrews & Williams, 2007). Together with the fact that the disk mass relative to the star ( %) is within the range of the statistics for solar-type T Tauri stars (Andrews & Williams, 2007), FN Tau has probably been formed through the standard process of star formation, i.e., the gravitational contraction of a cloud core, but not through dynamical ejection from a gravitationally unstable circumstellar disk (Bate, Bonnell, & Bromm, 2002). Thirdly, all the best-fit model disks whose parameters are listed in Table 1 cannot fully reproduce the flux density at mm obtained with the IRAM telescope (Beckwith et al., 1990), indicating that the two results with the SMA and the IRAM telescope cannot simultaneously be explained by a power-law disk only. This implies that there is another more extended component that cannot be well described by a power-law disk model and is missed in the SMA observations.
4.2 Nature of the Missing Extended Component
As shown in §4.1, the best-fit power-law disk model cannot fully reproduce the flux density at 230 GHz obtained with the IRAM telescope in all the cases of . This implies that, in addition to the compact power-law component, there is a more extended component that is missed in the SMA observations; we will denote this component by “halo” in the following.
We can roughly evaluate the lower limit to the size of the halo by requiring it not to be detected with our SMA observations. In the case of , for example, the flux density of the model disk component at 230 GHz is 13 mJy (see Table 1), hence the median for the expected contribution of the halo at this frequency is 18 mJy. Assuming that dust particles in the halo have the same as those in the disk, the flux density of the halo component at 340 GHz is estimated to be 58 mJy. If the emission of the halo is uniformly distributed inside (i.e., 366 AU) in radius, it will have a brightness temperature equal to the level of the map in Figure 1(a) and cannot be detected. This estimate can also be verified in the visibility plot; the contribution of the halo at k will be 3.5 mJy (i.e., 6% of the total flux density of the halo) according to Equation (1) with , which is much smaller than the standard error of the visibility amplitude (see Figure 2). We have summarized in Table 2 the lower limits to the size of the halo for other cases including their uncertainties.
The estimated lower limits to the halo’s radius in Table 2 are between 174 AU and 574 AU, depending on the assumed value. All of these numbers, however, are smaller than the beam size of the IRAM telescope, thus its photometric measurement can completely contain all the emission from the halo. More importantly, the estimated size of the halo is quite reminiscent of the size of the near-infrared nebulosity: (260 AU) in radius for the brighter part where the brightness distribution follows and (400 AU) in radius for the tenuous periphery with (Kudo et al., 2008). These comparisons suggest that the circumstellar structure around FN Tau (catalog ) may consist of two components: a compact power-law disk ( AU) and a surrounding halo that probably corresponds to the origin of the near-infrared nebulosity. The SMA observations have revealed only the former component while both the components were detected by the IRAM telescope.
When all the infrared data are used in a model fit, the best-fit parameters of the disk give K at the outer edge of the disk, AU, regardless of the assumed (see Table 1). If we assume that the temperature in the halo, , is also the same as that at and uniformly 19 K, we can estimate its mass () and average surface density () by the following equations:
| (3) | |||||
| (4) |
and for all the cases derived by Equation (3) or (4) are shown in Table 2, in which are normalized by the disk surface density at (see Table 1). Note that in Table 2 will be higher by % when we adopt the disk parameters obtained by a model fit without photometric data at m (see §4.1.1), but the mass and surface density of the halo relative to the inner disk remain unchanged because the disk mass and its surface density will also be higher by the same factor. Table 2 clearly indicates that the halo can contain mass comparable to or at most 8 times greater than that of the inner power-law disk, but should be lower than the surface density of the inner disk by an order of magnitude.
Based on the fact that the surface brightness distribution of the near-infrared nebulosity, , follows the relation , Kudo et al. (2008) concluded that its origin is the scattering light at the surface of a flared disk. The new insight obtained with the present SMA observations, however, is that the circumstellar component outside at least 41 AU in radius cannot be described well in terms of a power-law disk model. Indeed, a power-law form of can also be explained either by an optically thin, spherically symmetric envelope (e.g., Tamura et al., 1988; Weintraub et al., 1992) or by a flattened envelope with larger optical depth in almost pole-on configuration (Whitney & Hartmann, 1993), though Kudo et al. (2008) did not examine these possibilities in detail. Among these possibilities, an optically thin and spherical envelope is unlikely; in Equation (4) would correspond to mag to the star in the usual relation for the interstellar medium (Bohlin, Savage, & Drake, 1978) when a spherical envelope is assumed, but this is much larger than the actual to the star (1.35 mag; Muzerolle et al., 2003).
What is then the nature of the halo ? One possibility is that this is part of a flared circumstellar disk but the periphery regions that cannot be described well by a simple power-law disk model. Recently, Hughes et al. (2008) investigated the apparent discrepancy between gas and dust outer radii derived from millimeter and submillimeter observations of protoplanetary disks. They found that a disk model described by power laws in surface density and temperature that are truncated at an outer radius does not simultaneously reproduce the gas and dust emissions, but a simple accretion disk model that includes a tapered exponential edge in the surface density distribution does well. This is because the surface density in the outer tapered regions can be so low that the dust continuum emission at submillimeter is negligible but large enough to produce detectable emission in a probe of higher emission coefficient such as a rotational transition of CO or scattering light at near-infrared. In fact, one of the sample in Hughes et al. (2008), TW Hya, shows quite similar features to those seen in FN Tau; it exhibits near-infrared nebulosity whose size ( AU) is significantly larger than the size of the submillimeter continuum emission determined by visibility fitting with a power-law disk model ( AU), and the radial brightness distribution of the nebulosity has a power-law form which is almost the same as that around FN Tau (Weinberger et al., 2002). The inferred surface density of the halo (see Equation (4) and Table 2), which is significantly lower than the inner power-law disk, is qualitatively similar to the outer regions of the model disk with an exponential tail. Another possibility is that the halo is a diffuse remnant of the protostellar envelope with flattened structure (Whitney & Hartmann, 1993). The age of FN Tau is estimated to be yr (Muzerolle et al., 2003), hence it is not surprising that FN Tau is still accompanied by such a component. Although these two candidates for the halo or the origin of the nebulosity are quite different in nature, it is unclear which is the case because both of them will have a scattering surface that can account for the radial brightness profile of the near-infrared nebulosity. Further sensitive observations in line emission will be critical to understand the nature of the halo.
References
- Andrews & Williams (2005) Andrews, S. M., & Williams, J. P. 2005, ApJ, 631, 1134
- Andrews & Williams (2007) Andrews, S. M., & Williams, J. P. 2007, ApJ, 659, 705
- Apai et al. (2005) Apai, D., Pascucci, I., Bouwman, J., Natta, A., Henning, Th., & Dullemond, C.P. 2005, Science, 310, 834
- Bate, Bonnell, & Bromm (2002) Bate, M. R., Bonnell, I. A., & Bromm, V. 2002, MNRAS, 332, L65
- Beaulieau et al. (2006) Beaulieau, J. -P. et al. 2006, Nature, 439, 437
- Beckwith et al. (1990) Beckwith, S. V. W., Sargent, A. I., Chini, R. S., & Güsten, R. 1990, AJ, 99, 924
- Bohlin, Savage, & Drake (1978) Bohlin, R. C., Savage, B. D., & Drake, J. F. 1978, ApJ, 224, 132
- Chiang & Goldreigh (1997) Chiang, E. I., & Goldreigh, P. 1997, ApJ, 490, 368
- Forrest et al. (2004) Forrest, W. J., et al. 2004, ApJS, 154, 443
- Ho, Moran, & Lo (2004) Ho, P. T. P., Moran, J. M., & Lo, K. Y. 2004, ApJ, 616, L1
- Hughes et al. (2008) Hughes, A. M., Wilner, D. J., Qi, C. & Hogerheijde, M. R. 2008, ApJ, 678, 1119
- Ida & Lin (2004) Ida, S., & Lin, D. N. C. 2004, ApJ, 604, 388
- Ida & Lin (2005) Ida, S., & Lin, D. N. C. 2005, ApJ, 626, 1045
- Johnson et al. (2007) Johnson, J. A., et al. 2007, ApJ, 670, 833
- Kessler-Silacci et al. (2007) Kessler-Silacci, J. E. et al. 2007, ApJ, 659, 680
- Kitamura et al. (2002) Kitamura, Y., Momose, M., Yokogawa, S., Kawabe, R., Tamura, M., & Ida, S. 2002, ApJ, 581, 357
- Kokubo & Ida (2002) Kokubo, E., & Ida, S. 2002, ApJ, 581, 666
- Krist et al. (2000) Krist, J. E., Stapelfeldt, K. R., Menard, F., Padgett, D. L., & Burrows, C. J. 2000, ApJ, 538, 793
- Kudo et al. (2008) Kudo, T. et al. 2008, ApJ, 673, L67
- Laughlin et al. (2004) Laughlin, G., Bodenheimer, P., & Adams, F. C. 2004, ApJ, 612, L73
- Luhman et al. (2007) Luhman, K. L. et al., 2007, ApJ, 666, 1219
- Marcy et al. (2005) Marcy, G., Butler, R. P., Fischer, D., Vogt, S., Wright, J. T., Tinney, C. G., & Jones, H. R. A. 2005, Prog. Theor. Phys. Suppl., 158, 24
- Mayor et al. (2005) Mayor, M., Pont, F., & Vidal-Madjar, A. 2005, Prog. Theor. Phys. Suppl., 158, 43
- Mizuno et al. (1995) Mizuno, A., Onishi, T., Yonekura, Y., Nagahama, T., Ogawa, H., & Fukui, Y. 1995, ApJ, 445, L165
- Mokler & Stelze (2002) Mokler, F., & Stelze, B. 2002, A&A, 391, 1025
- Muzerolle et al. (2003) Muzerolle, J., Hillenbrand, L., Calvet, N., Briceno, C., & Hartmann, L. 2003, ApJ, 592, 266
- Natta et al. (2007) Natta, A., Testi, L., Calvet, N., Henning, Th., Waters, R., & Wilner, D. 2007 in Protostars and Planets V, ed. B. Reipurth, D. Jewitt, & K. Keil (Tucson, AZ: University of Arizona Press), 767
- Omodaka et al. (1992) Omodaka, T., Kitamura, Y., & Kawazoe, E. 1992, ApJ, 396, L87
- Pascucci et al. (2009) Pascucci, I. et al. 2009, ApJ, 696, 143
- Pickles (1998) Pickles, A. J. 1998, PASP, 110, 863
- Sargent et al. (2006) Sargent, B. et al. 2006 ApJ, 645, 395
- Scoville et al. (1993) Scoville, N. Z., Carlstrom, J. E., Chandler, C. J., Phillips, J. A., Scott, S. L., Tilanus, R. P. J., & Wang, Z. 1993, PASP, 105, 1482
- Scholz et al. (2006) Scholz, A., Jayawardhana, R., & Wood, K. 2006, ApJ, 645, 1498
- Strom et al. (1989) Strom, K. M., Strom, S. E., Suzan, E., Cabrit, S., & Skrutskie, M. F. 1989, AJ, 97, 1451
- Tamura et al. (1988) Tamura, M. et al. 1988, ApJ, 326, 17
- Trilling et al. (2001) Trilling, D. E., Koerner, D. W., Barnes, J. W., Ftaclas, C., & Brown, R. H. 2001, ApJ, 552, L151
- Weinberger et al. (2002) Weinberger, A. J., et al. 2002, ApJ, 566, 409
- Weintraub et al. (1992) Weintraub, D. A., Kastner, J. H., Zuckerman, B., & Gatley, I. 1993, ApJ, 391, 784
- Whitney & Hartmann (1993) Whitney, B. A., & Hartmann, L. 1993, ApJ, 402, 605
- Wilner & Welch (1994) Wilner, D. J., & Welch, W. J. 1994, ApJ, 427, 898
| aaGas-to-dust mass ratio is assumed to be 100. | |||||
|---|---|---|---|---|---|
| (K) | (g cm-2) | () | (mJy) | ||
| Minimum Radius | bbSurface density at the outer radius (= 41 AU) is adopted as . | |||||
|---|---|---|---|---|---|---|
| (mJy) | (mJy) | () | () | |||