Confirmation of a recent bipolar ejection
in the very young hierarchical multiple system IRAS 16293–2422
Abstract
We present and analyze two new high-resolution ( ), high-sensitivity ( 50 Jy beam-1) Very Large Array 3.6 cm observations of IRAS 16293–2422 obtained in 2007 August and 2008 December. The components A2 and A2 recently detected in this system are still present, and have moved roughly symmetrically away from source A2 at a projected velocity of 30–80 km s-1. This confirms that A2 and A2 were formed as a consequence of a very recent bipolar ejection from A2. Powerful bipolar ejections have long been known to occur in low-mass young stars, but this is –to our knowledge– the first time that such a dramatic one is observed from its very beginning. Under the reasonable assumption that the flux detected at radio wavelengths is optically thin free-free emission, one can estimate the mass of each ejecta to be of the order of 10-8 M⊙. If the ejecta were created as a consequence of an episode of enhanced mass loss accompanied by an increase in accretion onto the protostar, then the total luminosity of IRAS 16293–2422 ought to have increased by 10–60% over the course of at least several months. Between A2 and A2, component A2 has reappeared, and the relative position angle between A2 and A1 is found to have increased significantly since 2003–2005. This strongly suggests that A1 is a protostar rather than a shock feature, and that the A1/A2 pair is a tight binary system. Including component B, IRAS 16293–2422 therefore appears to be a very young hierarchical multiple system.
1 Introduction
Although the formation of stars in multiple systems is known to be a major channel of star-formation (e.g. Duchêne et al. 2007 for a recent review), our understanding of the way multiple stellar systems form remains comparatively poorer than our comprehension of isolated star-formation. To improve this situation, it is necessary to identify and characterize multiple systems in the earliest phases of their evolution (preferably during the Class 0 and I stages). Progress has been slow, unfortunately, because very few existing instruments have enough sensitivity and angular resolution to detect and resolve very embedded systems even in the nearest star-forming regions. Moreover, young stars in multiple systems are surrounded by circumstellar and/or circumbinary disks, and often drive powerful, episodic jets that must be correctly interpreted before a given system can be properly characterized. As a consequence, the number of very young systems for which the binarity is clearly established, and the system parameters are well measured, is extremely limited. Arguably one of the most promising cases is that of IRAS 16293–2422 (e.g. Wootten 1989; Mundy et al. 1992; Ceccarelli et al. 2000; Chandler et al. 2005).
IRAS 16293–2422 is a well-studied very young low-mass protostellar system located in Lynds 1689N, a dark cloud in the Ophiuchus star-forming complex at = 120 pc (Loinard et al. 2008). It has a total luminosity of about 15 L⊙ and has never been detected shortward of = 12 m (e.g. Ceccarelli et al. 1998, Jørgensen et al. 2008). These characteristics make IRAS 16293–2422 a bona fide Class 0 source with an age of only a few 104 yr (André et al. 2000). It has been suspected to be multiple since Wootten (1989) and Mundy et al. (1992) found it to be double both at millimeter and centimeter wavelengths, and Mizuno et al. (1990) discovered that it powered a multi-lobe outflow system. More recent observations (Hirano et al. 2001; Castets et al. 2001; Chandler et al. 2005) confirmed these early findings, and it is now well-established that IRAS 16293–2422 is indeed a very young multiple system.
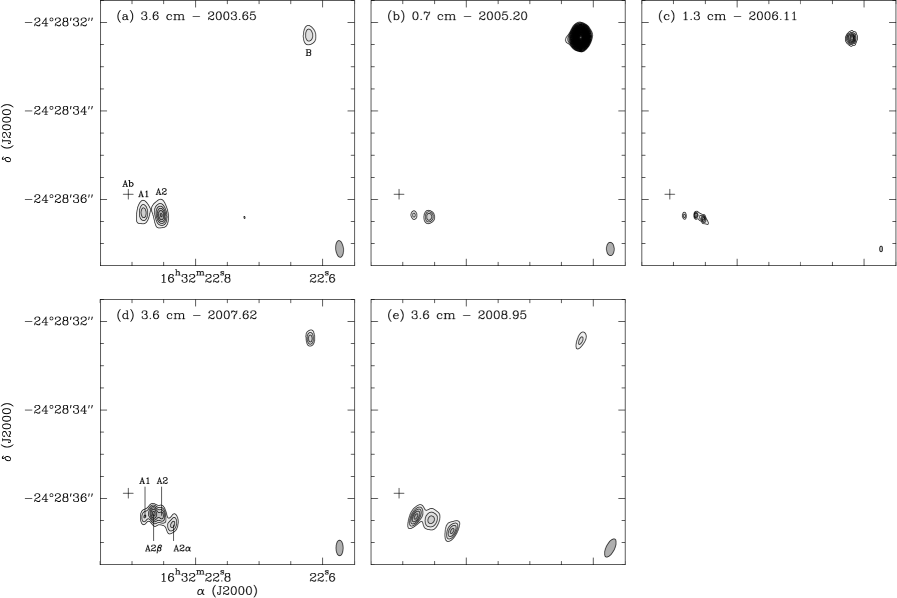
In all centimeter observations with an angular resolution better than obtained before 2006, IRAS 16293–2422 comprised three radio sources called A1, A2 and B (Wootten 1989, Loinard 2002, Chandler et al. 2005 –see Fig. 1). Components A1 and A2 are located to the south-east of the system and are separated from each other by about , whereas component B is located about 5′′ to the north-west of the A1/A2 pair (Fig. 1). Using archival VLA observations, Loinard (2002) and Chandler et al. (2005) have shown that the position angle between A2 and A1 has increased roughly linearly from about 45∘ in the late 1980s to about 80∘ in 2003–2005. During that same timespan, the separation between the two sources has remained constant at about . Two different interpretations have been proposed for this relative motion (see Loinard et al. 2007 for details). According to the first one, A1 and A2 are two protostellar sources in a nearly circular Keplerian orbit, seen almost exactly face-on. In the alternative possibility, A1 is interpreted as a shock resulting from the impact of a strongly precessing (or wobbling) jet driven by a third –as-yet undetected– protostar in the system, presumably a companion of A2111The jet driven by A2 itself is not aligned with the current position of A1, so if A1 is indeed a shock feature, it must be driven by a different source (Chandler et al. 2005; Loinard et al. 2007).. Of course, in the former case, the position angle between A2 and A1 should keep increasing indefinitely, whereas in the latter, the change of position angle with time should decelerate, and eventually reverse its course because the jet must oscillate around an equilibrium position.
In a recent 1.3 cm image, IRAS 16293–2422 was unexpectedly found to comprise four radio sources rather than the usual three (Fig. 1c –Loinard et al. 2007). While components B and A1 were at the expected positions and had the expected morphologies, component A2 appeared to have split into two sub-condensations dubbed A2 and A2. Since the line joining A2 to A2 was at a position angle of about 62∘, very similar to the direction of both the large-scale flow and the thermal jet known to be driven by A2, Loinard et al. (2007) argued that A2 and A2 traced a recent bipolar ejection from A2. If this is the case, then A2 and A2 should move symmetrically away from A2, along the direction of the jet, at velocities typical of the winds driven by low-mass protostars (tens to hundreds of km s-1, depending on the inclination of the jet). This could be easily tested with new observations.
As the previous discussion shows, the very nature of some of the sources associated with IRAS 16293–2422 remains unknown, and the exact number of protostars contained in the system is still uncertain. In this article, we will present and analyze new high-resolution, high-sensitivity, radio continuum observation that will be used to further investigate the structure of IRAS 16293–2422.
2 Observations
Two new 3.6 cm observations of IRAS 16293–2422 were obtained on 2007, August 14 (2007.62), and 2008, December 13 (2008.95) with the Very Large Array (VLA) of the National Radio Astronomy Observatory (NRAO) in its most extended (A) configuration. The standard 3.6 cm continuum frequency setup was used, and both circular polarizations were recorded simultaneously. The absolute flux density was set using observations of 3C 286. For improved flux accuracy, we did not assume 3C 286 to be a point source, but instead used a model image provided by NRAO. The phase calibrator was PKS J1625–2527 whose absolute position is expected to be accurate to about 2 milli-arcseconds. The data were collected during the VLA/EVLA transition period, so the array consisted of a mixture of “old” VLA antennas, and of antennas already equipped with new electronics. The non-matched bandpass shapes between VLA and EVLA antennas produced significant closure errors on VLA/EVLA baselines. To correct these errors, we measured baseline-dependent gains using the observations of the phase calibrator. The images obtained after applying these baseline-dependent gains are almost identical to those produced by simply flagging the VLA/EVLA baselines.
To optimize the angular resolution, the calibrated visibilities were imaged using uniform weighting (ROBUST parameter set to –5), resulting in synthesized beams of – and in the north-south and east-west directions, respectively (see Table 1). The r.m.s. noise levels in the final images are 45–50 Jy beam-1. In the following sections, these new observations will be compared to a similar 3.6 cm observation obtained in 2003.65, and to 0.7 cm and 1.3 cm images obtained in 2005.20 and 2006.11, respectively (see Fig. 1 –all three images were published previously by Loinard et al. 2007). The characteristics of these images are listed in Table 1 together with those of the new 3.6 cm images published here. The flux of source B is known to be fairly constant with time at any given wavelength (Chandler et al. 2005), so measurements of the total flux of component B provides a valuable self-consistency check on the overall calibration. The flux found for component B in the three 3.6 cm observations included in the present work are reported in the last column of Table 1; they are indeed fully consistent with each other, and with previously published figures (Chandler et al. 2005).
Observations at = 0.7 and 1.3 cm, designed to measure (in combination with the 3.6 cm data presented here) the spectral index of A2 and A2 were requested and approved both in the 2007.62 and 2008.95 runs. They were actually collected in the former run, but could not be properly calibrated because of poor weather conditions. Because of scheduling limitations, no multi-wavelengths data could be obtained in the 2008.95 run.
3 Nature and origin of A2 and A2
3.1 Structure and astrometry
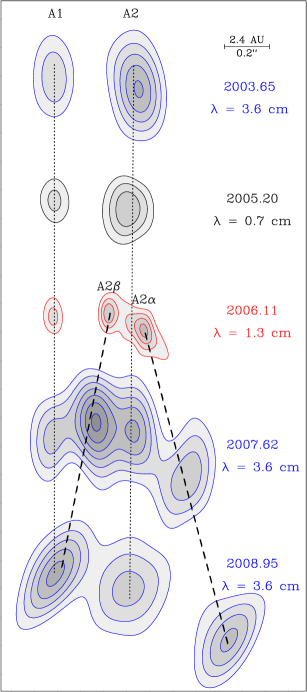
In the two new 3.6 cm observations, component B is at its expected position, with its usual morphology (Fig. 1) and flux (Sect. 2). The structure of component A, however, has changed significantly since early 2006 –when the last VLA observation prior to those presented here was obtained (Fig. 1c). In the observation obtained in mid-2007 (Fig. 1d), component A of IRAS 16293–2422 appears to contain four radio sources (see particularly the zoom on this region shown in Fig. 2). Although somewhat blended with the rest of the emission, A1 is still clearly discernable to the east of the system (Fig. 2). A radio source is also visible again at the expected position of A2. Note that this was not the case in the 2006.11 observation, where the emission associated with A2 was blended with that of A2. The two additional sources in the system (indeed, the two brightest ones) are located on each side of A2, and we identify them with A2 and A2. They are clearly not at the same positions as in the 2006.11 observation. Instead, they have moved away from A2 in a roughly symmetrical manner, A2 towards the south-west, and A2 towards the north-east. In the observation obtained at the end of 2008, component A is (again, but fortuitously) composed of three sources (Figs. 1e and 2). Source A2 is still clearly identified, while source A2 has moved further from A2 towards the south-west. Component A2 has also kept moving away from A2 (towards the north-east), but now appears to be blended with A1 (Fig. 2).
To further investigate the nature and properties of A2 and A2, it is interesting to compare their relative positions at the various epochs. In 2006.11, A2 and A2 were separated by at a position angle of 62∘ 2∘. In the 2007.62 image, however, the separation has increased to , but the position angle has not changed significantly: it is now measured to be 61∘ 3∘. From the change in their separation, we can estimate the velocity at which A2 and A2 are moving away from one another to be 109 4 km s-1. The errors quoted here and later in the paper only account for the positional uncertainties of the ejecta, they do not include the errors on the distance to the source. If the velocity since ejection has been constant at the value estimated above, the ejection must have occured 0.87 0.04 yr before the 2006.11 observation (or 2.38 0.11 yr before the 2007.62 observation), i.e. in 2005.24 0.04. This is –as expected– between the epochs of the 0.7 and 1.3 cm observations shown in Figs. 1 and 2, but only very shortly after the 0.7 cm data were gathered.
Since A2 and A2 are well separated in the last two 3.6 cm observations, one can also consider the evolution of the relative position between these two sources. In 2007.62. they were separated by at a position angle of 49∘ 4∘, whereas in the 2008.95 observation, the separation was and the position angle 61∘ 3∘. Thus, A2 appears to be moving away from A2 at 82 9 km s-1. Assuming again that the velocity has not changed appreciably, the ejection must have occurred 3.41 0.37 yr before the 2008.95 observation, i.e. in 2005.54 0.37. This is in good agreement with the date estimated above from the relative motion between A2 and A2, suggesting that the assumption of constant velocity is reasonable. Note that the relative velocity between A2 and A2 derived here is somewhat larger than half of the velocity between A2 and A2 calculated above. This shows that A2 is moving away from A2 somewhat faster than A2222One could argue that this result might also be consistent with an acceleration of the velocity of the ejecta since the relative velocity between A2 and A2 is based on more recent observations that the estimate of the relative velocity between A2 and A2. We favor the interpretation given in the text because the two recent 3.6 cm observations (Fig. 2) clearly show that A2 has moved farther from A2 than A2.. Indeed, one can estimate the relative velocity between A2 and A2 combining the present result and the relative velocity between A2 and A2 calculated earlier. We obtained (assuming again constant velocities) 26 10 km s-1. Thus A2 appears to move away from A2 about three times faster than A2. Bipolar ejections usually produce somewhat more symmetric patterns. It should be mentioned, however, that the north-east and south-west lobes of the molecular outflow driven by A2 have long been known to be very asymmetric. For instance, SiO emission is very strong in the direction of the north-east lobe and nearly absent towards the south-west counterpart (e.g. Castets et al. 2001; Hirano et al. 2001). Since SiO is a good tracer of shocks between jets and circumstellar material, this most likely indicates that the region to the south-west of component A contains relatively little dense gas capable of decelerating the ejecta.
In summary, A2 and A2 appear to behave kinematically exactly as would be expected if they were ejecta from A2: they are moving (in projection) at 30–80 km s-1 away from A2 along the direction (P.A. 60∘) of the outflow known to be powered by A2. The true velocity of the jet must be of the order of the escape velocity from A2. As we will see in Sect. 4, A2 is likely to be a 1.5 M⊙ protostar. The radius at which jets are launched is usually believed to be a few stellar radii ( 3 ), and very young stars are a few times larger than their main sequence counterparts of the same mass. It is, therefore, reasonable to assume that the radius of the protostar associated with A2 is about 3 R⊙, and that the escape velocity should be calculated at 10 R⊙. Under these assumptions, we obtain 240 km s-1. To obtain a rough estimate of the orientation of the jet, we assume that this value provides a reasonable estimate of the true current velocity of the jet (this would require, in particular, that the jet has suffered little deceleration since it was launched). The projected velocity of the ejecta in only 30–80 km s-1, so the jet powered by A2 must be oriented along a direction only 10∘–15∘ from the line of sight. We conclude that A2 drives a flow oriented almost along the line of sight, and that A2 and A2 are ejecta along that flow. Episodic bipolar mass ejections are known to occur in young stars (e.g. Marti et al. 1995). To our knowledge, this is the first time, however, that an ejection is actually observed from the very beginning: we seem to have witnessed the very birth of a Herbig-Haro pair.
3.2 Properties of the ejecta
The centimeter emission produced by winds and ejecta from low-mass stars is thought to be nearly entirely of free-free origin (e.g. Anglada 1995, Shang et al. 2004). As detached clumps, A2 and A2 are likely less dense than the so-called thermal jets associated with the central regions of winds driven by young stars. As a consequence, the free-free emission from A2 and A2 is likely to be optically thin. In the absence of simultaneous multi-frequency observations (see Sect. 2), it is somewhat hazardous to estimate their spectral index and ascertain the characteristics of the emission. We note, however, that our data are fully consistent with optically thin free-free emission. The source A2 was well-resolved in the 2006.11 1.3 cm data and in the 2007.62 3.6 cm observations. The spectral index derived from these two observations is = –0.09 0.05, in excellent agreement with the expected value ( = –0.1) for optically thin free-free emission.
To further constrain the properties of the ejecta, we will concentrate on A2, because it is well-resolved from the other sources in both of our 3.6 cm data sets. Within the errors, the 3.6 cm flux of A2 does not appear to have changed much between the two observations (0.62 0.09 mJy in 2007.62 and 0.93 0.10 in 2008.95 –Table 2). The angular size of the emission (deconvolved from the primary beam) was found to be in the 2008.95 data, whereas the emission was only resolved in one direction in the 2007.62 observations. In the resolved dimension, the angular size was , whereas in the other direction, the emission came from a region smaller than . Thus, the mean angular size of the emission was about in 2008.95 and less than about in 2007.62.
Assuming optically thin free-free emission, the mass of ionized gas can be calculated from the radio flux as (e.g. Rodríguez et al. 1980):
| (1) |
Using the numbers above and = 104 K, we obtain, for A2, (1.00 0.05) 10-8 M⊙ using the 2008.95 observations (once again, the quoted uncertainty does not include the errors on the distance to the source), and 0.9 10-8 M⊙ using the 2007.62 data. Assuming that both ejecta have similar masses, the bipolar ejection event reported here corresponds to a total mass of about 2 10-8 M⊙.
From the observed radio flux, one can also calculate the electron density of the ejecta (e.g. Rodríguez et al. 1980):
| (2) |
With the observed parameters of the emission, we get = 4.4 105 cm-3 for A2. Interestingly, the recombination timescale at that density is about 6 months. Since the ejecta have remained ionized at least since 2006.11 (when they were first detected) and most certainly since their creation around 2005.3 (see above), some mechanism must provide energy to keep them ionized. The most likely candidates are shocks either with the surrounding medium or internal to the jets. To remain ionized, the ejecta require an ionization rate of s-1. Assuming that 13.6 eV of energy are required ionization, a power of erg s-1 is needed. If this power is produced by the kinetic energy of the ejecta, we expect that the ejecta should decelerate at a rate of about 12.5 km s-1 yr-1 (for an initial velocity of 240 km s-1 and a mass of ). The true deceleration would be somewhat smaller if the ejecta were only partially ionized as seems to be commonly the case (e.g. Podio et al. 2009). In any case, since the jet appears to be only 10–15∘ from the line of sight, the projected deceleration would only be 2–3 km s-1 yr-1 and would be undetectable with the existing observations.
3.3 Origin of the ejecta
Detached clumps have long been known to exist in the jets driven by young stars. They can be created in (at least) two ways. One possibility is if the driving source experiences episodic increases in its mass loss rate. This hypothesis is often the preferred one to explain the presence of symmetric pairs of well-defined HH knots in evolved outflows (e.g. Arce & Goodman 2002). An alternative possibility is if the mass loss rate remains constant, but the ejection velocity increases abruptly from an initial value to a final (larger) one . In this situation, a working surface where material accumulates is created at the interface between the two winds. This naturally creates a gas condensation which can eventually become a detached clump (Masciadri & Raga 2001). Both of these mechanisms are plausible scenarios for the creation of A2 and A2, and it would be interesting to be able to distinguish between them.
Ejection and accretion are believed to be intimately linked in protostars, so if A2 and A2 were created during an episode of increased mass loss, one would expect that increased accretion would also have been occuring. Assuming that the mass ejection rate is about 10 times smaller than the accretion rate (e.g. Hartmann & Kenyon 1996), then the total mass accreted during this episode must have been about 2 M⊙. Very young protostars derive much of their luminosity from accretion, so one could wonder if such an episode of increased accretion might have produced a detectable increase in the total luminosity of IRAS 16293–2422. To try and answer that question, one must characterize the timescale of the ejection/accretion episode.
From Fig. 2, it is clear that by 2007.62, the ejecta had become detached from A2. As a consequence, a conservative upper limit on the timescale of the ejection event is 2.34 yr, the time elapsed between the ejection and the 2007.62 observation (Sect. 3.1). The corresponding lower limit on the accretion rate during the event would be 8.5 10-8 M⊙ yr-1, and the corresponding lower limit on the excess accretion luminosity 1.3 L⊙ (here we have assumed that all the accretion energy is released on the stellar surface, and that the stellar radius is 3 R⊙). The bolometric luminosity of IRAS 16293–2422 is about 15 L⊙ (Sect. 1), so the increased accretion should have produced a 10% increase in the total luminosity of the source during the assumed 2.34 yr duration of the event.
Of course, the duration of the event might have been significantly shorter than 2.34 yr. An alternative way of estimating the characteristic timescale is the following. The ejecta are currently about ( 17 AU) across (they were likely smaller in the past since A2 appeared to be unresolved in the 1.3 cm observations obtained in 2006.11). A clump of that size moving at 240 km s-1 would become fully detached from its ejecting star in about 1.06 107 s ( 0.34 yr, just about 4 months). If this provides a good estimate of the true duration of the ejection event, then the mass accretion rate during the event would have been 6 10-7 M⊙ yr-1, and the corresponding excess accretion luminosity 9 L⊙. This would have produced a 60% increase in the total luminosity of the source during the 4 month duration of the event.
We conclude that if the creation of the A2/A2 pair is the result of an increase in the mass accretion/ejection rates of component A2, their birth should have been accompanied by a 10–60% increase in the total luminosity of IRAS 16293–2422. Most of the luminosity of IRAS 16293–2422 is radiated in the far-infrared and sub-millimeter parts of the electromagnetic spectrum, so the corresponding luminosity increase should be sought there. In particular, there have been several sub-millimeter observations of IRAS 16293–2422 obtained with the Sub-Millimeter Array (SMA) in the last few years (T. Bourke, private communication). Note that IRAS 16293–2422 is a multiple system (Sect. 1) and that the only member of the system which should have experienced an increase in luminosity is component A2. While components A1 and A2 are not resolved in SMA observations, component A is well resolved from component B (e.g. Chandler et al. 2005). Moreover, component A and B happen to have similar sub-millimeter fluxes (e.g. Chandler et al. 2005). As a consequence, the total sub-millimeter luminosity increase for component A in SMA images ought to be at least 20–120% and should be detectable.
We note that an ejection/accretion event such as the one considered in the present discussion would remain fairly modest in comparison with the more spectacular FUOr events which produce increases in the luminosity, mass accretion rates, and mass ejection rates of several orders of magnitude (Hartmann & Kenyon 1996). In this sense, we would only have witnessed a “mini-outburst”. The very fact that such a mini-outburst would have been observed, however, would indicate that they most likely occurred quite frequently. They may, therefore, offer more tractable evidence of the relation between accretion and outflow phenomena than the more dramatic, but much less common FUOr events.
If the creation of the A2/A2 pair is related to a modification of the jet ejection speed without an associated increase in mass accretion rate, no change in the luminosity of IRAS 16293–2422 is expected. Thus the presence or absence of an associated luminosity increase would be a good discriminant between the two possibilities. We note that a 30% increase in the velocity of a fairly modest underlying jet (with of a few 10-7 M⊙ yr-1) lasting for a few months, would be sufficient to accumulate a mass of order 10-8 M⊙ in a working surface.
4 Relative motion between A1 and A2
The motion of A1 relative to A2 between the late 1980s and 2005 has been investigated in detail by Loinard (2002) and Chandler et al. (2005). Neither the 1.3 cm observation obtained in 2006.11 (where A2 is blended with A2) nor the 2008.95 data (where A1 is blended with A2) can be used to track the relative motion between A1 and A2 further. However, A1 and A2 are well resolved in the 2007.62 observation. The value of their relative position angle in this new observation is 90 3∘, significantly larger than the position angle in 2003–2005 (Chandler et al. 2005, Loinard et al. 2007 – Fig 3). It is, however, in good agreement with the general evolution of the position angle since the late 1980s. The separation between A1 and A2 in the 2007.62 3.6 cm observation is 0.365 0.010 in good agreement with all previous measurements (Fig. 3).
Thus, the position angle between A1 and A2 has now changed by more than 40∘ since the late 1980s (from less than 50∘ then, to 90∘ now). Moreover, there is no indication in the data that the rate of change is, in any way, decelerating. Although further monitoring will be needed in the coming years and decades, these characteristics are already difficult to reconcile with the idea of a precessing jet. Indeed, the maximum precession angles typically observed in low-mass young stars are less than 10∘, and rarely exceed 15∘ (e.g. Matthews et al. 2006). The relative motions between A2 and A1 are more readily explained in terms of a Keplerian orbit between two protostars. The fit shown in Fig. 3b implies a rate of position angle change with time of 1.98∘ yr-1, corresponding to an orbital period of 182 yr. For a circular orbit in the plane of the sky333The fact that the jet from A2 is likely nearly along the line of sight (Sect. 3.1) would be consistent with an A1/A2 orbit nearly in the plane of the sky; in young binary systems, a coplanarity between the orbital plane and the orientation of the disks corresponds to the most stable configuration. (which would produce the observed linear increase of the position angle), the total mass of the A1+A2 system would be almost exactly 2 M⊙ (assuming a separation of and a distance to Ophiuchus of 120 pc –Loinard et al. 2008). Based on an analysis of the absolute proper motions, Loinard (2002) and Chandler et al. (2005) have argued that the center of mass of the A1/A2 system must be significantly closer to A2 than to A1 in this Keplerian scheme, implying that A2 must be significantly more massive than A1. A reasonable estimate would be 1.5 M⊙ for A2 and 0.5 M⊙ for A1. This would be in reasonable agreement with the bolometric luminosity of IRAS 16293–2422 ( 15 L⊙).
In a recent submillimeter observation, yet another compact source was detected toward component A (Chandler et al. 2005). This object (called Ab) is located about to the northeast of the A1/A2 pair (see Fig. 1). Since it has only been detected at one wavelength so far, the nature of Ab is difficult to assess. Chandler et al. (2005) argued that it might be another protostellar source in the system, but the lack of a strong compact counterpart at 0.7 cm in recent VLA data (Loinard et al. 2007) might favor an interpretation in terms of a starless clump. If Ab were a protostar, then component A would overall be (at least) a triple system, whereas it might only be double if Ab is a starless clump. In any case, taking into account the fact that component B –to the north-west of the system– is also associated with a protostar (e.g. Rodríguez et al. 2005; Chandler et al. 2005) and that components A and B are located in the center of a common, dense, centrally condensed, envelope (e.g. Looney et al. 2003), we must conclude that IRAS 16293–2422 is most likely a very young hierarchical multiple system.
IRAS 16293–2422 has long been known to drive a multi-lobe outflow system composed of two compact bipolar flows at P.A. 60∘ and 110∘, and a larger monopolar lobe located farther east (Mizuno et al. 1990). Recent high-resolution SMA observations of the two compact outflows strongly suggest that both are driven from within the A component of IRAS 16293-2422 (Yeh et al. 2008). As mentioned earlier, the outflow at P.A. 60∘ is now known to be driven by A2. Since the A1/A2 pair is most likely a compact binary system, it is tempting to associate the flow at P.A. 110∘ with A1. Interestingly, while the dynamical ages of the two flows are comparable (500 to 1,000 yr), the mechanical luminosity of the flow at P.A. 60∘ (from A2) is about twice that of the flow at P.A. 110∘ (that we tentatively attribute to A1). This would be consistent with the higher mass of A2 as compared to A1.
5 Conclusions and perspectives
In this article, we presented two new high-quality 3.6 cm images of the young protostellar system IRAS 16293–2422 obtained in August 2007 and December 2008 with the Very Large Array. These observations confirm that the radio sources A2 and A2 recently identified in the system are ejecta from the protostar A2, and that we seem to have witnessed the very birth of a pair of Herbig-Haro knots. The mass of each of the ejecta is estimated to be 10-8 M⊙. If the creation of the ejecta was related to an increase in mass accretion rate, the birth of A2/A2 must have been accompanied by an increase in the total luminosity of IRAS 16293–2422 of 10–60%.
Source A2 itself, which was blended with A2 in recent observations, is again visible in the data. This allows us to further monitor the relative motion between A1 and A2, and to provide very suggestive evidence that the A1/A2 pair is a tight binary system. Including component B to the north-west of the system, IRAS 16293–2422, therefore, appears to be a very young hierarchical multiple system. Observations similar to those presented here obtained in the coming few years to decades ought to provide a very accurate determination of the mass of the various protostars in IRAS 16293–2422, and a very detailed characterization of this nearby very young multiple stellar system.
References
- Andre et al. (2000) Andre, P., Ward-Thompson, D., & Barsony, M. 2000, Protostars and Planets IV, 59
- Anglada (1995) Anglada, G. 1995, Revista Mexicana de Astronomia y Astrofisica Conference Series, 1, 67
- Arce & Goodman (2002) Arce, H. G., & Goodman, A. A. 2002, ApJ, 575, 911
- (4) Castets, A., Ceccarelli, C., Loinard, L., Caux, E., & Lefloch, B. 2001, A&A, 375, 40
- (5) Ceccarelli, C., Castets, A., Caux, E., Hollenbach, D., Loinard, L., Molinari, S., & Tielens, A.G.G.M. 2000, A&A, 355, 1129
- Ceccarelli et al. (1998) Ceccarelli, C., et al. 1998, A&A, 331, 372
- (7) Chandler, C.J., Brogan, C.L., Shirley, Y.L., & Loinard, L. 2005, ApJ, 532, 371
- (8) Duchêne, G., Delgado-Donate, E., Haisch, K.E., Jr., Loinard, L.; Rodríguez, L. F. 2007, Protostars & Planets V, B. Reipurth, D. Jewitt, and K. Keil (eds.), University of Arizona Press, Tucson, 279
- Hartmann & Kenyon (1996) Hartmann, L., & Kenyon, S. J. 1996, ARA&A, 34, 207
- (10) Hirano, N., Mikami, H., Umemoto, T., Yamamoto, S., & Taniguchi, T. 2001, ApJ, 547, 899
- Jørgensen et al. (2008) Jørgensen, J. K., Johnstone, D., Kirk, H., Myers, P. C., Allen, L. E., & Shirley, Y. L. 2008, ApJ, 683, 822
- (12) Loinard, L. 2002, RMAA, 38, 61
- Loinard et al. (2008) Loinard, L., Torres, R. M., Mioduszewski, A. J., & Rodríguez, L. F. 2008, ApJ, 675, L29
- Loinard et al. (2007) Loinard, L., Chandler, C. J., Rodríguez, L. F., D’Alessio, P., Brogan, C. L., Wilner, D. J., & Ho, P. T. P. 2007, ApJ, 670, 1353
- Looney et al. (2003) Looney, L. W., Mundy, L. G., & Welch, W. J. 2003, ApJ, 592, 255
- Masciadri & Raga (2001) Masciadri, E., & Raga, A. C. 2001, AJ, 121, 408
- Marti et al. (1995) Marti, J., Rodriguez, L. F., & Reipurth, B. 1995, ApJ, 449, 184
- Matthews et al. (2006) Matthews, B. C., Hogerheijde, M. R., Jørgensen, J. K., & Bergin, E. A. 2006, ApJ, 652, 1374
- (19) Mizuno, A., Fukui, Y., Iwata, T., Nozawa, S., & Takano, T. 1990, ApJ, 356, 184
- (20) Mundy, L. G., Wootten, H. A., Wilking, B. A., Blake, G. A., & Sargent, A. I. 1992, ApJ, 385, 306
- Rodriguez et al. (1980) Rodriguez, L. F., Moran, J. M., Ho, P. T. P., & Gottlieb, E. W. 1980, ApJ, 235, 845
- Podio et al. (2009) Podio, L., Medves, S., Bacciotti, F., Eislöffel, J., & Ray, T. 2009, A&A, 506, 779
- (23) Rodríguez, L.F., Loinard, L., D’Alessio, P., Wilner, D.J., & Ho, P.T.P. 2005, ApJ, 621, L133
- Shang et al. (2004) Shang, H., Lizano, S., Glassgold, A., & Shu, F. 2004, ApJ, 612, L69
- (25) Wootten, A. 1989, ApJ, 337, 858
- Yeh et al. (2008) Yeh, S. C. C., Hirano, N., Bourke, T. L., Ho, P. T. P., Lee, C.-F., Ohashi, N., & Takakuwa, S. 2008, ApJ, 675, 454
| Epoch | Project | Synthesized Beam | aaFlux density of component B. | ||
|---|---|---|---|---|---|
| (GHz) | (Jy beam-1) | (mJy) | |||
| 2003.65 | AL589 | 8.46 | ; P.A.= | 36 | 0.61 0.08 |
| 2005.20 | AC778 | 43.23 | ; P.A.= | 179 | 26.5 0.5 |
| 2006.11 | AL672 | 22.46 | ; P.A.= | 47 | 6.5 0.2 |
| 2007.62 | AL703 | 8.46 | ; P.A.= | 45 | 0.61 0.09 |
| 2008.95 | AL728 | 8.46 | ; P.A.= | 52 | 0.60 0.10 |
| Epoch | Source | (J2000.0) | (J2000.0) | ||
|---|---|---|---|---|---|
| (GHz) | 16h32m | –24∘28′ | (mJy) | ||
| 2003.65 | 8.46 | A1 | 0.81 0.08 | ||
| A2 | 1.35 0.08 | ||||
| 2006.11 | 22.46 | A1 | 0.78 0.09 | ||
| A2 | 0.64 0.05 | ||||
| A2+A2 | 3.58 0.27 | ||||
| 2007.62 | 8.46 | A1 | 0.50 0.08 | ||
| A2 | 0.70 0.07 | ||||
| A2 | 0.60 0.07 | ||||
| A2 | 0.62 0.09 | ||||
| 2008.95 | 8.46 | A1+A2 | 0.93 0.09 | ||
| A2 | 1.26 0.13 | ||||
| A2 | 0.93 0.10 |