The Progress of Solar Cycle 24 at High Latitudes
Abstract
The “extended” solar cycle 24 began in 1999 near 70∘ latitude, similarly to cycle 23 in 1989 and cycle 22 in 1979. The extended cycle is manifested by persistent Fe XIV coronal emission appearing near 70∘ latitude and slowly migrating towards the equator, merging with the latitudes of sunspots and active regions (the “butterfly diagram”) after several years. Cycle 24 began its migration at a rate 40% slower than the previous two solar cycles, thus indicating the possibility of a peculiar cycle. However, the onset of the “Rush to the Poles” of polar crown prominences and their associated coronal emission, which has been a precursor to solar maximum in recent cycles (cf. Altrock 2003), has just been identified in the northern hemisphere. Peculiarly, this “Rush” is leisurely, at only 50% of the rate in the previous two cycles. The properties of the current “Rush to the Poles” yields an estimate of 2013 or 2014 for solar maximum.
Air Force Research Laboratory, NSO/SP, PO Box 62, Sunspot, NM 88349, USA
1. Introduction
Altrock (1997) and earlier authors (cf. Wilson et al. 1988) discussed the high-latitude “extended” solar cycle seen in the Fe XIV corona prior to the appearance of sunspots and active regions at lower latitudes. For example, persistent coronal emission appeared near 70∘ latitude in 1979 and 1989 and slowly migrated towards the equator, merging with the latitudes of sunspots and active regions after several years. Wilson et al. (1988) discussed other observational parameters that have similar properties, and this was updated by Altrock, Howe and Ulrich (2008) for torsional oscillations.
Altrock (2007) showed that the high-latitude coronal emission was situated above the high-latitude neutral line of the large-scale photospheric magnetic field seen in Wilcox Solar Observatory synoptic maps, thus implying a connection with the solar dynamo.
Altrock (2003) discussed coronal emission features seen in Fe XIV which, prior to solar maximum in cycles 21 - 23, appeared above 50∘ latitude and began to move towards the poles at a rate of 8 to 11 ∘. This motion was maintained for a period of 3 or 4 years, at which time the emission features disappeared near the poles. This phenomenon has been referred to as the “Rush to the Poles” (RttP). It was first identified in solar-crown prominences, and it was first observed in the corona by Waldmeier (1964). Altrock concluded that (i) the maximum of solar activity, as defined by the smoothed sunspot number, occurred 1.5 0.2 yr before the extrapolated linear fit to the RttP reached the poles, and (ii) the RttP could be used to predict the date of solar-cycle maximum up to three years prior to its occurrence. He stated that, “For solar cycle 24, a prediction of the date of solar maximum can be made when the RttP becomes apparent, approximately eleven years after its cycle-23 onset on 1997.58, or 2008 - 2009. When that occurs, the average slope for cycles 21 - 23, 9.38 1.71 ∘, can be used to predict the arrival date of the RttP at the poles, and then the average lag [time between solar maximum and the date the extrapolated linear fit to the RttP reached the poles], 1.52 0.20 yr, can be used to predict the date of solar maximum …”
2. Observations
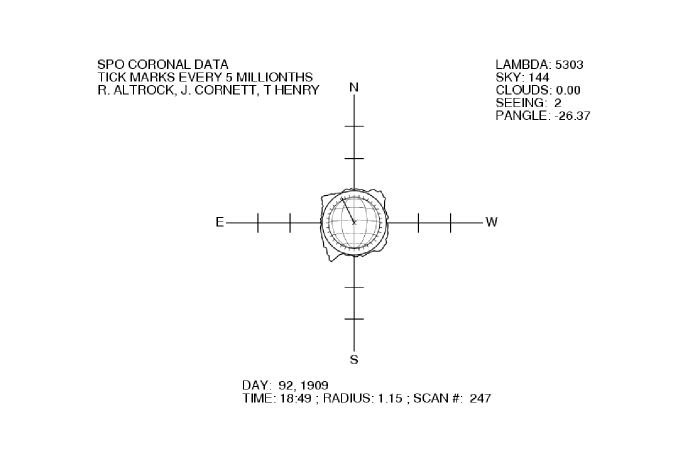
Observations of the Fe XIV 530.3 nm solar corona have been attempted three to seven times a week since 1973 with the photoelectric coronal photometer and 40-cm coronagraph at the John W. Evans Solar Facility of the National Solar Observatory at Sacramento Peak (Fisher 1973 and 1974; Smartt 1982). The photometer automatically removes the highly-variable sky background. Scans at 0.15 solar radii () above the limb every 3∘ in position angle show coronal features overlying active regions, prominences, large-scale magnetic field boundaries, etc. Observations near solar minimum continue to show coronal emission overlying high-latitude neutral lines even when there are no active regions at the limb. Figure 1 shows a sample solar-minimum scan. Note (i) a lack of low-latitude active region emission and (ii) emission occurring at higher latitudes.
3. Procedure
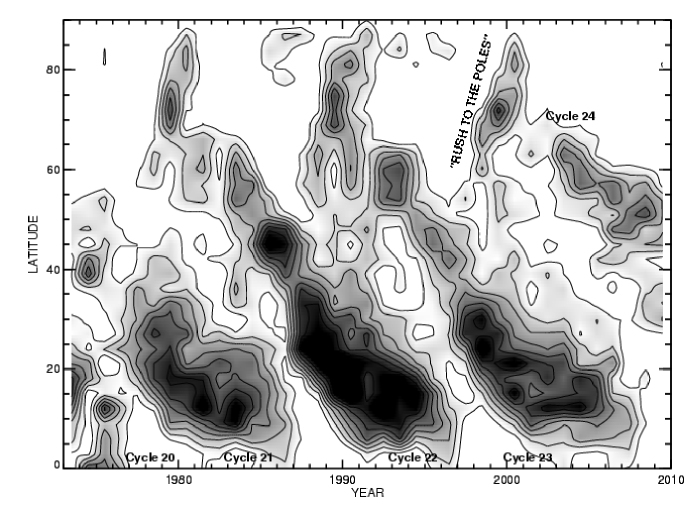
As discussed in Altrock (1997), the daily scans of the corona in Fe XIV at 1.15 are examined to determine the location in latitude of local intensity maxima, and each maximum is plotted on a synoptic map of latitude vs. time. Altrock (1997) Figure 3 shows such a synoptic map from 1973 to 1996. Note that nowhere in this analysis is the value of the intensity used, and that allows tracking of very faint features. To clarify the solar-cycle behavior of the intensity maxima, the number of points at each latitude in the synoptic map is averaged over a given time interval. This process allows us to correct the figure for days of missing data, which is an important step in order to correctly interpret the data. Figure 2 shows annual averages of the number of intensity maxima, also averaged over the north and south hemispheres.
4. Discussion
In Figure 2 we can clearly see the nature of extended solar cycles and RttP over the last 30+ years. Extended solar cycles begin near 70∘ latitude and end near the equator about 18 years later, as can be seen in cycles 22 and 23. Note that cycle 24 began similarly to cycles 22 and 23; however, it has been migrating equatorward more slowly. The rates for cycles 22 - 24 have been -5.3, -4.7 and -3.1 ∘, respectively. Most recently, emission took a sudden jump down to around 30∘ , and there is an indication that the RttP could be developing. This suggests to use a higher-resolution (if noisier) graphic.
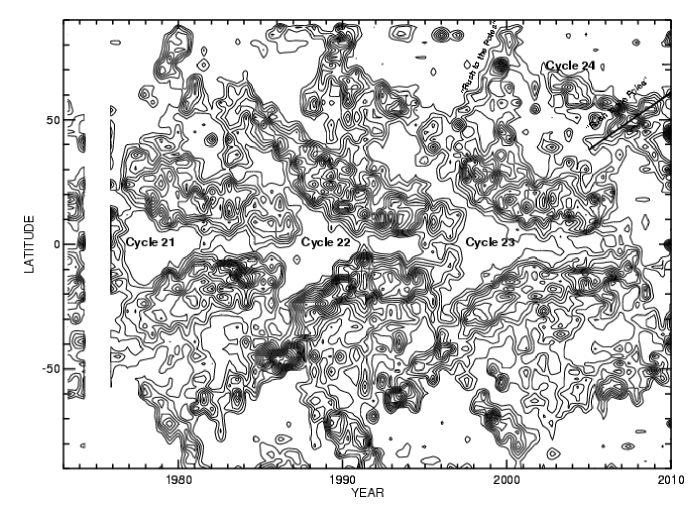
Figure 3 shows the data with a temporal average of 189 days, or seven 27-day rotation periods (approximately semiannual). In addition we now examine both hemispheres independently. Here we see that the extended cycle 24 (the equatorward-moving emission) appears to have recently split into two branches, most easily seen in the northern hemisphere. This has occurred previously, notably in the northern hemisphere in approximately 1991, after which the lower latitude branch eventually disappeared. So it is difficult to say to what the current split may lead.
The more interesting development is the appearance in 2005 of the RttP in the northern hemisphere, marked by a label, “Rush to the Poles”, and a linear fit, both seen in the upper right-hand corner of the graph. No such feature is yet evident in the southern hemisphere, which only may mean it is not yet visible in these noisy data or that it is delayed. In any case, we can use the northern hemisphere data as an indicator of when solar maximum will occur. The current RttP rate is estimated to be 4.6∘ (recall 9.4 1.7 ∘ average in the previous three cycles [Altrock 2003]). This 50% lower rate makes the earlier suggestion to use the previous higher rate to estimate the time of cycle maximum invalid (see discussion in Introduction).
At the current rate, the extrapolated RttP will reach the north pole at 2016.3. If we apply the previously-determined 1.5 0.2 yr offset between solar maximum and arrival at the poles (see Introduction), this would imply solar maximum at 2014.8 0.2. However, using that offset could be somewhat dubious, considering the slow “rush” this cycle.
A method that is possibly more reliable is to use the property that solar maximum occurs when the center line of the RttP reaches a critical latitude. In the previous three cycles this latitude was 76∘, 74∘ and 78∘, for an average of 76∘ 2∘ [this can be determined from the figures in Altrock (2003)]. At the current rate, this will occur at 2013.3 0.5. If the RttP rate increases, solar maximum would be earlier, although there is no reason to believe that this will occur.
Thus, the two methods using the coronal “rush to the poles” result in predictions for solar maximum at 2013.3 0.5 and 2014.8 0.5, or 2013-2014.
Nothing in this analysis yields the sunspot number to be expected at solar maximum.
5. Conclusions
The location of Fe XIV intensity maxima in time-latitude space displays an 18-year progression from near 70∘ to the equator, which has been referred to as the “extended” solar cycle. Cycle 24 emission began proceeding towards the equator similarly to previous cycles, although at a 40% slower rate. In addition, in 2009 the northern hemisphere “Rush to the Poles” became evident and is proceeding at a 50% slower rate than in recent cycles. Both of these facts indicate that cycle 24 is peculiar. Analysis of the “Rush to the Poles” indicates that solar maximum will occur in 2013 or 2014, but there is no indication of the strength of the maximum. There is at this time no confirmation of this prediction from the southern hemisphere.
Acknowledgments.
The observations used herein are the result of a cooperative program of the Air Force Research Laboratory and the National Solar Observatory. I am grateful for the assistance of NSO personnel, especially John Cornett, Timothy Henry, Lou Gilliam and Wayne Jones, for observing and data-reduction and analysis services and maintenance of the Evans Solar Facility and its instrumentation.
References
- Altrock (1997) Altrock, Richard C. 1997, Solar Phys., 170, 411
- Altrock (2003) Altrock, Richard C. 2003, Solar Phys., 216, 343
- Altrock (2007) Altrock, Richard C. 2007, Eos, Trans. Am. Geophys. Union, 88(52), Fall Meeting Suppl., Abstract SH53A-1052
- Altrock et al. (2008) Altrock, R. C., Howe, R., & Ulrich, R. 2008, in Astronomical Society of the Pacific Conference Series Vol. 383, Subsurface and Atmospheric Influences on Solar Activity, ed. R. Howe, R. W. Komm, K. S. Balasubramaniam, and G. J. Petrie, (Astronomical Society of the Pacific), 335
- Fisher (1973) Fisher, R. R. 1973, A Photoelectric Photometer for the Fe XIV Solar Corona, AFCRL-TR-73-0696, 15 pp.
- Fisher (1974) Fisher, R. R. 1974, Solar Phys., 36, 343
- Smartt (1982) Smartt, R. N. 1982, in SPIE 331, Instrumentation in Astronomy IV, 442
- Waldmeier (1964) Waldmeier, M.: 1964, ZAp, 59, 205
- Wilson et al. (1988) Wilson, P. R., Altrock, R. C., Harvey, K. L., Martin, S. F., and Snodgrass, H. B. 1988, Nature, 333, 748