11email: jrobrade@hs.uni-hamburg.de
Quiescent and flaring X-ray emission from the nearby M/T dwarf binary SCR 1845-6357
Abstract
Aims. X-ray emission is an important diagnostics to study magnetic activity in very low mass stars that are presumably fully convective and have an effectively neutral photosphere.
Methods. We investigate an XMM-Newton observation of SCR 1845-6357, a nearby, ultracool M 8.5 / T 5.5 dwarf binary. The binary is unresolved in the XMM detectors, however the X-ray emission is very likely from the M 8.5 dwarf. We compare its flaring emission to those of similar very low mass stars and additionally present an XMM observation of the M 8 dwarf VB 10.
Results. We detect quasi-quiescent X-ray emission from SCR 1845-6357 at soft X-ray energies in the 0.2 – 2.0 keV band, as well as a strong flare with a count rate increase of a factor of 30 and a duration of only 10 minutes. The quasi-quiescent X-ray luminosity of erg/s and the corresponding activity level of / point to a fairly active star. Coronal temperatures of up to 5 MK and frequent minor variability support this picture. During the flare, that is accompanied by a significant brightening in the near-UV, plasma temperatures of 25 – 30 MK are observed and an X-ray luminosity of erg/s is reached.
Conclusions. SCR 1845-6357 is a nearby, very low mass star that emits X-rays at detectable levels in quasi-quiescence, implying the existence of a corona. The high activity level, coronal temperatures and the observed large flare point to a rather active star, despite its estimated age of a few Gyr.
Key Words.:
Stars: activity – Stars: coronae – Stars: individual SCR 1845-6357 – Stars: low-mass, brown dwarfs – X-rays: stars1 Introduction
The source SCR J1845-6357 (DENIS-P J184504.9-635747, 2MASS J18450541-6357475) - hereafter SCR 1845 - was discovered as a nearby, very red, high-proper motion object in the Super COSMOS RECONS (SCR) survey (Hambly et al., 2004; Henry et al., 2004); later trigonometric parallax measurements confirmed its proximity ( pc) to the Sun (Deacon et al., 2005). Further measurements improved this result, leading to a distance of pc (Henry et al., 2006) and making SCR 1845 one of the closest stellar systems containing a brown dwarf, comparable in distance to the famous T dwarf binary orbiting Indi (McCaughrean et al., 2004). Follow-up observations performed in 2005 had shown SCR 1845 to be a late-type dwarf binary that consists of an M 8.5 dwarf with a T 5.5 dwarf secondary, as deduced from IR observation with the VLT/NACO (Biller et al., 2006). This finding makes SCR 1845 the first late M/T dwarf binary system discovered. The substellar companion is an IR-bright, methane rich brown dwarf and with a separation of 4.5 AU (1.1″) in a rather close orbit around its host star. The age of the system (0.1 – 10 Gyr) and the mass of the companion (9 – 65 MJup) were, however, only poorly constrained by these data.
In a further work devoted to SCR 1845, Kasper et al. (2007) present additional IR imaging data and low-resolution spectroscopy, again obtained with VLT/NACO. These authors confirm the previous findings and constrain the mass of the secondary to 40 – 50 MJup, thus ruling out a giant planet. They further estimate the age of the system to 1.8 – 3.1 Gyr, consequently SCR 1845 is not particularly young. The spectrum of the primary component is well described by an M 8.5 dwarf with K, M⊙ and approximately solar metallicity. Adopting their J band magnitude (J ) and bolometric corrections from Reid et al. (2001), we derive a bolometric luminosity of erg/s for SCR 1845.
Magnetic activity phenomena in the outer atmospheric layers of late-type, very low mass stars are remarkable, since these stars are generally assumed to be fully convective so that a solar-type dynamo is not expected to operate. Furthermore, their cool atmospheres ( K) should be virtually neutral, leading to a high electric resistivity that inhibits the transport of magnetic energy through the photosphere and consequently also magnetic activity. Among other diagnostics like H, X-ray emission can put strong constraints on the possible activity generating mechanisms and indeed, recent X-ray observation indicate that many ultracool dwarf stars are actually quite active as expressed by their / ratio (see e.g. Robrade & Schmitt, 2009). Also less active very late-type stars exist, the M 8 dwarfs VB 10 with / is a prominent example (Fleming et al., 2003; Berger et al., 2008). Activity finally drops in the L dwarf regime where older brown dwarfs with K reside (see e.g. Mohanty & Basri, 2003; Audard et al., 2007). Thus at the very end of the stellar main sequence the full range of X-ray activity levels as observed for more massive magnetically active stars, i.e. /, is likely also present; however, high activity levels persist in late-type dwarfs much longer than in solar-like stars. The presence of significant magnetic activity in these objects requires the presence of an efficient operating dynamo mechanisms, for example an or turbulent dynamo.
No reports of magnetic activity on SCR 1845 have so far been presented in the literature. It was neither known to emit X-ray or radio emission nor does it appear in H or magnetic field surveys of ultracool dwarfs.
In this paper we present an X-ray observation of the ultracool dwarf binary SCR 1845, where we detect flaring as well as quasi-quiescent X-ray emission. The structuring of our paper is as follows; in Sect. 2 we describe the observation and data analysis, in Sect. 3 we present our results, discuss flares on very low mass stars in Sect. 4 and summarize our findings in Sect. 5.
2 Observations and data analysis
SCR 1845 was observed by XMM-Newton in September 2008 for approximately 20 ks (Obs.ID 0551022901); data analysis was carried out with the standard XMM software, the Science Analysis System (SAS) version 9.0 (de la Calle & Loiseau, 2008). XMM-Newton carries three X-ray CCD cameras with moderate spectral resolution, as well as two X-ray grating spectrometers providing higher spectral resolution. However, the detected signal in the RGS (Reflection Grating Spectrometer) detectors is rather weak; while we clearly see a few photons from prominent emission lines, e.g. O viii at 19 Å and O vii at 21.6 – 22.1 Å, the RGS spectra are not suitable for a quantitative analysis. Thus we consider only X-ray data taken with the EPIC (European Photon Imaging Camera), consisting of two MOS and one PN detector; all detectors operated in the ’Full Frame’ mode with the medium filter. The PN is the most sensitive instrument and primarily used for our analysis. The EPIC detectors are temporally affected by high background levels, thus to minimize contamination we extract photons from a 25 ″ circular region around the source position and restrict the analysis to the 0.2 – 2.0 keV band, where most of the source photons were detected. Only during a large flare occurring in our observation, photons of higher energies are present and a harder band (0.2 – 3.0 keV) is used for its study. The background was taken from close-by regions on the same CCD that contains SCR 1845. We additionally verified our findings by applying standard selection criteria, which exclude the respective high-background time intervals. Since we are dealing with a high proper motion object, we further derive the exact X-ray position with the source detection algorithm ’edetect_chain’.
Spectral analysis was performed with XSPEC V12.3 (Arnaud, 1996), and we use multi-temperature plasma models (APEC) with elemental abundances relative to solar values as given by Grevesse & Sauval (1998). We note that the applied metallicity is interdependent with the emission measure, and different combinations of both parameters lead to very similar results. Due to the proximity of the target, interstellar absorption is negligible and not required in the modelling of our X-ray data.
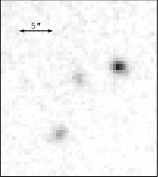
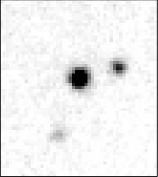
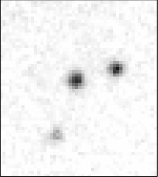
The OM (Optical Monitor), an onboard optical/UV telescope, was operated in the imaging mode in the U-band (300 – 400 nm, nm) and took five images with exposure times of 3.3 ks each, hence no detailed optical light curve is available. Nevertheless, the X-ray flare is clearly accompanied by a significant UV/optical brightening as can be seen in Fig. 1, where we show the pre-flare, flare and post-flare phase of SCR 1845 (center). In the exposure that covers the flare, SCR 1845 is about 2.6 mag brighter than in the pre-flare exposure. The other two objects visible in the images, DENIS J184507.7-635740 (upper right) and USNO-B 0260-0695925 (lower left), are not in common proper motion with SCR 1845.
| Obs.Time | X-ray Position | IR Pos. |
|---|---|---|
| 06 Sept. 08 | RA 18 45 08.63 ( 0.25 ″) | 18 45 08.65 |
| 18.5 ks | DEC -63 57 41.6 ( 0.25 ″) | -63 57 41.4 |
3 Results
An X-ray source is clearly detected at the expected position of SCR 1845. The X-ray position coincides very well with the expected position for epoch 2008.7 coordinates as calculated from the known proper motion and the 2MASS position. Both the positional error and the offset are about 0.3″ and no other X-ray source is located at distances of 1′ around the position of SCR 1845; thus the identification is unambiguous. Additionally the soft X-ray spectra and the observed flare make an unknown extra-galactic source very unlikely. The source detection parameters are summarized in Table 1.
The system is not resolved and appears like a point-source in the XMM data. While a small contribution from the brown dwarf to the overall X-ray emission cannot be excluded, it is very likely dominated by the late-type star. We thus assume in the following that the detected X-rays originate exclusively from the M 8.5 dwarf.
3.1 Light curve analysis
In Fig. 2 we show the X-ray light curve of SCR 1845, which reveals a strong flare in the second half of the observation and quasi-quiescent emission over the total exposure time. Light curves were obtained from the PN data in the 0.2 – 2.0 keV band and binned to 100 s and are plotted separately for the source region and for the background. The black histogram in the upper panel is the count rate from the source with 1 errors, the blue curve is the corresponding background level. As can be seen, the remaining background is negligible. For comparison we further show in the bottom panel of Fig. 2 the U-band brightness averaged over the respective OM exposure.
The X-ray brightness of SCR 1845 is never constant, thus we call this level quasi-quiescent. During the quasi-quiescent phase the average count rate is 0.05 cts/s. Variability of up to a factor of about two in count rate on timescales of several minutes is observed throughout the whole exposure. This behavior points to persistent minor activity on SCR 1845. An even stronger deviation of the quasi-quiescent level is seen towards the end of the observation, where the average count-rate increases to a value of about 0.1 cts/s. This additional X-ray emission is no afterglow of the flare; the count-rate drops to the pre-flare level rather quickly after the event. The flux increase is presumably related to the appearance of new active regions e.g. due to rotation, or enhanced activity in existing active regions.
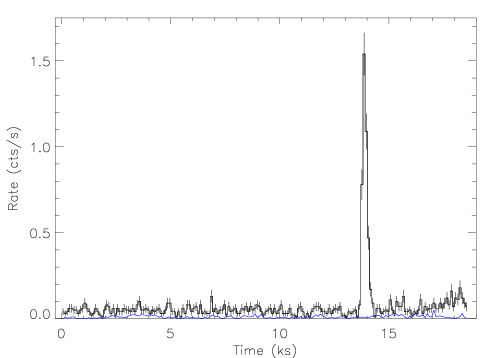


The most prominent feature of the X-ray light curve is the large flare; to investigate the short term behavior during the flare in greater detail we use the combined EPIC, i.e. PN+MOS data. The inset of Fig. 2 shows the X-ray light curve of the 30 min time interval covering the flare with a three times higher time resolution (33 s binning). The peak count rate of the flare is roughly 30 – 40 times higher than the average quasi-quiescent level observed before the flare. The strong, burst-like flare has a rise time of about 150 s and an exponential decay time of about 130 s; thus its light curve has a rather symmetric, triangular shape. The complete flare event appears and finishes in only ten minutes and no elevated flux level is observed before or after the flare. This behavior already points to a quite compact structure as origin of the flare event.
3.2 Spectral modeling
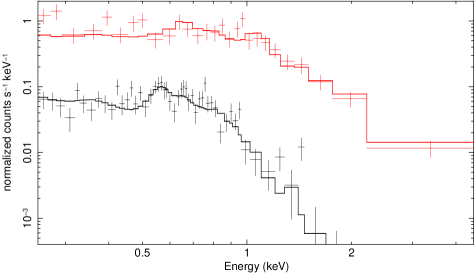
To determine the spectral properties of the X-ray emission from SCR 1845 we study the quasi-quiescent corona and the overall flare emission with the PN detector; the flare phase covers the 13.7 – 14.3 ks time interval. We applied several spectral models and find that a two-temperature model with solar abundances describes the data satisfactorily. For the flare a three temperature model results in a slightly better fit, but also in rather unconstrained components. Taking coronal abundances as a free parameter does not significantly improve the fit, thus we adopted solar abundances for modeling; note however, that the absolute value of the metallicity can only be poorly constrained with the data. The results from the spectral modeling are summarized in Table 2. In Fig. 3 we show the PN spectra extracted during quasi-quiescence and flaring with the respective applied model.
| Par. | Flare | Flare Peak | Unit | |
| T1 | 0.130.02 | 0.350.05 | 0.610.25 | keV |
| EM1 | 5.4 | 36 | 48 | cm-3 |
| T2 | 0.340.03 | 1.960.42 | 2.460.72 | keV |
| EM2 | 4.2 | 159 | 415 | cm-3 |
| (d.o.f.) | 1.3 (51) | 1.1 (20) | 1.1 (11) | |
| LX (0.2–2.0 keV) | 1.4 | 2.2 | 4.8 | erg/s |
| LX (2.0–5.0 keV) | 0.6 | 1.8 | erg/s |
The spectrum of the quasi-quiescent phase is described by a moderately active corona with dominant plasma components residing at temperatures in the range of 1.5 – 5.0 MK. The corresponding X-ray luminosity in the 0.2 – 2.0 keV band is erg/s, for the ROSAT 0.1 – 2.4 keV band we obtain a roughly 20 % higher flux. Adopting our modeling results, we derive an quasi-quiescent activity level of /, i.e. a level not too far from the saturation level around / for late-type stars, but much higher than those of weakly active stars like the Sun which have /.
With its X-ray luminosity and activity level SCR 1845 is intermediate to LHS 2065 and 1RXS J115928.5-524717, two M 9 dwarfs that are the latest X-ray detected dwarf stars (Robrade & Schmitt, 2008, 2009). Given the age estimate of a few Gyr for SCR 1845, high activity levels appear as long-lasting phenomena for very low mass stars. In comparison to activity levels of solar-like stars of the same age (Güdel et al., 1997), SCR 1845 is hundred times more active. Since the local stellar population has an age-spread from being rather young (few tens Myr) to intermediately old (few Gyr) and assuming that SCR 1845 is not atypical and its the age estimate is correct, high activity levels are expected for a relatively large number of very low mass stars at the end of the stellar main sequence.
3.3 Flare analysis
To investigate the flare and its generating structure in more detail, we study the evolution of its X-ray emission under the assumption of a single loop as origin of the flare. One can in principle determine the loop length by deriving the trajectory of the flare decay in the temperature/density diagram and adopting the formalism of Reale et al. (2004). However, the decay path can only be poorly constrained with our data, but we obtain a correction factor of the order of unity. Alternatively we derive the loop half length , formally its upper limit since we are neglecting reheating, from the decay time and flare peak temperature by using . We define the flare peak as time interval where the PN count rate exceeds 1.2 cts/s, providing 300 counts for a spectral analysis (see Tab. 2). Using our best fit values, we derive a loop half length of about cm, thus the loop is clearly smaller than typical stellar dimensions. Adopting a stellar radius of R 0.1 R⊙, a typical value for very low-mass stars, the loop half length is at most 0.3 R∗, i.e. it is clearly compact.
During the flare maximum SCR 1845 has an X-ray luminosity of erg/s in the 0.2 – 5.0 keV band, nearly sixty times above the quasi-quiescent level and plasma temperatures of up to 25 – 30 MK are observed during this phase. The total energy release of the flare is ergs for the 0.2 – 5.0 keV band, whereas about 30% are emitted at energies above 2.0 keV.
We can further estimate the energy released in the U-band by using a standard count rate to flux conversion factor (erg cm-2 s-1 Å-1). When attributing the excess flux of the OM exposure no. 4 exclusively to the flare we obtain an energy release in the U-band of about erg, i.e. a factor ten below the energy emitted in X-rays. We note that this result is robust and we obtain similar values when using e.g. the Vega reference method for flux conversion.
4 Flaring X-ray emission from ultracool dwarfs
In this section we discuss flare properties of very low mass stars in the solar neighborhood. We focus on likely stellar objects with with spectral type M 8 and later to have a clear separation to early/mid M dwarfs and require at least decent X-ray counting statistics. In the first chapter we concentrate on active stars, i.e. objects that are similar to SCR 1845 and in the second chapter we make a comparison to the moderately active dwarf VB 10. We note that with the exception of the L dwarf binary Kelu-1 (four photons, see Audard et al., 2007), no object beyond spectral type M9 has been detected in X-rays so far.
4.1 Flares on active very low mass stars
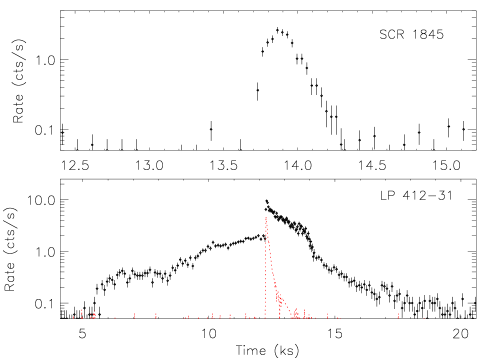
Only two larger flares with flux increases of at least one order of magnitude have been covered by modern X-ray missions an active, i.e. /, ultracool dwarfs. In comparison to the flare on SCR 1845, the flare on the young M 8 dwarf LP 412-31 also observed by XMM-Newton (Stelzer et al., 2006), is more energetic, has a much longer duration and exhibits a more structured X-ray light curve as shown in Fig. 4.
The fast decay of the SCR 1845 flare can be described by a single exponential and its origin is very likely in a single flaring loop that emerges out of the quasi-quiescent state. In contrast, the LP 412-31 flare shows preceding ’activity terraces’ that give rise to the main flare event. Only the very initial decay phase of the LP 412-31 flare () resembles the SCR 1845 decay, later the LP 412-31 event shows a significant flattening and substructure. Thus the flare does not decay in about 1 ks as extrapolated from the initial fast decay, it takes roughly 7 ks before the quasi-quiescent level is reached. This significantly longer timescale is more comparable to the one of the build-up of the enhanced pre-flare activity and the giant flare appears rather as the climax of an activity outbreak that likely involves a conglomerate of magnetic structures. Note however, that the optical emission originates nearly exclusively from the main event. Altogether this indicates that the LP 412-31 flare loop is connected to a more complex active region, while the SCR 1845 flare originated in a more simple, isolated structure.
All active ultracool dwarf stars show quasi-quiescent variability pointing to persistent minor activity, a phenomenon that is also observed on active M dwarfs of earlier spectral type (see e.g. Güdel et al., 2004; Robrade & Schmitt, 2005). However, the flare amplitude distribution might be different as already noted by Stelzer et al. (2006) for LP 412-31, a peculiarity that applies similarly to SCR 1845. Very low mass stars seem to release magnetic energy more preferably in singular, larger events rather than in the canonical flare distribution observed on the Sun and other cool stars, where the energy-release follows a power law with an exponent of (see e.g. Audard et al., 2000; Güdel, 2004). To have a complete coverage of available observations of suitable targets, we further investigated another archival 40 ks observation of LP-412-31 with Chandra and find that is shows exclusively quasi-quiescent emission without flaring. These data confirm it to be a very active star with a strong hot (10 MK) plasma component in quasi-quiescence, albeit with erg/s in the 0.2 – 2.0 keV band it has a factor two lower X-ray luminosity compared to the XMM-Newton observation performed nearly two years before. Together with the above mentioned observations of the M9 dwarfs LHS 2065 and RXS 1159, in total nearly 2 days (155 ks) of X-ray observations of active ultracool dwarf stars have been performed. This resulted in the observation of two large flares () and frequent minor variability of a factor up to a few, but no intermediate events.
An explanation may lie in the combination of the convective stellar structure and the resistivity of the outer atmospheric layers; additionally an efficient dynamo mechanisms must be present. Phenomenologically one might speculate that it requires a significant amount of magnetic energy to break through from the stellar interior producing the large flares, whereas the frequent, smaller variability might be related to magnetic activity that is generated closer to the stellar surface and released regularly. An underlying dynamo could be of the or the turbulent type (see e.g. Chabrier & Küker, 2006; Durney et al., 1993), but likewise both mechanisms may be operational at the same time. Anyway, despite different underlying stars, energetics and light curve evolution, both flares are isolated, vigorous events in a vastness of quasi-quiescent X-ray emission.
4.2 The case of VB 10
We compare our findings to the prominent, moderately active M 8 dwarf VB 10. It is located at a distance of 6.1 pc and has an X-ray activity level of /, using erg/s from Fleming et al. (2003). Thus it is one to two magnitudes less active than the above discussed objects. It has been observed in X-rays by several missions, e.g. two Chandra ACIS-S observations are published in the literature (Fleming et al., 2003; Berger et al., 2008); theses works contain also a more detailed description of this object. VB 10 is the only moderately active ultracool dwarf star where more that a few X-ray photons have been detected so far.
The first Chandra observation (Obs.ID 616) performed in July 2000 with a duration of 13 ks leaded to the detection of 26 counts on the back-illuminated S3 chip; no obvious strong variability is present and Fleming et al. (2003) modelled the ’quiescent corona’ with a 3 MK plasma, derived an X-ray brightness of erg/s and an activity level of /. The second Chandra observation (Obs.ID 7428) with a duration of 29 ks contains 58 counts, i.e. on average a very similar photon flux (Berger et al., 2008). However, in contrast to what is stated in their work, during this observation VB 10 is not located on the back-illuminated S3 chip but on the front-illuminated S2 chip. The front-illuminated chips have significantly less effective area at lower energies and thus the count rates and light curves are not directly comparable. Nevertheless, more emission from hotter plasma is present in July 2007, as deduced from spectral modelling and attributed by the authors to two flares on an underlying quiescent phase. They derived a factor two higher X-ray luminosity of erg/s from a two temperature model with a 3 MK and 15 MK component and an emission measure ratio of roughly two to one. In this observation VB 10 is, compared to the average flux, by a factor of two to three moderately brighter in the beginning and correspondingly fainter at later times. While clearly X-ray variability at a level of a few up to an order of magnitude is present, a detailed investigation, especially of individual flares, suffers from the low count rate.
In Fig. 5 we show X-ray light curves of VB 10 uniformly binned to 1 ks. The upper panel shows the light curves obtained from a re-analysis of the Chandra datasets with source photons extracted from a circular region with 2″ radius in the energy band 0.15 – 2.0 keV. Overall, the X-ray light curves of the July 2000 phase and the July 2007 phase look quite similar, but remind that different CCD chips were used. To derive a more comprehensive picture of VB 10, we additionally investigate a dataset from XMM-Newton (Obs.ID 0504010101), that we retrieved from the archive.
The XMM-Newton observation is with 44 ks (MOS detectors) the longest of the three and the usage of the thin filter provides high sensitivity at low energies, however it is affected by time intervals of high background. Nevertheless we are able to extract basic X-ray properties for VB 10, utilizing similar selection criteria as described above for SCR 1845. The XMM observation contains a clear example of an individual flare on VB 10 (Fig. 5, lower panel), but unfortunately the peak is not covered and only the decay is partially observed; we note that the more sensitive PN detector started observing even later. The shown MOS light curve is background subtracted and was extracted from a 15″ circular region in the 0.2 – 2.0 keV band.


Beside the flare at the beginning of the observation additional variability is present over the whole XMM exposure, however the exact level is again poorly constrained. The overall X-ray spectrum is well described by a two temperature model with plasma components at 2.5 MK and 7.5 MK and an emission measure ratio of about two to one, quite similar to the Chandra observation performed in July 2007. We derive an average X-ray luminosity of erg/s and for the flare phase (0 – 8 ks) erg/s. For the remaining quasi-quiescent phase we obtain erg/s; here already a 3 MK one temperature model describes the data quite well. When considering only the last 20 ks of the observation, i.e. the phase sufficiently after the flare event, we obtain an X-ray brightness of erg/s, very similar to VB 10 in the July 2000 observation. Altogether, the variability observed within half a day by XMM-Newton mainly covers the states of VB 10 observed in two Chandra exposures separated by seven years, with an additional flare being caught in its decay phase. This points to long term stable but always moderately variable X-ray emission, a state that we prefer to name - given the sensitivity of present day X-ray instrumentation - quasi-quiescence.
We note the detection of a larger X-ray flare on VB 10 with ROSAT HRI (10 photons), reaching an average X-ray brightness in the order of erg/s and an at least three times higher peak flux (Fleming et al., 2000), implying a flux increase by a factor of 100. Thus also moderately active ultracool dwarf stars produce intense X-ray flares, however a detailed study of time variability is complicated by their intrinsic X-ray faintness.
5 Summary and conclusions
-
1.
We detect quasi-quiescent X-ray emission as well as a large flare from the nearby, ultracool M8.5/T dwarf binary SCR 1845. This is the first report of magnetic activity from this object.
-
2.
In the quasi-quiescence state SCR 1845 is detected at soft X-ray energies below 2.0 keV with an X-ray luminosity of erg/s. This leads to an activity level of log /, pointing to a rather active star despite its age of several Gyr. SCR 1845 is one of the coolest main sequence star with securely detected quasi-quiescent X-ray emission.
-
3.
The flare has short duration of about 10 min and outshines the parent star by a factor of 50 at X-ray energies with a peak X-ray luminosity of log erg/s. Flare temperatures reach about 30 MK and in total roughly erg are emitted at X-ray energies during the event. The flare originates from a rather compact structure and is accompanied by a significant NUV/optical brightening in the corresponding OM image.
-
4.
The X-ray data from SCR 1845 and other recent observations support the hypothesis, that the flare energy distribution in active very low mass stars differs from the one observed in more massive late-type stars.
Acknowledgements.
This work is based on observations obtained with XMM-Newton, an ESA science mission with instruments and contributions directly funded by ESA Member States and the USA (NASA) and makes use of data obtained from the Chandra data archive. J.R. and K.P. acknowledge support from DLR under 50QR0803 and 50OR0703 respectively.References
- Arnaud (1996) Arnaud, K. A. 1996, in ASP Conf. Ser. 101: Astronomical Data Analysis Software and Systems V, ed. G. H. Jacoby & J. Barnes, 17
- Audard et al. (2000) Audard, M., Güdel, M., Drake, J. J., & Kashyap, V. L. 2000, ApJ, 541, 396
- Audard et al. (2007) Audard, M., Osten, R. A., Brown, A., et al. 2007, A&A, 471, L63
- Berger et al. (2008) Berger, E., Basri, G., Gizis, J. E., et al. 2008, ApJ, 676, 1307
- Biller et al. (2006) Biller, B. A., Kasper, M., Close, L. M., Brandner, W., & Kellner, S. 2006, ApJ, 641, L141
- Chabrier & Küker (2006) Chabrier, G. & Küker, M. 2006, A&A, 446, 1027
- de la Calle & Loiseau (2008) de la Calle, I. & Loiseau, N. 2008, http://xmm.esac.esa.int
- Deacon et al. (2005) Deacon, N. R., Hambly, N. C., Henry, T. J., et al. 2005, AJ, 129, 409
- Durney et al. (1993) Durney, B. R., De Young, D. S., & Roxburgh, I. W. 1993, Sol. Phys., 145, 207
- Fleming et al. (2003) Fleming, T. A., Giampapa, M. S., & Garza, D. 2003, ApJ, 594, 982
- Fleming et al. (2000) Fleming, T. A., Giampapa, M. S., & Schmitt, J. H. M. M. 2000, ApJ, 533, 372
- Grevesse & Sauval (1998) Grevesse, N. & Sauval, A. J. 1998, Space Science Reviews, 85, 161
- Güdel (2004) Güdel, M. 2004, A&A Rev., 12, 71
- Güdel et al. (2004) Güdel, M., Audard, M., Reale, F., Skinner, S. L., & Linsky, J. L. 2004, A&A, 416, 713
- Güdel et al. (1997) Güdel, M., Guinan, E. F., & Skinner, S. L. 1997, ApJ, 483, 947
- Hambly et al. (2004) Hambly, N. C., Henry, T. J., Subasavage, J. P., Brown, M. A., & Jao, W. 2004, AJ, 128, 437
- Henry et al. (2006) Henry, T. J., Jao, W., Subasavage, J. P., et al. 2006, AJ, 132, 2360
- Henry et al. (2004) Henry, T. J., Subasavage, J. P., Brown, M. A., et al. 2004, AJ, 128, 2460
- Kasper et al. (2007) Kasper, M., Biller, B. A., Burrows, A., et al. 2007, A&A, 471, 655
- McCaughrean et al. (2004) McCaughrean, M. J., Close, L. M., Scholz, R., et al. 2004, A&A, 413, 1029
- Mohanty & Basri (2003) Mohanty, S. & Basri, G. 2003, ApJ, 583, 451
- Reale et al. (2004) Reale, F., Güdel, M., Peres, G., & Audard, M. 2004, A&A, 416, 733
- Reid et al. (2001) Reid, I. N., Burgasser, A. J., Cruz, K. L., Kirkpatrick, J. D., & Gizis, J. E. 2001, AJ, 121, 1710
- Robrade & Schmitt (2005) Robrade, J. & Schmitt, J. H. M. M. 2005, A&A, 435, 1073
- Robrade & Schmitt (2008) Robrade, J. & Schmitt, J. H. M. M. 2008, A&A, 487, 1139
- Robrade & Schmitt (2009) Robrade, J. & Schmitt, J. H. M. M. 2009, A&A, 496, 229
- Stelzer et al. (2006) Stelzer, B., Schmitt, J. H. M. M., Micela, G., & Liefke, C. 2006, A&A, 460, L35