Stellar populations of Virgo cluster early-type dwarf galaxies with and without discs: a dichotomy in age?††thanks: Based on observations collected at the European Organisation for Astronomical Research in the Southern Hemisphere, Chile (programme 078.B-0178)
Abstract
Using VLT/FORS2 spectroscopy, we have studied the properties of the central (inner 320 pc) stellar populations of a sample of 26 nucleated early-type dwarf (dE) galaxies in the Virgo Cluster of magnitude range: -18.59 M -15.39 mag. With the addition of the data of Michielsen et al. (2008), extending the sample to 38 dEs, we find that these galaxies do not exhibit the same average stellar population characteristics for different morphological subclasses. The nucleated galaxies without discs, which are, on average, fainter than dEs with discs and distributed in regions of higher local density, are older and more metal poor (mean ages 7.5 Gyr and 3.1 Gyr, mean [Z/H] = 0.54 0.14 dex and 0.31 0.10 dex, respectively). The -element abundance ratio appears consistent with the solar value for both morphological types. Besides a well-defined relation of metallicity and luminosity, we also find a clear anti-correlation between age and luminosity. More specifically, there appears to be a bimodality: brighter galaxies ( mag), including the discy ones, exhibit significantly younger ages than fainter dEs ( mag). The magnitude overlap between these two subgroups appears to be resolved when considering in addition the weak correlation between age and local density, such that older galaxies at a given magnitude are located at higher densities. Thus there seems to be no significant difference between the stellar populations of dEs with and without discs when compared at the same magnitude and density. We thereby revisit the question whether both could belong to the same intrinsic population, with discs surviving only in lower-density regions. However, it appears less likely that fainter and brighter dEs have experienced the same evolutionary history, as the well-established trend of decreasing average stellar age when going from the most luminous ellipticals towards low-luminosity Es and bright dEs is broken here. The older and more metal-poor dEs could have had an early termination of star formation activity, possibly being “primordial” galaxies in the sense that they have formed along with the protocluster or experienced very early infall. By contrast, the younger and relatively metal-rich brighter dEs, most of which have discs, might have undergone structural transformation of infalling disc galaxies.
keywords:
galaxies: dwarf – galaxies: evolution – galaxies: formation – galaxies: stellar content – galaxies: elliptical and lenticular, cD – galaxies: clusters: individual: Virgo1 Introduction
Dwarf elliptical (dE) galaxies are the numerically dominant population in the present-day Universe (Sandage et al. 1985; Binggeli et al. 1987). They also exhibit strong clustering, being found predominantly in the close vicinity of giant galaxies, either as satellites of individual giants, or as members of galaxy clusters (Ferguson & Sandage 1989; Ferguson & Binggeli 1994). Unlike classical elliptical galaxies, stellar population studies show that these galaxies exhibit on average younger ages as compared to their giant counterparts, and also a lower metal content according to the correlation of metallicity and luminosity (Michielsen et al., 2008, hereafter M08). More detailed studies of dEs and the fainter dSphs in the Local Group, based on resolved stellar populations, reveal that most dE/dSphs have a fairly extended star formation history (e.g., Mateo 1998; Grebel & Gallagher 2004), with the last star formation activity ranging from a few gigayears ago to the time of re-ionisation. A number of studies in different clusters (e.g., Poggianti et al. 2001; Rakos et al. 2001; Caldwell et al. 2003; Geha et al. 2003; van Zee et al. 2004) also provide a wide range of ages for passive dwarfs. Another study, however, based on the velocity distribution of the Virgo dEs (Conselice et al. 2001), argue that dEs are not an old cluster population. This evidence suggests that dEs in nearby clusters have a mixed origin. Some have properties consistent with an early “primordial” formation, while others appear to be more recently formed, possibly from the transformation of progenitors with different morphological types.
Due to the distance of the Virgo cluster (16.5 Mpc, Mei et al. 2007), it is basically impossible to perform resolved stellar population studies of dEs in Virgo (see, however, the studies of the red giant branch by Caldwell 2006). Therefore, in order to probe the star formation history of these faint galaxies, we use integrated spectra with a good signal-to-noise ratio (SNR), providing a sensitive tool for stellar population studies through absorption feature measurements. The basic idea, which was first introduced by Burstein et al. 1984, is to provide a set of optical absorption line strength indices, commonly known as the Lick/IDS system or Lick indices (Burstein et al. 1984; Worthey et al. 1994a; Trager et al. 1998). It is now a widely used approach to determine the age, metallicity, and element abundance of galaxies from integrated spectra. The measured indices from the optical spectrum of a galaxy are compared to their values predicted by stellar population models, which are provided for example by Worthey 1994; Vazdekis & Arimoto 1999; Bruzual & Charlot 2003; Thomas et al. 2003; Schiavon 2007). The SSP-equivalent age and metallicity of a given galaxy are then determined as the ones of the model whose indices best agree with the measured ones.
It has already been noticed that dwarf elliptical galaxies of the Virgo cluster are consistent with solar [/Fe]-abundance ratios (Gorgas et al., 1997), indicating the slow chemical evolution in low-mass systems. Other studies (Geha et al. 2003; van Zee et al. 2004) confirmed this result.
As the most numerous type of galaxy in clusters, early-type dwarf galaxies are ideal probes to study the physical processes that govern galaxy formation and evolution in environments of different density. The pronounced morphology-density relation (e.g., Dressler 1980; Binggeli et al. 1987) suggests that early-type dwarfs were either formed mainly in high-density environments, or originate from galaxies that fell into a cluster and were morphologically transformed. Because having low masses their properties are expected to depend strongly on the environment they reside in. However, the actual formation mechanisms are still a matter of debate (see Jerjen & Binggeli 2005, and references therein). Most of the proposed scenarios are based on the vigorous forces acting within a cluster environment, such as interactions with a hot intracluster medium via pressure confinement, shocks or ram pressure stripping (Gunn & Gott 1972; Faber & Lin 1983; Silk et al. 1987; Babul & Rees 1992; Murakami & Babul 1999) and are able to transform dwarf irregular (dIrr) galaxies or late-type spirals into dEs (e.g., van Zee et al. 2004). Another scenario, the so-called harassment (Moore et al., 1996), can transform infalling late-type spirals through close encounters with massive cluster members, and the studies of Jerjen et al. (2000), Barazza et al. (2002), and De Rijcke et al. (2003) also suggest the possibility of production of dEs by harassment.
A recent systematic study by Lisker et al. (2006a, hereafter L06 and L07, respectively); Lisker et al. (2007, hereafter L06 and L07, respectively) revealed a striking heterogeneity of the class of early-type dwarfs. They found different subclasses, with significantly different shapes, colours, and spatial distributions. Those dEs with a disc component have a flat shape and are predominantly found in the outskirts of the cluster, suggesting that they – or their progenitors – might have just recently fallen into the cluster environment. In contrast, dEs with a compact stellar nucleus follow the classical picture of dwarf ellipticals: they are spheroidal objects that are preferentially found in the dense cluster center. Thus, given the structural heterogeneity and the scatter in their stellar population characteristics, the question arises whether they have a similar or different formation history? Here we address this question with exploring the relation between their stellar populations, structural parameters, and the environment.
The paper is structured as follows. In Section 2, we provide an overview of the data, the sample selection, and the observational parameters. In Section 3, we present the basic data reduction process. We describe in Section 4 the steps followed towards the Lick index measurement, including consistency checks of the models used, as well as tests and comparisons of Lick indices at different spectral resolutions. The derivation of stellar population parameters is outlined in Section 5. The results from our analysis are presented in Section 6, separating the actual index measurements (Section 6.1) and the subsequently derived ages and metallicties (Section 6.2). Finally, Section 7 presents the discussion of the results, and our conclusions.
2 Sample and Observations
2.1 Sample selection
Among the certain cluster members in the Virgo cluster catalogue (VCC, Binggeli et al., 1985; Binggeli & Cameron, 1993), we selected nucleated111 The classification of a dE as nucleated and non-nucleated is not unambiguous. Many Virgo dEs classified as non-nucleated in the VCC actually host a faint nucleus hardly detectable with the VCC data (Grant et al., 2005; Côté et al., 2006). A more appropriate term might be dEs without a nucleus of significant relative brightness as compared to the central galaxy light. dEs ( dE(N)s ) of different morphology, according to L06. Our target list comprises 8 dEs with discs ( dE(di)s ), 7 dE(N)s without discs located in the central region of the cluster, and 11 dE(N)s without discs located in the outer cluster regions (including 4 objects in the dense southern subcluster). The majority of dE(di)s populate the outer cluster regions (L07) and therefore need to be compared to similarly located dE(N)s not hosting a disc. One of the dE(di)s of our sample is known to host young stars in its central region, reflected in the blue central colour (VCC 0308, see Lisker et al., 2006b).
One major goal of our observations was to be able to analyse the nuclei themselves, which will be subject of a second publication to follow. Therefore, our target selection was guided by the estimated ratio of nucleus light to underlying galaxy light, and by the SNR of nucleus and host galaxy. Our sample is therefore mainly biased towards galaxies with relatively bright nuclei, both in absolute terms and relative to the galaxy’s central region. We will take this into account in the discussion section.
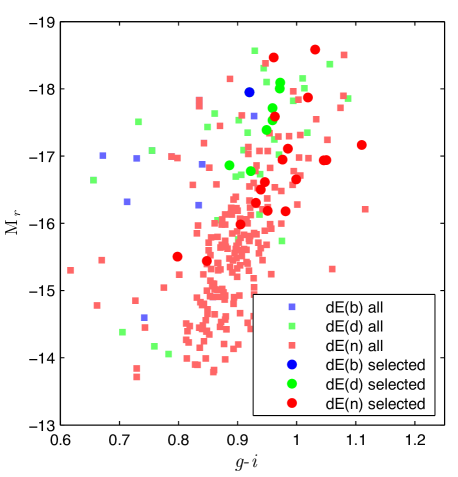
Furthermore, as shown in L07, the dE(di)s have, on average, somewhat bluer colours than the dE(N)s. This is reflected in our sample: Fig. 1 shows that the dE(di)s tend towards the bluer side of the colour-magnitude relation in g-i. Whether this effect is due to age or metallicity, and whether it is caused by the presence of a disc itself or by environmental density, will be addressed in the discussion section.
We believe that this is a representative sample of bright nucleated early-type dwarf galaxies of the Virgo cluster with different substructural types. Table 1 lists the sample galaxies and some of their basic properties. We also build an extended sample by adding Virgo dEs from the M08 sample whose morphology is defined in L06, and remeasuring their stellar population parameters from the reduced spectra, which were kindly provided by C. Conselice on behalf of the MAGPOP ITP222http://www.astro.rug.nl/peletier/MAGPOP_ITP.html collaboration. M08 selected their galaxies to be brighter than m mag, with high central surface brightness, and all but one (VCC 0917) hosting a central nucleus. In total, our extended sample thus comprises three dE(bc)s (of which one also hosts a disc, as mentioned above), 13 dE(di)s, and 22 dE(N)s that do not show disc features. Note that we removed VCC 0917 from M08 sample because it has a different subclass, as this galaxy is neither discy, nucleated, nor blue-centered according to L06.
| Name | RA | Dec | Type | Mr | Density333Local projected galaxy number density | Reff | RV | Remark |
| 1 | 2 | 3 | 4 | 5 | 6 | 7 | 8 | 9 |
| VCC0216 | 12:17:01.10 | 09:24:27.13 | d,n | 16.78 | 9.4 | 13.3 | 1281 26 | |
| VCC0308 | 12:18:50.90 | 07:51:43.38 | b,d,n | 17.95 | 3.6 | 18.7 | 1596 39 | also in M08 |
| VCC0389 | 12:20:03.29 | 14:57:41.70 | d,n | 18.00 | 15.6 | 17.2 | 1364 09 | |
| VCC0490 | 12:21:38.77 | 15:44:42.39 | d,n | 18.09 | 31.6 | 27.6 | 1267 12 | |
| VCC0545 | 12:22:19.64 | 15:44:01.20 | n | 16.61 | 52.6 | 13.3 | 1207 12 | |
| VCC0725 | 12:24:24.23 | 15:04:29.17 | n | 16.19 | 26.2 | 25.2 | 1854 110∗ | |
| VCC0856 | 12:25:57.93 | 10:03:13.54 | d,n | 17.71 | 18.2 | 15.9 | 1025 10 | also in M08 |
| VCC0929 | 12:26:40.50 | 08:26:08.60 | n | 18.58 | 26.1 | 20.5 | 910 10 | |
| VCC0990 | 12:27:16.94 | 16:01:27.92 | d,n | 17.39 | 14.8 | 9.9 | 1727 34 | also in M08 |
| VCC1167 | 12:29:14.69 | 07:52:39.22 | n | 16.95 | 45.1 | 27.3 | 1980 240∗ | |
| VCC1185 | 12:29:23.51 | 12:27:02.90 | n | 16.65 | 64.1 | 19.3 | 500 50 | |
| VCC1254 | 12:30:05.01 | 08:04:24.18 | n | 17.17 | 68.9 | 14.9 | 1278 18 | |
| VCC1261 | 12:30:10.32 | 10:46:46.51 | n | 18.47 | 21.0 | 22.5 | 1871 16 | also in M08 |
| VCC1304 | 12:30:39.90 | 15:07:46.68 | d,n | 16.86 | 15.1 | 16.2 | 109 78∗ | |
| VCC1308 | 12:30:45.94 | 11:20:35.52 | n | 16.50 | 30.2 | 11.4 | 1721 45 | |
| VCC1333 | 12:31:01.07 | 07:43:23.04 | n | 15.44 | 24.5 | 18.5 | 1251 28 | |
| VCC1348 | 12:31:15.73 | 12:19:54.38 | n | 16.94 | 52.4 | 13.1 | 1968 25 | |
| VCC1353 | 12:31:19.45 | 12:44:16.77 | n | 15.51 | 36.6 | 8.8 | 384 82∗ | |
| VCC1355 | 12:31:20.21 | 14:06:54.93 | n | 17.59 | 29.9 | 29.6 | 1332 63 | |
| VCC1389 | 12:31:52.01 | 12:28:54.53 | n | 15.98 | 42.9 | 12.8 | 858 25 | |
| VCC1407 | 12:32:02.73 | 11:53:24.46 | n | 16.95 | 35.7 | 11.8 | 1019 03 | |
| VCC1661 | 12:36:24.79 | 10:23:05.25 | n | 16.18 | 13.0 | 18.9 | 1457 34 | |
| VCC1826 | 12:40:11.26 | 09:53:45.99 | n | 16.30 | 13.3 | 7.8 | 2033 38 | |
| VCC1861 | 12:40:58.57 | 11:11:04.34 | n | 17.78 | 23.0 | 18.4 | 629 20 | also in M08 |
| VCC1945 | 12:42:54.09 | 11:26:18.09 | n | 17.11 | 26.6 | 21.5 | 1619 104∗ | |
| VCC2019 | 12:45:20.44 | 13:41:34.50 | d,n | 17.53 | 7.8 | 18.1 | 1895 44 | |
| Galaxies from Michielsen et al. (2008) incorporated in our extended sample: | ||||||||
| VCC0021 | 12:10:23.15 | 10:11:19.04 | b,n | 17.01 | 1.8 | 15.2 | 486 25 | |
| VCC0397 | 12:20:12.18 | 06:37:23.56 | d,n | 16.76 | — | 12.4 | 2471 46 | poss. mem. |
| VCC0523 | 12:22:04.14 | 12:47:14.60 | d,n | 18.57 | 20.2 | 25.7 | 1981 20 | |
| VCC0917 | 12:26:32.39 | 13:34:43.54 | - | 16.55 | 45.9 | 9.2 | 1238 20 | removed |
| VCC1087 | 12:28:14.90 | 11:47:23.58 | n | 18.50 | 54.9 | 28.4 | 675 12 | |
| VCC1122 | 12:28:41.71 | 12:54:57.08 | n | 17.13 | 66.0 | 19.1 | 476 10 | |
| VCC1183 | 12:29:22.51 | 11:26:01.73 | d,n | 17.82 | 28.2 | 19.6 | 1335 12 | |
| VCC1431 | 12:32:23.41 | 11:15:46.94 | n | 17.72 | 30.2 | 9.3 | 1505 21 | |
| VCC1549 | 12:34:14.83 | 11:04:17.51 | n | 17.24 | 28.3 | 10.9 | 1357 37 | |
| VCC1695 | 12:36:54.85 | 12:31:11.93 | d | 17.63 | 21.4 | 22.8 | 1547 29 | |
| VCC1910 | 12:42:08.67 | 11:45:15.19 | d,n | 17.86 | 28.1 | 13.6 | 206 26 | |
| VCC1912 | 12:42:09.07 | 12:35:47.93 | b,n | 17.83 | 19.6 | 22.3 | 169 28 | |
| VCC1947 | 12:42:56.37 | 03:40:36.12 | d,n | 17.61 | — | 9.4 | 974 19 | poss. mem. |
In column 1 we give the galaxy name according to the VCC. Column 2 and 3 represent the galaxy position
in RA and DEC (J2000.0), respectively. For column 4 we take the morphological classification given by L07 (with b=blue-centre, d=discy n=nucleated). Column 5 gives the galaxy absolute magnitude in the SDSS r-band taking mM = 31.09 (Mei et al., 2007), corrected for Galactic extinction (L07). Column 6 and 7 represent the local projected density (number per sq.deg., calculated from a circular projected area enclosing the 10th neighbor), and the effective radius in arcsec measured by L07, respectively. In column 8 we give the radial velocity in km/s provided by NED; for those galaxies whose radial velocity is not listed in NED∗ we measured their radial velocity from our data set, albeit with larger errors due to the low spectral resolution. In the last column we provide comments and indicate galaxies in common with the study of M08.
2.2 Observational characteristics
The observations were carried out over six half nights from March 16 to 22, 2007, with ESO VLT UT1/FORS2 (Appenzeller et al., 1998) in multi object spectroscopy (MXU) mode. The dates and other observational information are provided in Table 2. In this table, the last two columns give the number of exposures, the exposure time, and the resulting SNR per pixel of the combined spectra, measured at 5000 Å rest frame wavelength after co-adding them. Spectrophotometric standard stars were observed each night. The typical value of the seeing FWHM during the galaxy exposures was 1.3” as measured by Gaussian fitting of the field stars. The detector in FORS2 comprises two 2k 4k MIT CCDs, with a pixel size of 15 15 m2. The standard resolution collimator and the 2-pixel binned read-out yield a image scale of 0.25”pixel-1. The spectrograph slit width was chosen to be 1”, and covered 40” in length, using the GRIS300V grism providing a dispersion of 3.36 Åpixel-1. This setup yields a spectral resolution, as measured from the FWHM of the arc lines, of 11 Å at 5000 Å, which is below the instrumental resolution of Lick/IDS system (8.4 Å at 5000 Å) see Worthey & Ottaviani 1997.
| Name | Chip | Night | Exp. (s) | SNR(pixel-1) |
|---|---|---|---|---|
| VCC0216 | 1 | 2007-03-19 | 2 660 | 46 |
| VCC0308 | 1 | 2007-03-22 | 6 590 | 49 |
| VCC0389 | 1 | 2007-03-22 | 2 510 | 48 |
| VCC0490 | 1 | 2007-03-18 | 3 420 | 36 |
| VCC0545 | 1 | 2007-03-17 | 3 680 | 43 |
| VCC0725 | 1 | 2007-03-18 | 6 670 | 31 |
| VCC0856 | 2 | 2007-03-19 | 1 780 | 58 |
| VCC0929 | 1 | 2007-03-19 | 1 640 | 63 |
| VCC0990 | 1 | 2007-03-22 | 3 660 | 61 |
| VCC1167 | 1 | 2007-03-18 | 3 720 | 45 |
| VCC1185 | 1 | 2007-03-20 | 2 705 | 42 |
| VCC1254 | 2 | 2007-03-18 | 2 600 | 56 |
| VCC1261 | 2 | 2007-03-20 | 1 840 | 71 |
| VCC1304 | 1 | 2007-03-17 | 6 570 | 43 |
| VCC1308 | 1 | 2007-03-20 | 4 540 | 41 |
| VCC1333 | 1 | 2007-03-17 | 4 570 | 38 |
| VCC1348 | 2 | 2007-03-19 | 2 450 | 43 |
| VCC1353 | 1 | 2007-03-19 | 6 760 | 40 |
| VCC1355 | 1 | 2007-03-21 | 5 670 | 34 |
| VCC1389 | 1 | 2007-03-20 | 6 670 | 40 |
| VCC1407 | 2 | 2007-03-22 | 5 680 | 46 |
| VCC1661 | 1 | 2007-03-17 | 6 600 | 36 |
| VCC1826 | 1 | 2007-03-20 | 3 600 | 47 |
| VCC1861 | 1 | 2007-03-21 | 2 660 | 47 |
| VCC1945 | 1 | 2007-03-19 | 5 705 | 43 |
| VCC2019 | 1 | 2007-03-21 | 4 540 | 41 |
3 Data reduction
The first step in the data reduction was performed with the VLT FORS2 Pipeline Gasgano444http://www.eso.org/sci/data-processing/software/gasgano implemented on the EsoRex555http://www.eso.org/sci/data-processing/software/cpl/esorex.html data reduction package. This software performs the following basic tasks: bias subtraction, aperture identification, flat-fielding, cosmic-ray removal, and wavelength calibration (using the arc lines of the He Ne lamp). The recipe fors_calib is used for the definition of the extraction mask based on the flat field and arc lamp exposures, and is also used for the creation of the normalized flat and master bias. In addition to that, fors_calib also calculates the dispersion coefficients which are used for wavelength calibration during the final reduction of the science frames using the second recipe fors_science. The typical uncertainties of the wavelength solution were around 0.2 pixels or less, which is a good agreement with the FORS pipeline standard.
Since our spectra were taken in MXU mode, which allows a maximum slit length of 40”, the slit does not cover the full extent of our target galaxies and a sufficient region of the sky at the same time; instead, additional slits were placed on blank sky regions. For this reason, the FORS2 Pipeline does not provide a good result for the sky background subtraction for this type of spectra of spatially extended objects (as also mentioned in the pipeline manual), and left significant residual signatures of sky lines. Therefore, the night sky line removal has been done with iraf666Image Reduction & Analysis Facility Software distributed by National Optical Astronomy Observatories, which are operated by the Association of Universities for Research in Astronomy, Inc., under co-operative agreement with the National Science Foundation using the background task implemented on the oned package. Inherently, residuals and uncertainties from the sky subtraction could affect the line strength measurements that we will obtain from these data, so we have investigated thoroughly how this step is implemented. The sky background is obtained from the blank slits, which were placed along the extension of the galaxy slit. All the exposures have at least one blank slit for the sky background, in most cases more than one. Nevertheless, we found that the resulting sky-subtracted galaxy spectrum was almost completely insensitive to how the sky region was chosen, and whether one or two slits were used to sample the background. We have therefore chosen the sky regions using the full length of the blank slit, typically 38”, omitting 1” at either side of slit.
The photometric standard stars were observed in MOS mode. Here, the FORS2 pipeline sky subtraction did not leave any residuals, since the target is a point source and a sufficient amount of blank pixels are thus covered by the slit.
Once the galaxy frames were fully reduced, one-dimensional spectra were extracted by summing the pixel values in spatial direction along the central four arcseconds, corresponding to 320 pc with a distance modulus (16.5 Mpc, Mei et al. 2007). This is done in order to guarantee that the resulting Lick indices will have sufficiently small errors to allow a precise stellar population analysis, and to enable a direct comparison with the sample of M08, who used the same extraction aperture. This allows us to build an extended sample (see Sect. 2.1) by combining their and our galaxies.
The spectrophotometric calibration was done using the observations of 5 standard stars (LTT4816, LTT6248, LTT1215, LTT2415, and Feige56). The instrument response function was computed from the ratio of the observed standard star spectrum and the tabulated calibrated spectrum, and the resulting continuum correction was subsequently applied to the galaxy spectra. To correct for the effect of atmospheric extinction, we used the iraf task setairmass to define the effective airmass for each spectrum. Then, we applied the extinction correction (task calibrate) using the appropriate atmospheric extinction table (provided by Sabine Moehler). The spectral sensitivity functions as derived from the different stars varied by typically 1%, reaching 3% towards the edges of the wavelength range. Given these small variations, we created a single function from all standard stars, and are reasonably confident that the resulting internal relative flux calibration is good to 1%.
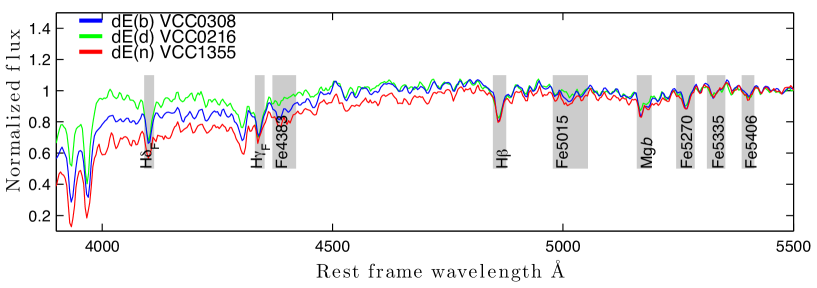
The individual spectra from different exposures of a given galaxy were then co-added using the iraf task scombine to produce a spectrum of higher SNR. Three typical flux calibrated combined galaxy spectra are shown in Fig. 2.
For the later calculation of index uncertainties, we also produced error frames, following the description by Cardiel et al. (1998), in particular the processing of error frames parallel to the reduction steps. In this sense, we have an error spectrum for each fully processed science spectrum that contains the propagation of the initial random errors (due to photon statistics and read-out noise) carried throughout the arithmetic manipulations in the reduction procedure.
4 Line Indices: measurement and calibration
In this section we provide the details of the measurement of line strength indices in the wavelength range 4000 Å to 6000 Å. The main step is to calculate the line strengths particularly for Lick/IDS indices (Trager et al., 1998), using one-dimensional spectra. This will allow us to compare the results to simple stellar population models of Bruzual & Charlot (2003, hereafter BC03), Thomas et al. (2003, here after TMB03) and AV/MILES (Vazdekis et al. 2009; in preparation)777http://www.iac.es/galeria/vazdekis, in order to derive SSP-equivalent ages and metallicities. In this work, we focus on maximizing the SNR of the spectra and on the ability to combine our dataset of 26 galaxies with the 12 of M08, who obtained their 1-D spectra by summing the central 4 arcsec in spatial direction. We therefore apply the same extraction to our spectra, and defer any study of potential population gradients to a later publication. Lisker et al. stated that a definite conclusion, as to whether the observed colour differences of different morphological subtypes are caused by age or metallicity effects, was not possible. With our good SNR in the central region, we can address this issue in a more appropriate and reliable way, by comparing our index measurements with stellar population models, in order to break the degeneracy of age and metallicity.
4.1 Line strength Measurement
The line index strengths were measured from flux calibrated spectra using the routine Indexf888http://www.ucm.es/info/Astrof/software/indexf/indexf.html developed by N. Cardiel. It uses the definition of the Lick indices from Trager et al. 1998 and calculates a pseudo-continuum (a local continuum level) for each spectral feature defined by the mean values within two pseudocontinuum bandpasses on either side of the spectral feature. This software also estimates the uncertainties resulting from the propagation of random errors and from the effect of uncertainties on radial velocity by performing Monte-Carlo simulations.
Note that we have not applied a velocity dispersion correction for our galaxies, because the expected galactic velocity dispersion, km s-1, is significantly below our spectral resolution km s-1. Therefore these corrections are not necessary.
4.2 Index Calibration and Stellar Population Model
There are several stellar population models that provide Lick indices for stellar populations of different ages and metallicities (e.g, Worthey 1994; Vazdekis & Arimoto 1999; BC03; TMB03). The models adopted in this paper are those of TMB03, BC03, and Vazdekis/MILES (new version based on MILES library, hereafter AV/MILES). The model of TMB03 has a variable -element abundance ratio, based on the standard SSP models computed with the code of Maraston (1998) with a Salpeter (1955) IMF. They provide Lick index values at Lick standard resolution. The new AV/MILES models are based on the previous models from Vazdekis & Arimoto (1999) and Vazdekis et al. (2003). They use Padova 2000 (Girardi et al., 2000) isochrones. They cover ages between 0.1 and 17.8 Gyr, and metallicities between 1.7 and 0.2 dex. The MILES library (Sánchez-Blázquez et al., 2006) used for these models has a 2.3 Å spectral resolution (FWHM). It covers the wavelength range from 3525 to 7500 Å, with a good calibration of the flux.
Among these three models (i.e., BC03, TMB03 & AV/MILES), we used BC03 and AV/MILES for the consistency test (see next paragraph), since they provide the full spectral energy distribution (SED) of SSPs, and can therefore be easily transformed to our spectral resolution of 11 Å. Furthermore, we also use AV/MILES for the correction of measured indices back to the Lick system (see section 4.3 for details of the correction procedure). We use the technique to derive stellar population estimates from AV/MILES at 11 Å resolution and TMB03 at Lick resolution (see section 5). Finally, after confirming the consistency between the stellar parameter estimates from these two different models, we use those obtained with TMB03 as our final values, since the TMB03 model also covers different [/Fe] ratios, and thus avoids potential problems of other models with fixed solar abundance ratio.
Before showing the main results, we provide consistency tests between our data and the different SSP model predictions of BC03 and AV/MILES. For this purpose, the model indices were computed at the resolution of our data (11 Å). We then create index-index plots that contain those indices sensitive to the same chemical species (Kuntschner, 2000). These plots provide an idea of how accurately the models reflect the data and, in consequence, they help us to interpret the results with respect to a chosen model. Moreover, it is important to check whether or not significant differences exist in the relative spectrophotometric calibrations of the data and the stellar libraries used by the models.
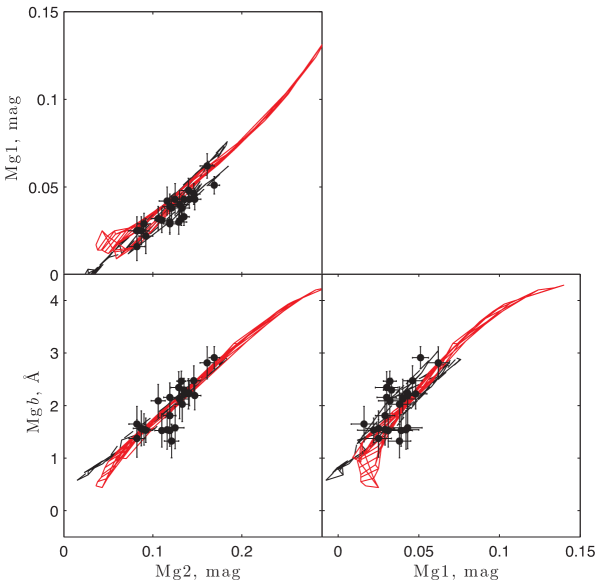
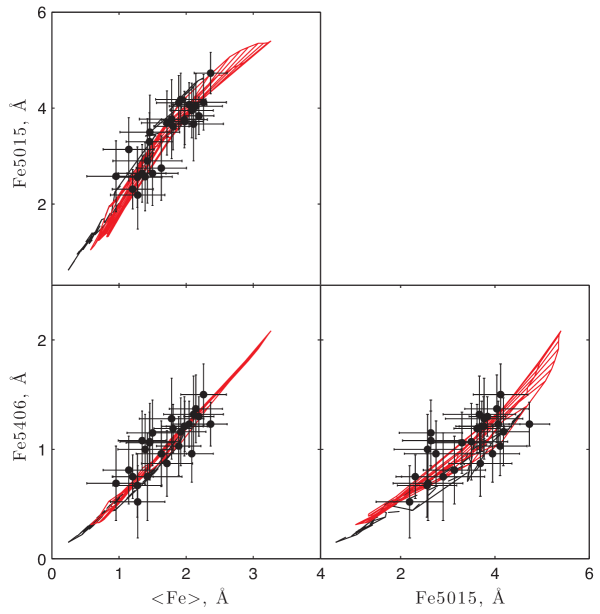
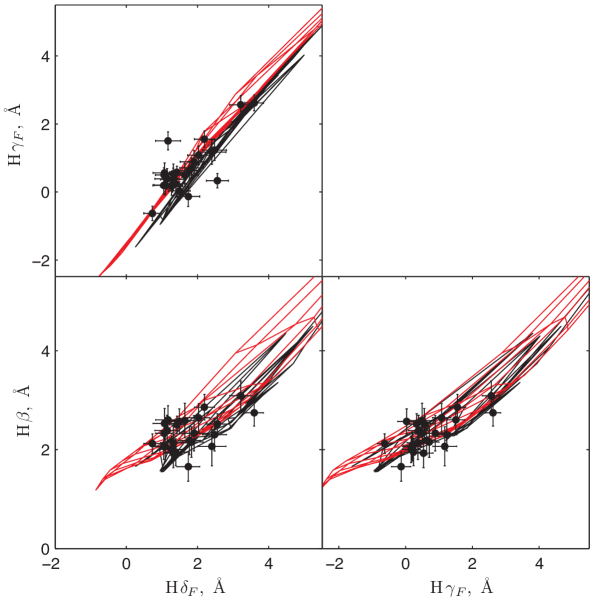
In Figure 3, different Mg indices are plotted against each other. The folded grids represent BC03 (black) and AV/MILES (red) models at 11 Å resolution, and the black dots are the indices measured from our sample. The plots show a good overall agreement between the measured index values and the model predictions, with a small systematic deviation for galaxies with smaller Mg indices. Likewise, Fig. 4 shows the relation between Fe, Fe5015 and Fe5406. In this plot, the scatter of the data points around the model grid locus is larger; however, this is explained by our measurement errors being larger there. Overall, the models do trace the mean trends in the data as a whole. In Fig. 5 we present the Balmer indices H, H and H. Here we find fairly good agreement for the AV/MILES model, while a small deviation can be seen between the BC03 model predictions and the data in the H and H indices.
4.3 Correction to the Lick system
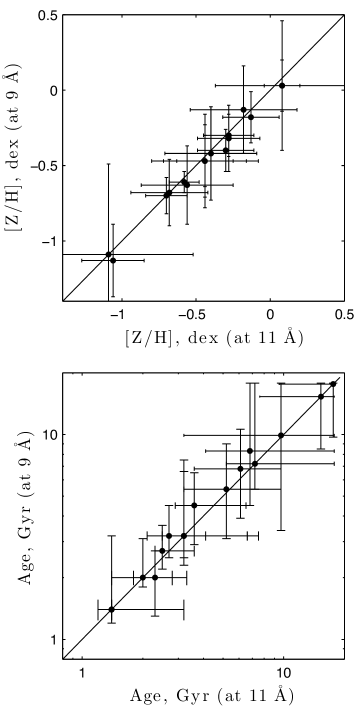
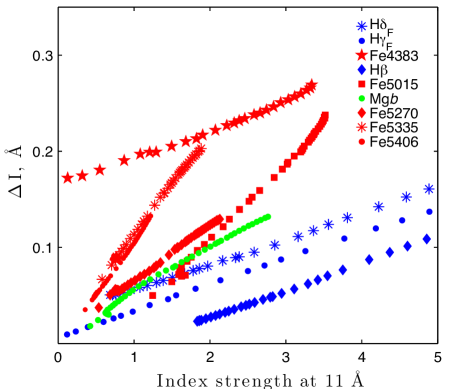
In this section, we investigate the behaviour of line indices at different resolutions, and provide corrections of our measured indices to the Lick system. We assess possible effects of a variation of the resolution on the ages and metallicities. For this purpose, we used AV/MILES model spectra. First, we degraded the model spectra to Lick resolution, since most studies in the literature are based on this resolution. However, for simplicity, we consider a fixed resolution of 9 Å, although the original Lick system varies from 8.4 to 11.5 Å depending on wavelength. In addition, we computed another degraded version of the model spectra, adopting the resolution of our data (11 Å). These two different resolutions are compared with each other in Fig.6, where we show the difference I between the measured indices for the two resolutions (i.e., I = Indices measured at 9Å 11Å) as a function of index strength. We find that Fe5335 and Fe5406 suffer slightly more degradation in the strong absorption region than the Balmer lines (H, H, and H) and the Mg indices. The percentage variations of these features are 10.5% for Fe5335 & Fe5406, 6% in case of Fe5270 & Fe5015 and Mgb, and even smaller for H (i.e., 2%) and other higher order Balmer lines. Note that these systematic deviations in absorption line strengths are smaller than half of the typical (statistical) measurement error from our galaxy spectra.
From the relations illustrated in Fig.6, we computed corrections for index strength for all the measured indices of our galaxy sample, in order to correct our data back to the Lick resolution (9 Å). This allows us to apply a separate correction for each galaxy, depending on its individual index strength. We then further corrected each index by applying the offsets between flux-calibrated spectra and the non-flux-calibrated original Lick/IDS system. For this purpose, we derived offsets from the Lick star spectra of the MILES library (see the Section A for more detail). With these corrections, our data qualify for comparisons with various models based on the Lick resolution. We are thus in the position to compare our data to the TMB03 models, which provide tabulated values of Lick indices as a function of age, [Z/H] and abundance ratio [/Fe].
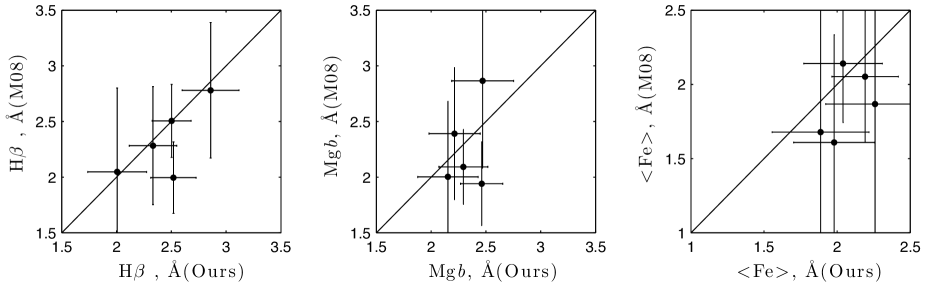
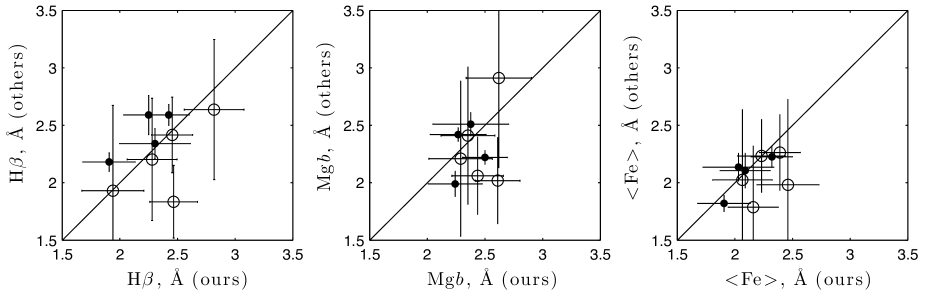
To examine the robustness of our approach of correcting the indices back to the Lick system, we compare the final corrected values of those galaxies common to Geha et al. (2003) and M08 with their published values. In Fig. 7, we find that these adopted corrections give results consistent with the previously published data. Therefore, our further analyses (i.e., index analysis, comparison to models, and extraction of age and metallicity) are done on the Lick system, unless explicitely stated otherwise.
5 Extraction of stellar population parameters from model fitting
As the aim of our work is to understand the star formation and evolutionary history of dwarf galaxies, we extract stellar population characteristics from those indices, and combinations of indices, that are sensitive to age, metallicity, or the relative abundance of different metals. Population synthesis models then provide us with SSP-equivalent, or mean luminosity-weighted, ages and metallicities. It is necessary to mention that the SSP-equivalent ages are biased towards younger ages (Trager et al., 2000, 2005) since in the optical, most of the light comes from the youngest component of the stellar population, and the age correlates most strongly with last star formation activity. Therefore, the measured age is influenced to a large extent by the last star formation activity in the galaxy. However, the SSP-equivalent metallicity is an excellent tracer of the light-weighted metallicity (Trager & Somerville, 2009). This is because hot, young stars contribute little to the metal lines in a composite spectrum (Trager et al., 2005; Serra & Trager, 2007).
To convert our measured indices to ages and metallicities, we used the minimization method as suggested by Proctor et al. 2004. In this method, we have the advantage to use a large set of indices to get the best fitting stellar population parameters. Therefore, it makes better use of the information that directly depends on age, metallicity and element abundance ratio, as compared to an analysis of single indices or index pairs. To perform the model fits, we first interpolated the model grid of TMB03 to a finer grid. The actual minimization was then performed on the age, [Z/H], and [/Fe] parameter space. While the method allows us to use as many indices as possible, we used only the nine indices with the best measurement quality (H, H, Fe4383, H, Fe5015, Mgb, Fe5270, Fe5335 & Fe5406) among the measured Lick indices from our spectra, which are tabulated in Table 5. To calculate the uncertainties in the stellar population parameters, we transformed the index error to the stellar population error contours and obtained the maximum of the error from that.
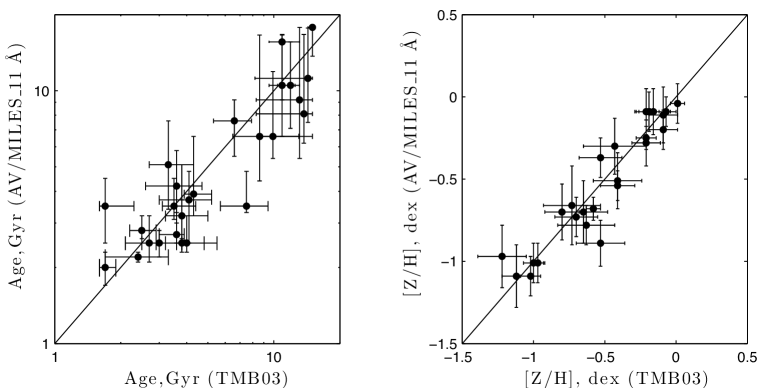
In Fig. 8 we show the comparison of derived ages and metallicities using different SSP models (TMB03 & AV/MILES). We derived TMB03 ages and metallicities by correcting our data to the Lick system as described above, while AV/MILES ages and metallicities were obtained directly at the resolution of our data (11 Å), by degrading the AV/MILES model down to this resolution prior to the model fitting. We use the same set of nine indices in both cases. Although, the measured age and metallicity agree well within the error limit, it seems that the majority of derived ages are overestimated, when we used the model TMB0 999As a further test to check the source of this slight offset, we compared the estimated SSP parameters from the model AV/MILES at different resolutions (i.e., at 9Å and 11Å) for the M08 sample. While no strong deviation is seen, there might be a small systematic bias of having younger ages when we degrade the resolution (the plot is given in Appendix C, Fig. 20). In any case, the estimated ages at different resolution agree well within the errors..
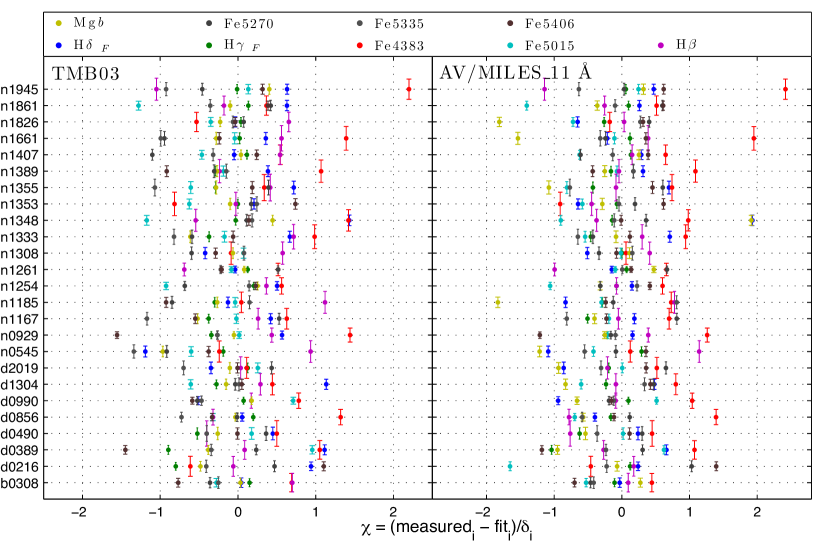
The behavior of the nine well-measured indices with respect to the best-fit model index value is shown in Fig. 9. Each colour represents a different index; the galaxy number along with its subtype label is provided as y-axis. Clearly, the index values lie well within the 2 uncertainty range, and surprisingly, in the vast majority of cases even within the 1 limit. It is interesting that the deviation of the Mgb indices for the AV/MILES model is systematically negative in almost all cases, and only for VCC 1348 it shows a significantly positive deviation. This galaxy has the highest element abundance among our sample (see Table 13). On the other hand, for the TMB03 model, the distribution of Mgb indices is rather symmetric, and all lie within the 1 error limit. Therefore the asymmetric distribution of Mgb for the AV/MILES model can be interpreted as an effect of having a fixed solar element abundance ratio. We also note that the deviations of Fe5015 and Fe4383 are mostly positive, while Fe5335 and Fe5406 have negative deviations in most cases. However, the overall mean of the deviations for all indices is always less than 0.5 sigma for the model TMB03.
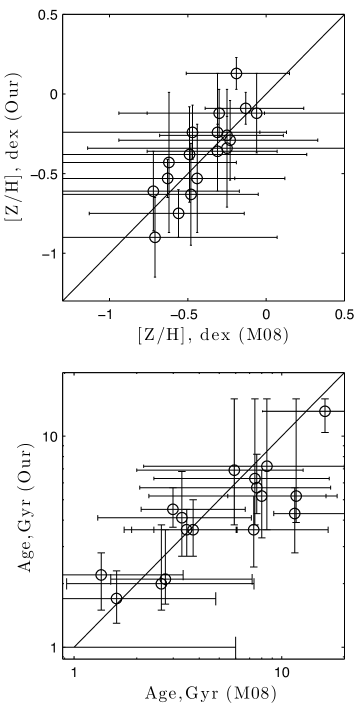
The derived values of age and metallicity for our dEs, along with their uncertainties, using the TMB03 model, are tabulated in Table 3. We also remeasured age and metallicity for the spectral sample of M08, using the same nine indices as in our sample. This guarantees a proper comparison, because M08 have used a different approach (i.e. quadratic interpolation over the nearest SSP model grid points in the H-[MgFe] diagram, as suggested by the method of Cardiel et al. 2003). Interestingly, we obtain a smaller error on age and metallicity, as compared to their measurement. Nevertheless, the measured ages and metallicities match very well (see Fig. 17).
6 Results
In this section, we first show the measured indices directly, in correlations with galaxy absolute magnitude, and in simple diagnostic index vs index plots, which compare them to model grids of age and metallicity. Finally, we analyse the stellar population results obtained from model fitting.
6.1 Lick indices for Virgo dEs
The relation of the galaxy magnitude and the indices that are widely used as age and metallicity indicators (i.e. H as good age indicator and [MgFe]′ as good mean metallicity indicator, with [MgFe]′ = (Thomas et al. 2003)) are shown in Figure 10. It is remarkable that we do not see any correlation between the age sensitive index H and magnitude, while a small but clear offset between nucleated early-type dwarfs with and without discs (dE(di) and dE(N), respectively) is seen. On the other hand, the metallicity sensitive index [MgFe]′ shows a weak anti-correlation with Mr, from the brighter dE(di)s down to the fainter dE(N)s. As we know (Worthey et al., 1994b), there are no such pure indices which only depend on either age or metallicity. Therefore, the exploration of age and metallicity by comparing the indices or their combinations to model predictions is presented further below.
VCC 0725 is an outlier, due to its fairly low Mgb content (see Table A2). This galaxy is one of the faintest among our sample and there is almost no galaxy light beyond the central nucleus. Therefore, we suspect that a fairly large domination of the residual sky noise within the four arcsec aperture could produce such an effect. Hence, we remove this galaxy from the sample during the subsequent analysis.
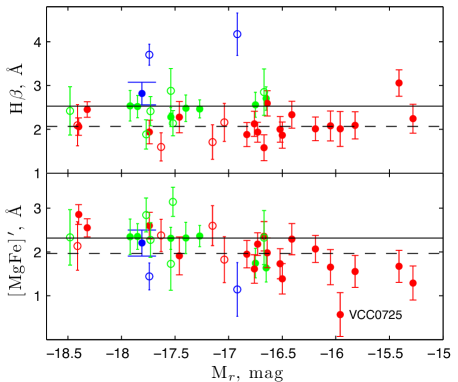
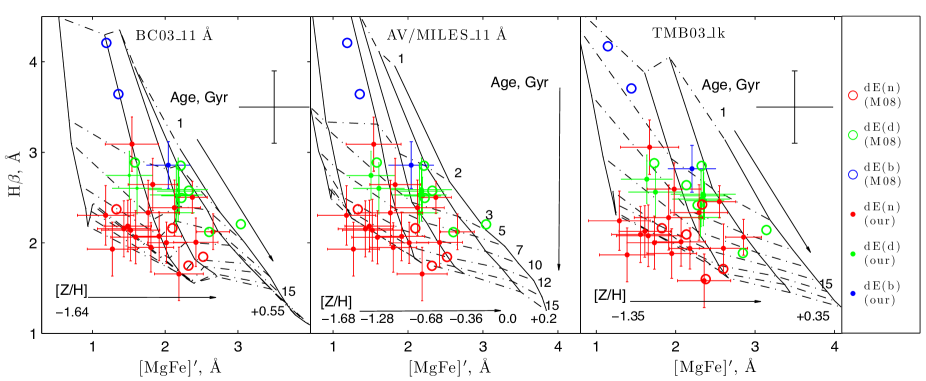
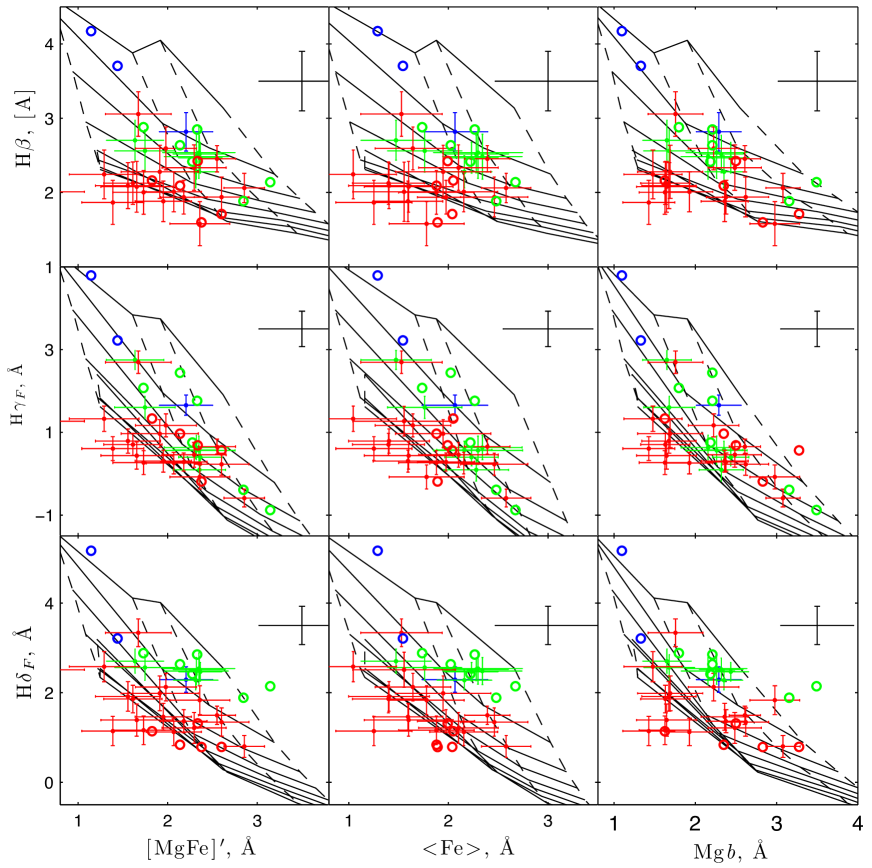
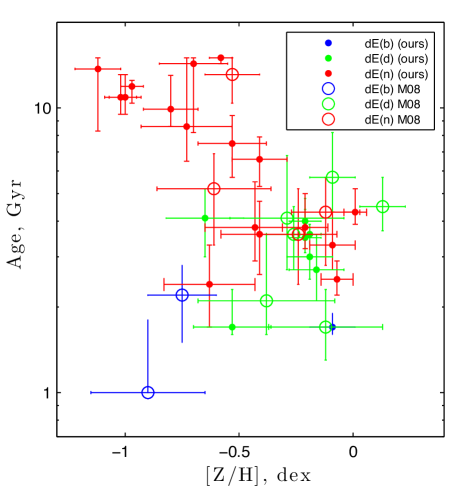
Figure 11 shows the distribution in H versus [MgFe]′ of dEs and a grid of simple stellar population models of BC03, AV/MILES & TMB03 (with [/Fe] = 0.0 dex). We use [MgFe]′ as a metallicity indicator, which is considered independent of [/Fe]-abundance, and H as age indicator, because its age sensitivity is greater and it is less degenerate with metallicity or abundance ratio variations than the other Balmer indices (Korn et al., 2005).
The solid lines, which are close to vertical, are of constant metallicity, whereas the dashed lines, which are close to horizontal, connect constant-age models (from top to bottom: 1, 2, 3, 5, 7, 10, 12, & 15 Gyr). All three panels appear to be fairly consistent with each other. However, there are some galaxies that lie outside of the model grid, located at low H, i.e., at the bottom left corner of the grid. Nevertheless, when taking into account their errorbars, they could still lie within the grid region. Moreover, it is not surprising that some galaxies (particularly dEs) fall outside of model grid. The same problem has already been noticed in the similar type of study of the dEs in the Coma cluster by Poggianti et al. (2001). This can be an issue of how the mass loss along the red giant branch is treated in the models, as discussed by Maraston et al. 2003.
We can see that most of the dEs appear to have sub-solar metallicity, supporting the results of van Zee et al. (2004), M08, Geha et al. (2003), Koleva et al. (2009) . On the other hand, their ages span a wide range. It is apparent that all dEs with blue central colours (dE(bc), blue symbols) are located towards fairly young ages, falling above the 3 Gyr line in the figure. There is almost no overlap between the dE(bc) and the dE(N) (red symbols), except for VCC 1353. Furthermore, most of the discy dEs (dE(di), green in colour) lie in between dE(N) and dE(bc). Thus, a clear division of the different subclasses in terms of age is present, with low, intermediate and high ages for dE(bc), dE(di) and dE(N), respectively. Despite of having a much larger spread, the dE(N)s are clustered in the bottom left corner of the grid – or even below the grid in some cases – centered on the low metallicity region. Interestingly, only three dE(di)s fall left of the metallicity line of [Z/H] = dex.
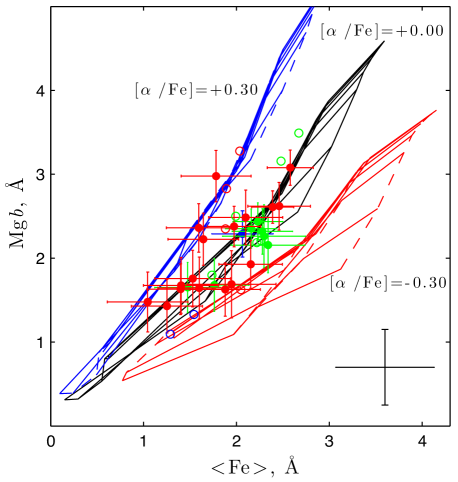
Fig. 12 presents the Mgb vs Fe diagram, where the data are superimposed on the TMB03 model with various element abundance ratios: [/Fe]= , 0.0, and +0.3 dex. The results from previous studies of the stellar populations of low-mass systems (Gorgas et al., 1997; Geha et al., 2003; Thomas et al., 2003), that the element abundance of dEs is consistent with solar, seem to be in agreement with our study. However, the scatter is fairly large for the dE(N)s, and on average they might be slightly more enhanced than the dE(di)s.
6.2 Age, metallicity and abundance ratios
| Galaxy | Age, Gyr | [Z/H] , dex | [/Fe], dex |
|---|---|---|---|
| VCC0308 | 01.7 | 0.09 0.10 | 0.01 0.07 |
| VCC0216 | 01.7 | 0.53 0.17 | 0.19 0.13 |
| VCC0389 | 04.0 | 0.21 0.07 | 0.01 0.08 |
| VCC0490 | 02.7 | 0.16 0.12 | 0.04 0.11 |
| VCC0856 | 03.5 | 0.21 0.07 | 0.01 0.08 |
| VCC0990 | 03.6 | 0.19 0.07 | 0.06 0.08 |
| VCC1304 | 04.1 | 0.65 0.17 | 0.04 0.18 |
| VCC2019 | 03.0 | 0.19 0.10 | 0.12 0.11 |
| VCC0545 | 11.9 | 0.97 0.05 | 0.06 0.22 |
| VCC0929 | 04.3 | 0.01 0.05 | 0.00 0.05 |
| VCC1167 | 10.9 | 1.00 0.07 | 0.07 0.16 |
| VCC1185 | 09.9 | 0.80 0.12 | 0.25 0.16 |
| VCC1254 | 06.6 | 0.41 0.12 | 0.07 0.08 |
| VCC1261 | 02.5 | 0.07 0.07 | 0.01 0.05 |
| VCC1308 | 03.8 | 0.21 0.10 | 0.07 0.09 |
| VCC1333 | 13.7 | 1.12 0.10 | 0.12 0.23 |
| VCC1348 | 15.0 | 0.58 0.05 | 0.38 0.09 |
| VCC1353 | 02.4 | 0.63 0.20 | 0.19 0.22 |
| VCC1355 | 03.8 | 0.43 0.22 | 0.16 0.16 |
| VCC1389 | 10.9 | 1.02 0.07 | 0.08 0.18 |
| VCC1407 | 14.3 | 0.70 0.15 | 0.13 0.13 |
| VCC1661 | 08.6 | 0.73 0.20 | 0.23 0.16 |
| VCC1826 | 07.5 | 0.53 0.15 | 0.15 0.14 |
| VCC1861 | 03.3 | 0.09 0.10 | 0.03 0.08 |
| VCC1945 | 03.6 | 0.41 0.17 | 0.07 0.12 |
| Galaxies from Michielsen et al. (2008): | |||
| VCC0021 | 01.0 | 0.90 0.25 | 0.00 0.30 |
| VCC1912 | 02.2 | 0.75 0.15 | 0.11 0.19 |
| VCC0397 | 01.7 | 0.12 0.25 | 0.04 0.16 |
| VCC0523 | 04.1 | 0.29 0.25 | 0.15 0.18 |
| VCC1183 | 03.6 | 0.26 0.12 | 0.06 0.11 |
| VCC1695 | 02.1 | 0.38 0.30 | 0.04 0.26 |
| VCC1910 | 05.7 | 0.09 0.10 | 0.05 0.08 |
| VCC1947 | 04.5 | 0.13 0.10 | 0.09 0.07 |
| VCC1087 | 03.6 | 0.24 0.17 | 0.12 0.16 |
| VCC1122 | 05.2 | 0.61 0.25 | 0.29 0.20 |
| VCC1431 | 13.1 | 0.53 0.12 | 0.28 0.12 |
| VCC1549 | 04.3 | 0.12 0.15 | 0.19 0.11 |
Using the combined sample of our galaxies and the re-measurement of the M08 galaxies’ spectra with the method of the minimization, we find a mean age of 3.0 Gyr and a mean metallicity of [Z/H] = 0.31 0.10 dex for the dE(di)s. In contrast, the mean values for the dE(N)s are 7.5 Gyr and [Z/H] = 0.54 0.14 dex. The dE(bc)s have comparatively young ages (i.e less than 3 Gyr). Two of them show a rather low metallicity ( 0.25 dex for VCC0021 and 0.15 dex for VCC1912), while the third one also belongs to the discy subclass (VCC 0308), and indeed has a significantly larger metallicity (i.e 0.10 dex), consistent with the other dE(di)s.
As a statistical comparison, we have used the Kolmogorov-Smirnov test for the goodness of fit with the null hypothesis that two observed distributions are from the same continuous distribution. The estimated probability PKS that the difference is at least as large as observed if they had been drawn from the same population, is PKS = 0.01, 0.03 and 0.15 for the age, metallicity, and [/Fe]-abundance distributions, respectively, of dE(N)s and dE(di)s. This apparently confirms that the age and metallicity differ significantly for dEs with and without discs. However, this interpretation is challenged when the stellar population characteristics are considered with respect to galaxy luminosity; details are given at the end of this section.
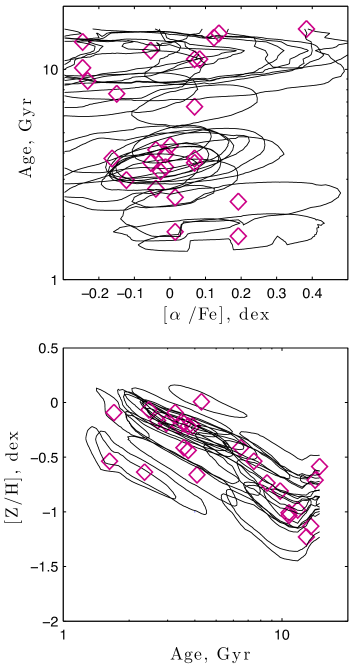
The galaxies in our sample follow a general trend linking age and metallicity: as displayed in Figure 13, we see that the derived ages are decreasing with increasing metallicity of the dEs, similar to the observation of Rakos et al. 2001 for Fornax dEs. Interestingly, we see that an age-metallicity anti-correlation is present for the dE(N)s, even tighter than previously noticed by Poggianti et al. (2001) for Coma cluster dEs. Such an age-metallicity anti-correlation is also found for giant early-type galaxies, but it is under debate because of the correlation of the metallicity and age errors (Trager et al., 2000; Kuntschner et al., 2001). Nevertheless, together with the dE(di)s, it can be noticed that the brighter dEs might even follow an opposite trend of increasing metallicity with increasing age. It needs to be mentioned, however, that the scatter of values is fairly large.
In addition, we provide a plot with the error ellipses (Fig.14), to better illustrate the behaviour of our measurements with respect to the age and metallicity anti-correlation. Kuntschner et al. 2001 suggest that, when the measurement errors in the line strength are not negligible, the tilt of the model grid leads to the correlated errors in age and metallicity, as visualized by the error contours in the age metallicity plane in Fig.14.
The luminosity-weighted metallicities derived from the well measured nine indices are shown as a function of galaxy absolute magnitude in Figure 15 (bottom left). Both dE(di)s and dE(N)s follow the well known metallicityluminosity relation (Poggianti et al., 2001). In contrast, we do not see any strong correlation between measured metallicity and local projected galaxy density (bottom right). In the top panel of the Figure, one can see that the dEs in general are consistent with solar [/Fe]-abundance, and we do not see any relation with luminosity or local density.
Unlike the correlation of metallicity and luminosity, the measured ages show an aniti-correlation with the luminosity, and correlation with local projected density, although the latter trend is not as strong as the former. It appears that this might be the cause of the apparent age difference between dEs with and without discs, since in addition to the relation with magnitude, the dE(N)s are situated in the denser cluster regions as compared to the dE(di)s. Thus, taking the left and right panels in Fig. 15 together, no significant difference is seen between dE(di)s and dE(N)s in either age or metallicity, as long as they are compared at the same magnitude and local density.
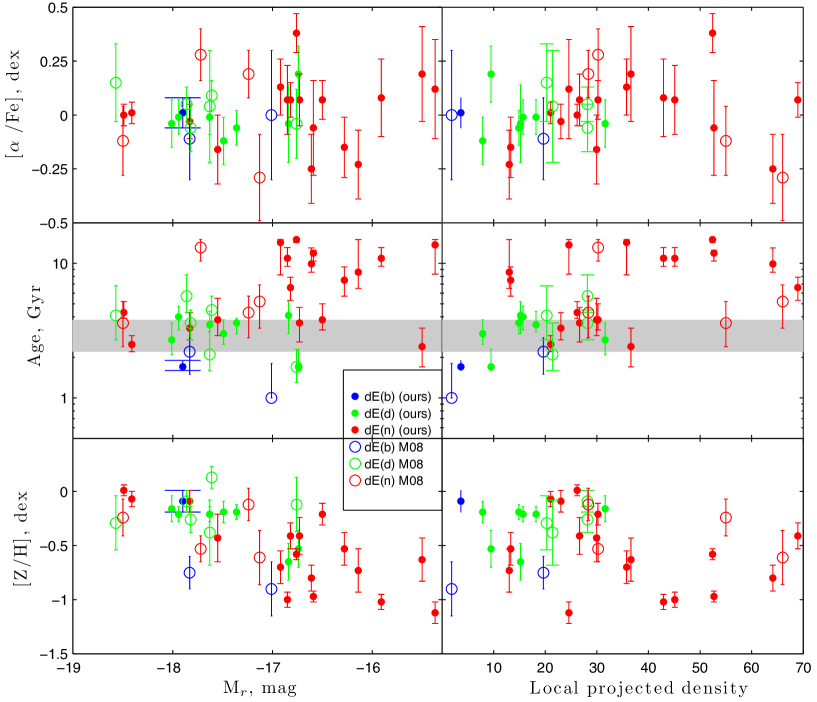
On the other hand, the bimodality in the age distribution is quite prominent. Interestingly, the majority of those dEs belonging to the group with lower ages lie consistently within the one-sigma area of the dE(di)s (gray-shaded region in Fig. 15). But we do not see any such strong bimodality in the metallicity distribution.
7 Discussion And Conclusion
We have undertaken a spectroscopic investigation of Virgo cluster dEs, deriving ages, metallicities and element abundance ratios for 38 dEs of different types, i.e., dEs with and without discs, and examined the variation of their stellar populations according to their morphology. We have established that the mean ages and metallicities of different types of dEs are different.
This result mostly represents the central part of the galaxy, as we used a central fixed aperture to extract the one dimensional spectra of the galaxies, in order to optimize the SNR for our Lick index analysis. We expect that having a wider aperture effectively minimizes the influence of central nucleus. In a worst-case scenario, for those dEs that have a relatively low surface brightness, i.e., a rather faint stellar envelope compared to the nucleus, it is not unquestionable whether our extracted spectra do really represent the galaxies as a whole, or the nuclei only. Interestingly, though, we found that most of the faint nucleated dEs have a fairly old stellar population, and that typically, the nuclei tend to be younger than their host galaxies (Paudel & Lisker, 2009). This appears consistent with the studies of Chilingarian (2009) for Virgo dEs and Koleva et al. (2009) for Fornax cluster dEs: both concluded that the central part of the galaxies are relatively younger and more metal-rich than the outer part. In that respect, we can argue that our conclusions are not biased by having a strong effect of the central nucleus in the spectral extraction process. If anything, our result of old galaxy ages at fainter magnitudes could only become somewhat more pronounced by removing the nucleus contribution.
It was known before that the different dE subclasses, in particular those with and without discs, exhibit differences in their colours, magnitude, and the local environment in which they reside (Lisker et al., 2007). The dE(di)s were found to have, on average, slightly bluer colours than the dE(N)s, and Lisker et al. interpreted this colour difference with either older age or higher metallicity of the dE(N)s. By combining our sample with that of M08, and therefore reaching statistically significant subsample sizes, we see that the colour offset is mainly an effect of age rather than metallicity. However, it is not straightforward to tell which governing factor is most responsible for this apparent correlation of galaxy substructure and stellar population characteristics. As noted above, we find correlations of age with both magnitude and local density, and we know that the dE(di)s are relatively bright and typically located in less dense cluster regions than the dE(N)s; the combination thus shows that no significant difference between the stellar population of dE(di)s and dE(N)s can be claimed. This is interesting, since Lisker et al. (2008) pointed out that the fairly wide (estimated) distribution of intrinsic axial ratios of the dE(N)s would be consistent with assuming that the dE(di)s – most of which are nucleated – are simply the flat tail of this distribution. The location in regions of comparatively lower density could then be interpreted such that discs in dwarfs can only survive for a reasonably long time if the amount of dynamical heating due to tidal forces is low (also see Mastropietro et al., 2005), and therefore, dEs with discs are preferentially found outside of the cluster center. Moreover, L06 noted that there could still be a significant fraction of objects that have discs, but that were simply not found by their analysis of SDSS images, due to low SNR or the lack of disc features like spiral arms or bars. We see in our data that a handful of dE(N)s are as young and metal rich as the dE(di)s, and interestingly, they also lie in a low density region. So maybe, just as a possibility, these could be those dE(N)s that actually host discs, but were not identified as such — which would then also explain the bimodality when compared to the fainter ones.
Furthermore, an apparent inconsistency is observed in the relation between age and luminosity: previous studies provided evidence for a continuously later formation epoch and/or a longer duration of star formation when going from the massive ellipticals to the dwarfs (see, e.g., Gavazzi et al., 2002; Boselli et al., 2005; Lisker & Han, 2008), which apparently is at variance with our findings. On the other hand, this trend is unlikely to continue to even fainter magnitudes, since most of the Local Group dwarf spheroidal (dSph) galaxies are know to be dominated by old populations (e.g. Grebel, 1999). It seems that, the fainter dEs are significantly older than the brighter ones, no matter at which density they are located. To statistically confirm this result, we divide the total sample in two groups: those being fainter and brighter than the mean magnitude Mr = 17.22 mag. We obtain a mean age of 3.9 Gyr and 7.4 Gyr for the brighter and fainter group, respectively, which is very similar to the mean ages of the discy and nucleated subsamples (3.0 and 7.5 Gyr). Furthermore, the K-S test supports our finding that a dichotomy in the distribution of ages can be seen not only with respect to different morphology but also different luminosity, as we get a K-S test probability of 0.01 for the null hypothesis that the age distributions of the fainter and brighter group are not different.
The ages of 10 Gyr and above indeed appear more comparable to the Local Group dSphs. In that sense, we find a discontinuity in the trend of stellar population characteristics with luminosity, and we can speculate that the fainter dEs might be a different species than the brighter ones or simply were not able to sustain star formation for as long a period as the more luminous and presumably more massive dEs.
In comparison to previous stellar population studies of dEs in different clusters, unlike Chilingarian et al. (2008) who found a correlation of [/Fe] with the projected distance in the Abell496 cluster – although only in the very central part – and the study of Smith et al. (2009) for Coma, we do not find any correlation between -element abundance ratio with environmental density. This could also be due to differences between the clusters, in the sense that Coma is a more virialized cluster of higher richness class than Virgo. Nevertheless, our range of age and metallicity roughly agrees with their ranges. Another study by Geha et al. (2003), focusing on the stellar populations of rotating and non-rotating Virgo dEs, resulted in no difference between them. On the other hand, a recent, more extensive study by Toloba et al. (2009) finds that rotating Virgo dEs are typically located further from the cluster center and have younger stellar population ages. We have only six dEs in common with these studies (counting only those for which tabulated values were published). Three of them (VCC 0308, VCC 0856 & VCC 1947) have disc substructure and are rotating, while for three (VCC 1254, VCC 1261 & VCC 1308) no disc features were identified and they are non-rotating according to Geha et al.. Note, though, that VCC 1261 is clearly rotating from the analysis of dE globular clusters of Beasley et al. (2009). Chilingarian (2009) shows that this galaxy contains a rotating kinematically decoupled core, indicating the difficulties in drawing robust conclusions on the global rotation of a dE from the inner stellar kinematics. We also find that the overall stellar populations are quite mixed within these six galaxies, as has already been noted by van Zee et al. (2004) in their study of (non-)rotating dEs.
There have been numerous discussions on the origin of the passive dwarf galaxies. The key issue is whether cluster dwarfs are primordial, having formed from the highest density peaks in the proto-cluster (Tully et al., 2002) and avoiding subsequent merging, or originating from transformation of late-type disc galaxies through the interaction with the cluster environment (e.g. Boselli & Gavazzi, 2006). However, to explain the formation of dEs, using such single scenarios may be too simplistic, and it is likely that both scenarios operate at some level. Furthermore, the question is how to find unique features for such a process that dominates in a given mass regime, a given environment, and for a given morphological subclass of dwarfs.
Our results promote the idea of different scenarios for different morphology and/or different luminosity of dEs, although the physical mechanisms responsible for the quenching of the star formation activity in the galaxies are not easy to understand from the stellar population properties. The observed systematic difference in age & metallicity between different types of dEs support the finding of L07. The typical age range of the brighter dEs of less than 5 Gyr indicates that the star formation activity ceased at z 0.5. The younger age, higher metallicity and consistency with solar element abundance would suggest that a discy dE can indeed form through the structural transformation of a late-type spiral into a spheroidal system, triggered by the popular scenario of strong tidal interactions with massive cluster galaxies. A stellar disc component (which has rather high metallicity) may survive and form a bar and spiral features that can be retained for some time depending on the tidal heating of the galaxy (Mastropietro et al. 2005; also see Lisker & Fuchs 2009 ). This “galaxy harassment” process could thus produce disc-shaped dEs.
On the other hand, the fainter dE(N)s, with their older ages, might be a different class of objects with a different formation scenario. The poorer metal content supports the idea that they might be primordial objects, as suggested by Rakos & Schombert (2004); they might have either suffered early infall into the cluster potential, or formed together with cluster itself. The generally low surface brightness of dEs suggests that whichever mechanism is responsible for the halting the star formation activity, it must have been rather efficient. The common idea is that internal feedback might be responsible for their cessation of star formation activity at such early epochs. We can speculate that the slightly higher mean [/Fe] as compared to the dE(di)s could indicate a more efficient star formation activity than their discy counterparts before the quenching. High-effiency star formation has also been suggested as an explanation for the comparatively high metallicity of the old populations of Local group dSph as compared to dIrr populations of the same age, i.e., as an explanation for the offset along the metallicityluminosity relation (Grebel et al., 2003). However, further dynamical studies of these fainter galaxies are needed to prove whether the removal of gas by internal feedback processes is efficient or not, since it has been pointed out that it is difficult to really eject the gas from a dwarf galaxy by supernovae explosions unless the dwarfs have masses less than 107 solar masses (Mac Low & Ferrara, 1999).
Acknowledgments
We thank the referee Igor Chilingarian for providing the useful comments and suggestions that helped improving the manuscript. We are indebted to C. Conselice and the MAGPOP ITP collaboration for providing the spectra of the M08 sample. S.P. would like to thank Anna Pasquali & Alexander Hansson for their helpful advice during the data reduction and analysis. T.L. and E.K.G. would also like to thank Bruno Binggeli for valuable input to the observing proposal. T.L. and K.G. are grateful to Emanuela Pompei for excellent support during the observations, and to the Swiss National Science Foundation for financial support under grant 200020-113697. We are grateful to N. Cardiel for providing his program Indexf and supporting us with its application. S.P. and T.L. are supported within the framework of the Excellence Initiative by the German Research Foundation (DFG) through the Heidelberg Graduate School of Fundamental Physics (grant number GSC 129/1). S.P. acknowledges the support of the International Max Planck Research School (IMPRS) for Astronomy and Cosmic Physics at the University of Heidelberg. This work has made use of the NASA Astrophysics Data System and the NASA/IPAC Extragalactic Data base (NED) which is operated by the Jet Propulsion Laboratory, California Institute of Technology, under contract with the National Aeronautics and Space Administration.
References
- Appenzeller et al. (1998) Appenzeller I., Fricke K., Fürtig W., Gässler W., Häfner R., Harke R., Hess H.-J., Hummel W., 1998, The Messenger, 94, 1
- Babul & Rees (1992) Babul A., Rees M. J., 1992, MNRAS, 255, 346
- Barazza et al. (2002) Barazza F. D., Binggeli B., Jerjen H., 2002, A&A, 391, 823
- Beasley et al. (2009) Beasley M. A., Cenarro A. J., Strader J., Brodie J. P., 2009, AJ, 137, 5146
- Bertelli et al. (1994) Bertelli G., Bressan A., Chiosi C., Fagotto F., Nasi E., 1994, A&AS, 106, 275
- Binggeli & Cameron (1993) Binggeli B., Cameron L. M., 1993, A&AS, 98, 297
- Binggeli et al. (1985) Binggeli B., Sandage A., Tammann G. A., 1985, AJ, 90, 1681
- Binggeli et al. (1987) Binggeli B., Tammann G. A., Sandage A., 1987, AJ, 94, 251
- Boselli et al. (2005) Boselli A., Cortese L., Deharveng J. M., Gavazzi G., Yi K. S., Gil de Paz A., Seibert M., Boissier S., Donas J., Lee Y.-W., Madore B. F., Martin D. C., Rich R. M., Sohn Y.-J., 2005, ApJ, 629, L29
- Boselli & Gavazzi (2006) Boselli A., Gavazzi G., 2006, PASP, 118, 517
- Bressan et al. (1996) Bressan A., Chiosi C., Tantalo R., 1996, A&A, 311, 425
- Bruzual & Charlot (2003) Bruzual G., Charlot S., 2003, MNRAS, 344, 1000
- Burstein et al. (1984) Burstein D., Faber S. M., Gaskell C. M., Krumm N., 1984, ApJ, 287, 586
- Buzzoni (1995) Buzzoni A., 1995, ApJS, 98, 69
- Caldwell (2006) Caldwell N., 2006, ApJ, 651, 822
- Caldwell et al. (2003) Caldwell N., Rose J. A., Concannon K. D., 2003, AJ, 125, 2891
- Cardiel et al. (1998) Cardiel N., Gorgas J., Cenarro J., Gonzalez J. J., 1998, A&AS, 127, 597
- Cardiel et al. (2003) Cardiel N., Gorgas J., Sánchez-Blázquez P., Cenarro A. J., Pedraz S., Bruzual G., Klement J., 2003, A&A, 409, 511
- Chilingarian (2009) Chilingarian I. V., 2009, MNRAS, 394, 1229
- Chilingarian et al. (2008) Chilingarian I. V., Cayatte V., Durret F., Adami C., Balkowski C., Chemin L., Laganá T. F., Prugniel P., 2008, A&A, 486, 85
- Conselice et al. (2001) Conselice C. J., Gallagher III J. S., Wyse R. F. G., 2001, ApJ, 559, 791
- Côté et al. (2006) Côté, P., Piatek, S., Ferrarese, L., et al. 2006, ApJS, 165, 57
- Davies et al. (1988) Davies J. I., Phillipps S., Cawson M. G. M., Disney M. J., Kibblewhite E. J., 1988, MNRAS, 232, 239
- De Rijcke et al. (2003) De Rijcke S., Dejonghe H., Zeilinger W. W., Hau G. K. T., 2003, A&A, 400, 119
- Dressler (1980) Dressler A., 1980, ApJ, 236, 351
- Faber & Lin (1983) Faber S. M., Lin D. N. C., 1983, ApJ, 266, L17
- Ferguson & Binggeli (1994) Ferguson H. C., Binggeli B., 1994, A&AR, 6, 67
- Ferguson & Sandage (1989) Ferguson H. C., Sandage A., 1989, ApJ, 346, L53
- Gavazzi et al. (2002) Gavazzi G., Bonfanti C., Sanvito G., Boselli A., Scodeggio M., 2002, ApJ, 576, 135
- Geha et al. (2003) Geha M., Guhathakurta P., van der Marel R. P., 2003, AJ, 126, 1794
- Girardi et al. (2000) Girardi L., Bressan A., Bertelli G., Chiosi C., 2000, A&AS, 141, 371
- Gorgas et al. (1997) Gorgas J., Pedraz S., Guzman R., Cardiel N., Gonzalez J. J., 1997, ApJ, 481, L19
- Grant et al. (2005) Grant, N. I., Kuipers, J. A., & Phillipps, S. 2005, MNRAS, 363, 1019
- Grebel (1999) Grebel E. K., 1999, in Whitelock P., Cannon R., eds, The Stellar Content of Local Group Galaxies Vol. 192 of IAU Symposium, Evolutionary Histories of Dwarf Galaxies in the Local Group. pp 17
- Grebel & Gallagher (2004) Grebel E. K., Gallagher III J. S., 2004, ApJ, 610, L89
- Grebel et al. (2003) Grebel E. K., Gallagher III J. S., Harbeck D., 2003, AJ, 125, 1926
- Gunn & Gott (1972) Gunn J. E., Gott J. R. I., 1972, ApJ, 176, 1
- Jerjen & Binggeli (2005) Jerjen H., Binggeli B., eds. 2005, Near-field cosmology with dwarf elliptical galaxies
- Jerjen et al. (2000) Jerjen H., Kalnajs A., Binggeli B., 2000, A&A, 358, 845
- Jones (1997) Jones L. A., 1997, PhD thesis, Univ. North Carolina, Chapel Hill.
- Koleva et al. (2009) Koleva M., De Rijcke S., Prugniel P., Zeilinger W. W., Michielsen D., 2009, ArXiv e-prints
- Korn et al. (2005) Korn A. J., Maraston C., Thomas D., 2005, A&A, 438, 685
- Kuntschner (2000) Kuntschner H., 2000, MNRAS, 315, 184
- Kuntschner et al. (2001) Kuntschner H., Lucey J. R., Smith R. J., Hudson M. J., Davies R. L., 2001, MNRAS, 323, 615
- Lisker & Fuchs (2009) Lisker, T. & Fuchs, B. 2009, A&A, 501, 429
- Lisker et al. (2006b) Lisker T., Glatt K., Westera P., Grebel E. K., 2006b, AJ, 132, 2432
- Lisker et al. (2006a) Lisker T., Grebel E. K., Binggeli B., 2006a, AJ, 132, 497
- Lisker et al. (2008) Lisker T., Grebel E. K., Binggeli B., 2008, AJ, 135, 380
- Lisker et al. (2007) Lisker T., Grebel E. K., Binggeli B., Glatt K., 2007, ApJ, 660, 1186
- Lisker & Han (2008) Lisker T., Han Z., 2008, ApJ, 680, 1042
- Mac Low & Ferrara (1999) Mac Low M.-M., Ferrara A., 1999, ApJ, 513, 142
- Maraston (1998) Maraston C., 1998, MNRAS, 300, 872
- Maraston et al. (2003) Maraston C., Greggio L., Renzini A., Ortolani S., Saglia R. P., Puzia T. H., Kissler-Patig M., 2003, A&A, 400, 823
- Mastropietro et al. (2005) Mastropietro C., Moore B., Mayer L., Debattista V. P., Piffaretti R., Stadel J., 2005, MNRAS, 364, 607
- Mateo (1998) Mateo M. L., 1998, ARA&A, 36, 435
- Mei et al. (2007) Mei S., Blakeslee J. P., Côté P., Tonry J. L., West M. J., Ferrarese L., Jordán A., Peng E. W., Anthony A., Merritt D., 2007, ApJ, 655, 144
- Michielsen et al. (2008) Michielsen D., Boselli A., Conselice C. J., Toloba E., Whiley I. M., Aragón-Salamanca A., Balcells M., Cardiel N., Cenarro A. J., Gorgas J., Peletier R. F., Vazdekis A., 2008, MNRAS, 385, 1374
- Moore et al. (1996) Moore B., Katz N., Lake G., Dressler A., Oemler A., 1996, Nature, 379, 613
- Murakami & Babul (1999) Murakami I., Babul A., 1999, MNRAS, 309, 161
- Norris et al. (2006) Norris M. A., Sharples R. M., Kuntschner H., 2006, MNRAS, 367, 815
- Paudel & Lisker (2009) Paudel S., Lisker T., 2009, AN, 330, 969
- Poggianti et al. (2001) Poggianti B. M., Bridges T. J., Mobasher B., Carter D., Doi M., Iye M., Kashikawa N., Komiyama Y., Okamura S., Sekiguchi M., Shimasaku K., Yagi M., Yasuda N., 2001, ApJ, 562, 689
- Proctor et al. (2004) Proctor R. N., Forbes D. A., Beasley M. A., 2004, MNRAS, 355, 1327
- Rakos & Schombert (2004) Rakos K., Schombert J., 2004, AJ, 127, 1502
- Rakos et al. (2001) Rakos K., Schombert J., Maitzen H. M., Prugovecki S., Odell A., 2001, AJ, 121, 1974
- Salpeter (1955) Salpeter E. E., 1955, ApJ, 121, 161
- Sanchez-Blazquez et al. (2009) Sanchez-Blazquez P., Jablonka P., Noll S., Poggianti B. M., Moustakas J., Milvang-Jensen B., Halliday C., Aragon-Salamanca A., Saglia R. P., Desai V., De Lucia G., Clowe D. I., Pello R., 2009, ArXiv e-prints
- Sánchez-Blázquez et al. (2006) Sánchez-Blázquez P., Peletier R. F., Jiménez-Vicente J., Cardiel N., Cenarro A. J., Falcón-Barroso J., Gorgas J., Selam S., Vazdekis A., 2006, MNRAS, 371, 703
- Sandage et al. (1985) Sandage A., Binggeli B., Tammann G. A., 1985, AJ, 90, 1759
- Schiavon (2007) Schiavon R. P., 2007, ApJS, 171, 146
- Serra & Trager (2007) Serra P., Trager S. C., 2007, MNRAS, 374, 769
- Silk et al. (1987) Silk J., Wyse R. F. G., Shields G. A., 1987, ApJ, 322, L59
- Smith et al. (2009) Smith R. J., Lucey J. R., Hudson M. J., Allanson S. P., Bridges T. J., Hornschemeier A. E., Marzke R. O., Miller N. A., 2009, MNRAS, 392, 1265
- Tantalo et al. (1998) Tantalo R., Chiosi C., Bressan A., 1998, A&A, 333, 419
- Thomas et al. (2003) Thomas D., Maraston C., Bender R., 2003, MNRAS, 339, 897
- Toloba et al. (2009) Toloba, E., Boselli, A., Gorgas, J., Peletier, R. F., Cenarro, A. J., Gadotti, D. A., Gil de Paz, A., Pedraz, S., Yildiz, U., 2009, ApJ, in press (arXiv:0910.4968)
- Trager et al. (2000) Trager S. C., Faber S. M., Worthey G., González J. J., 2000, AJ, 119, 1645
- Trager & Somerville (2009) Trager S. C., Somerville R. S., 2009, MNRAS, pp 401
- Trager et al. (1998) Trager S. C., Worthey G., Faber S. M., Burstein D., Gonzalez J. J., 1998, ApJS, 116, 1
- Trager et al. (2005) Trager S. C., Worthey G., Faber S. M., Dressler A., 2005, MNRAS, 362, 2
- Tully et al. (2002) Tully R. B., Somerville R. S., Trentham N., Verheijen M. A. W., 2002, ApJ, 569, 573
- van Zee et al. (2004) van Zee L., Skillman E. D., Haynes M. P., 2004, AJ, 128, 121
- Vazdekis & Arimoto (1999) Vazdekis A., Arimoto N., 1999, ApJ, 525, 144
- Vazdekis et al. (1996) Vazdekis A., Casuso E., Peletier R. F., Beckman J. E., 1996, ApJS, 106, 307
- Vazdekis et al. (2003) Vazdekis A., Cenarro A. J., Gorgas J., Cardiel N., Peletier R. F., 2003, MNRAS, 340, 1317
- Weiss et al. (1995) Weiss A., Peletier R. F., Matteucci F., 1995, A&A, 296, 73
- Worthey (1994) Worthey G., 1994, ApJS, 95, 107
- Worthey et al. (1994a) Worthey G., Faber S. M., Gonzalez J. J., Burstein D., 1994a, ApJS, 94, 687
- Worthey et al. (1994b) Worthey G., Faber S. M., Gonzalez J. J., Burstein D., 1994b, ApJS, 94, 687
- Worthey & Ottaviani (1997) Worthey G., Ottaviani D. L., 1997, ApJS, 111, 377
Appendix A Lick offsets
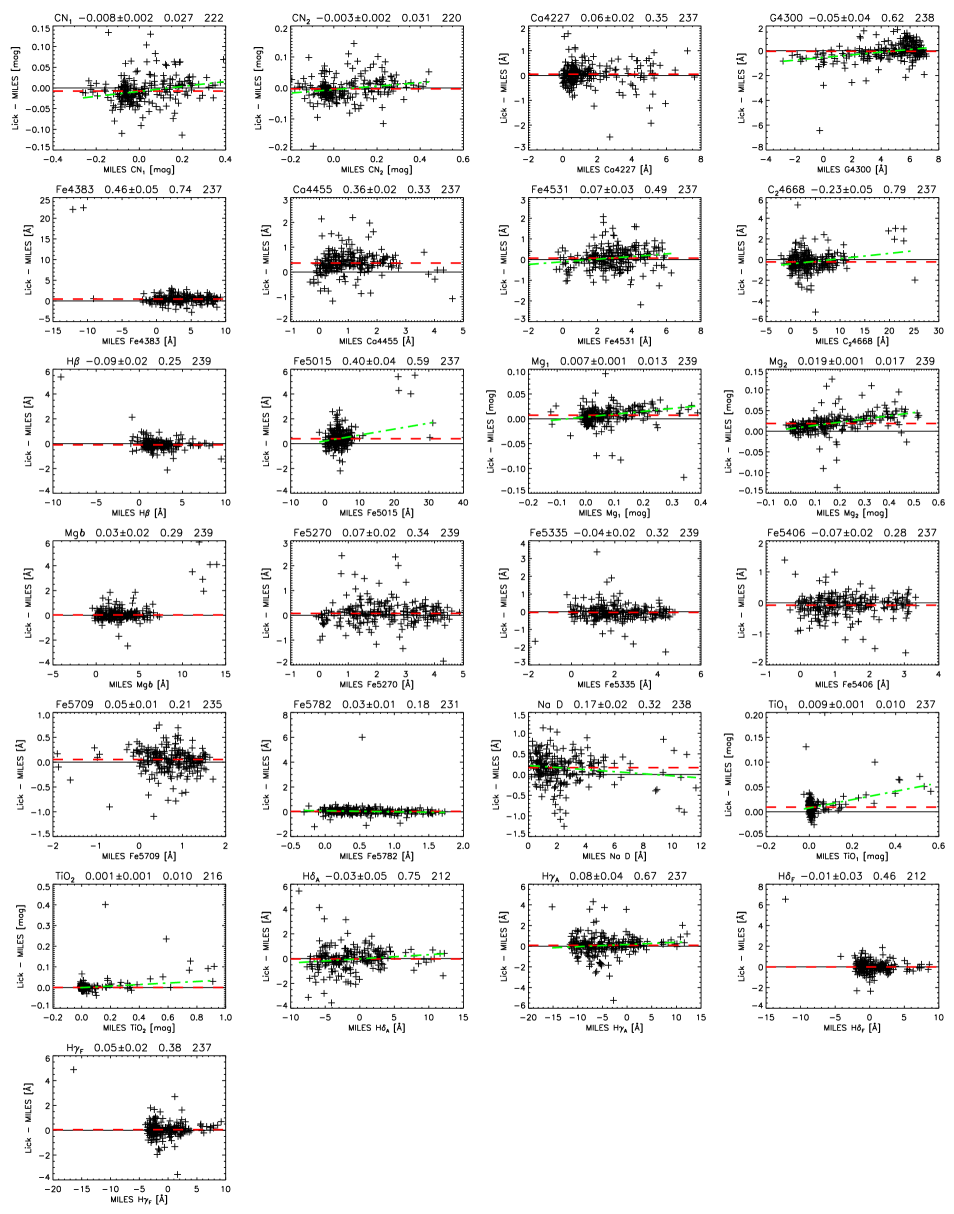
For this project and instrument configuration there were no stars observed in common with the original Lick/IDS stellar library (Worthey et al., 1994b) which is the standard way to calibrate the index measurements to the Lick system by deriving small offsets (Worthey & Ottaviani, 1997). However, in this paper we made use of the MILES stellar library (Sánchez-Blázquez et al., 2006) to determine the offsets for indices measured on flux calibrated spectra to the original Lick/IDS system assuming that the MILES library and our data are well flux-calibrated.
The spectra were first broadened to the Lick/IDS resolution with a wavelength-dependent Gaussian assuming a spectral resolution of the MILES library of 2.3 Å (FWHM). Then, we compared the index measurements in common with the Lick stellar library for up to 239 stars depending on the availability of the measurements. The offsets and associated errors (see Figure 16 and Table 4) were derived with an outlier resistent biweight estimator (IDL Astronomy library biweight_mean.pro). The offsets are generally small (0.2 Å) but individual indices show larger offsets (e.g., Fe4383, Fe5015). Additionally, several indices show evidence for line-strength dependent offsets (e.g., CN2, G4300, Mg2; see also Vazdekis 1999). We used an outlier-resistant two-variable linear regression method (IDL Astronomy library robust_linefit.pro) to investigate the significance of such trends. For indices where we find a slope different from zero with more than 2 significance we show the fit in Figure 16 with a green dash-dotted line and give the fit parameters in Table 4.
We note that previous attempts to establish Lick offsets with the Jones 1997 stellar library (Norris et al. 2006;Worthey & Ottaviani 1997) have resulted in significantly different offsets for some indices, perhaps most notably the higher order Balmer lines. We ascribe the differences in offsets to an imperfect flux calibration of the Jones library. Recently, Sanchez-Blazquez et al. 2009 also used the MILES library to derive Lick offsets and find similar results. However, significant differences remain for individual indices (e.g., Mg ) where we favour our outlier robust analysis.
For the present study, we apply the offsets listed in Table 4 (column 2). Only one of the indices (Fe5015), used in this study to derive the stellar population parameter estimates, shows evidence for a line-strength dependent offset. Since the trend is very weak in the range of observed line-strength for this index we apply only a normal offset.
| Index | Offset | rms | Number of stars | ||
| (1) | (2) | (3) | (4) | (5) | (6) |
| CN1 | 0.027 | 222 | |||
| CN2 | 0.031 | 220 | |||
| Ca4227 | 0.35 | 237 | - | ||
| G4300 | 0.62 | 238 | |||
| Fe4383 | 0.74 | 237 | - | ||
| Ca4455 | 0.33 | 237 | - | ||
| Fe4531 | 0.49 | 237 | |||
| C24668 | 0.79 | 237 | |||
| H | 0.25 | 239 | - | ||
| Fe5015 | 0.59 | 237 | |||
| Mg1 | 0.013 | 239 | |||
| Mg2 | 0.017 | 239 | |||
| Mg | 0.29 | 239 | - | ||
| Fe5270 | 0.34 | 239 | - | ||
| Fe5335 | 0.32 | 239 | - | ||
| Fe5406 | 0.28 | 237 | - | ||
| Fe5709 | 0.21 | 235 | - | ||
| Fe5782 | 0.18 | 231 | |||
| Na D | 0.32 | 238 | |||
| TiO1 | 0.010 | 237 | |||
| TiO2 | 0.010 | 216 | |||
| H | 0.75 | 212 | |||
| H | 0.67 | 237 | |||
| H | 0.46 | 212 | - | ||
| H | 0.38 | 237 | - | ||
Note. Column (1) gives the index name, while column (2) gives the mean offset (Lick - MILES) to the Lick/IDS system. Column (3) gives a robust estimate of the 1 scatter and column (4) shows th number of stars used in the comparison for each index. Columns (5) and (6) give the coefficents of a linear fit to (Lick - MILES) = Lick where a significant slope was found.
Appendix B Lick/IDS INDICES
In Table 5 we list the measured indices and their errors, which we used for the SSP parameter estimation of the galaxies of our sample. The indices are transformed to the Lick/IDS system using the offsets described in Appendix A.
| Galaxy | H | H | Fe4383 | H | Fe5015 | Mgb | Fe5270 | Fe5335 | Fe5406 |
|---|---|---|---|---|---|---|---|---|---|
| b0308 | 2.29 0.28 | 1.66 0.24 | 3.46 0.56 | 2.82 0.26 | 4.78 0.57 | 2.29 0.28 | 2.20 0.31 | 1.93 0.35 | 1.07 0.27 |
| d0216 | 3.73 0.26 | 2.75 0.23 | 1.07 0.61 | 2.70 0.27 | 3.19 0.60 | 1.65 0.30 | 1.81 0.33 | 1.14 0.38 | 1.12 0.27 |
| d0389 | 1.57 0.30 | 0.09 0.27 | 4.38 0.56 | 2.52 0.25 | 4.61 0.57 | 2.32 0.27 | 2.53 0.30 | 2.03 0.34 | 0.99 0.26 |
| d0490 | 1.72 0.39 | 0.56 0.34 | 4.07 0.78 | 2.54 0.35 | 4.30 0.77 | 2.26 0.38 | 2.62 0.42 | 1.98 0.47 | 1.38 0.35 |
| d0856 | 1.39 0.25 | 0.57 0.21 | 4.26 0.47 | 2.28 0.22 | 4.36 0.48 | 2.35 0.23 | 2.42 0.26 | 1.90 0.29 | 1.27 0.23 |
| d0990 | 1.13 0.25 | 0.40 0.21 | 4.26 0.47 | 2.47 0.21 | 4.73 0.46 | 2.44 0.22 | 2.38 0.25 | 2.09 0.28 | 1.29 0.21 |
| d1304 | 2.66 0.31 | 1.60 0.27 | 2.68 0.64 | 2.56 0.28 | 3.66 0.65 | 1.68 0.31 | 1.89 0.35 | 1.64 0.39 | 1.02 0.31 |
| d2019 | 1.24 0.35 | 0.63 0.29 | 3.98 0.64 | 2.48 0.30 | 4.70 0.68 | 2.16 0.33 | 2.70 0.37 | 1.98 0.42 | 1.45 0.31 |
| n0545 | 1.14 0.33 | 0.61 0.29 | 2.44 0.65 | 1.87 0.30 | 3.74 0.66 | 1.43 0.32 | 1.48 0.36 | 1.03 0.40 | 0.83 0.31 |
| n0725 | 2.51 0.39 | 1.27 0.36 | 1.55 0.85 | 2.01 0.40 | 3.46 0.88 | 0.19 0.45 | 1.74 0.48 | 1.37 0.55 | 0.75 0.40 |
| n0929 | 0.80 0.24 | -0.59 0.21 | 5.38 0.43 | 2.06 0.20 | 5.44 0.43 | 3.08 0.21 | 2.74 0.23 | 2.42 0.26 | 1.29 0.20 |
| n1167 | 1.86 0.31 | 0.71 0.27 | 2.68 0.63 | 2.13 0.29 | 3.11 0.63 | 1.63 0.30 | 1.84 0.34 | 0.96 0.39 | 0.67 0.29 |
| n1185 | 1.16 0.32 | 0.27 0.29 | 3.29 0.62 | 2.00 0.29 | 4.33 0.67 | 1.63 0.32 | 1.80 0.36 | 1.96 0.40 | 0.89 0.30 |
| n1254 | 1.36 0.26 | 0.28 0.22 | 3.62 0.50 | 1.94 0.23 | 4.24 0.49 | 2.38 0.24 | 2.03 0.27 | 1.92 0.30 | 1.24 0.22 |
| n1261 | 1.50 0.21 | 0.66 0.18 | 3.99 0.38 | 2.45 0.18 | 4.48 0.39 | 2.61 0.19 | 2.63 0.21 | 2.15 0.24 | 1.37 0.18 |
| n1308 | 1.22 0.34 | 0.46 0.30 | 3.48 0.68 | 2.33 0.31 | 4.85 0.68 | 2.49 0.33 | 2.14 0.38 | 2.06 0.42 | 1.20 0.31 |
| n1333 | 2.58 0.34 | 1.33 0.30 | 2.51 0.73 | 2.24 0.33 | 3.14 0.74 | 1.48 0.36 | 1.23 0.41 | 0.85 0.46 | 0.69 0.34 |
| n1348 | 1.83 0.32 | -0.08 0.29 | 3.70 0.65 | 1.58 0.30 | 3.31 0.67 | 2.98 0.31 | 1.98 0.35 | 1.58 0.40 | 0.98 0.30 |
| n1353 | 3.34 0.31 | 2.69 0.27 | 0.89 0.72 | 3.06 0.30 | 3.12 0.71 | 1.76 0.34 | 1.68 0.38 | 1.38 0.43 | 1.03 0.32 |
| n1355 | 1.98 0.39 | 0.97 0.34 | 3.50 0.80 | 2.28 0.36 | 4.41 0.82 | 1.69 0.40 | 2.44 0.45 | 1.46 0.51 | 1.34 0.37 |
| n1389 | 1.92 0.33 | 0.79 0.29 | 2.91 0.68 | 2.09 0.31 | 2.71 0.71 | 1.67 0.33 | 1.50 0.38 | 1.30 0.43 | 0.50 0.33 |
| n1407 | 1.46 0.30 | 0.31 0.27 | 3.27 0.59 | 1.88 0.27 | 3.90 0.60 | 2.36 0.29 | 1.64 0.33 | 1.55 0.37 | 1.10 0.28 |
| n1661 | 1.39 0.36 | 0.44 0.33 | 4.29 0.72 | 2.08 0.34 | 4.12 0.77 | 1.65 0.37 | 1.75 0.42 | 1.46 0.47 | 1.11 0.35 |
| n1826 | 1.12 0.31 | 0.26 0.26 | 3.25 0.59 | 2.01 0.27 | 4.40 0.59 | 1.93 0.29 | 2.31 0.32 | 2.00 0.36 | 1.26 0.27 |
| n1861 | 1.34 0.31 | 0.23 0.27 | 4.35 0.59 | 1.94 0.27 | 4.78 0.58 | 2.62 0.28 | 2.74 0.32 | 2.18 0.36 | 1.58 0.28 |
| n1945 | 2.13 0.31 | 1.17 0.28 | 4.12 0.62 | 2.59 0.29 | 3.20 0.67 | 2.23 0.31 | 1.92 0.36 | 1.37 0.40 | 1.20 0.30 |
Appendix C Comparison of the estimated SSP parameters
In this section we present several comparisons of the SSP parameters derived from different SSP models, using different methods and also different data sets. We also provide the derived age and metallicity from the AV/MILES model for our data set in Table 6.
| Galaxy | Age, Gyr | [Z/H], dex |
| VCC 0308 | 1.8 | |
| VCC 0216 | 2.2 | |
| VCC 0389 | 3 | |
| VCC 0490 | 2.5 | |
| VCC 0856 | 2.8 | |
| VCC 0990 | 3 | |
| VCC 1304 | 2.7 | |
| VCC 2019 | 2.7 | |
| VCC 0545 | 15.6 | |
| VCC 0725 | 7.1 | |
| VCC 0929 | 3.7 | |
| VCC 1167 | 7.6 | |
| VCC 1185 | 7.1 | |
| VCC 1254 | 5.1 | |
| VCC 1261 | 2.7 | |
| VCC 1308 | 3.2 | |
| VCC 1333 | 6.2 | |
| VCC 1348 | 17.8 | |
| VCC 1353 | 2 | |
| VCC 1355 | 2.5 | |
| VCC 1389 | 16.7 | |
| VCC 1407 | 7.6 | |
| VCC 1661 | 6.6 | |
| VCC 1826 | 4.8 | |
| VCC 1861 | 3 | |
| VCC 1945 | 3 |