Statistical and geometrical properties of thermal plumes in turbulent Rayleigh-Bénard convection
Abstract
We present a systematic experimental study of geometric and statistical properties of thermal plumes in turbulent Rayleigh-Bénard convection using the thermochromic-liquid-crystal (TLC) technique. The experiments were performed in three water-filled cylindrical convection cells with aspect ratios 2, 1, and 0.5 and over the Rayleigh-number range . TLC thermal images of horizontal plane cuts at various depths below the top plate were acquired. Three-dimensional images of thermal plumes were then reconstructed from the two-dimensional slices of the temperature field. The results show that the often-called sheetlike plumes are really one-dimensional structures and may be called rodlike plumes. We find that the number densities for both sheetlike/rodlike and mushroomlike plumes have power-law dependence on with scaling exponents of , which is close to that between the Nusselt number and . This result suggests that it is the plume number that primarily determines the scaling exponent of the - scaling relation. The evolution of the aspect ratio of sheetlike/rodlike plumes reveals that as increases the plume geometry changes from more-elongated to less-elongated. Our study of the plume area fraction (fraction of coverage over the surface of the plate) further reveals that the increased plume numbers with mainly comes from increased plume emission, rather than fragmentation of plumes. In addition, the area, perimeter, and the shape complexity of the two-dimensional horizontal cuts of sheetlike/rodlike plumes were studied and all are found to obey log-normal distributions.
1 Introduction
As an important class of turbulent flows, turbulent thermal convection is ubiquitous in nature, ranging from those in the planets and stars, in the Earth’s mantle and its outer core, and in the atmosphere and oceans to the convection in heat transport and mixing in engineering applications. Turbulent Rayleigh-Bénard (RB) convection, a fluid layer sandwiched between two parallel plates and heated from below, has long been used as a model system to study natural convections [1, 2, 3]. Two of the important issues in the study of turbulent RB convection are heat transport and coherent structures such as thermal plumes. In the first one, one tries to understand how heat transported upwards across the fluid layer, which is characterized by the Nusselt number , depends on the turbulent intensity, which is characterized by the Rayleigh number . Here, is the applied temperature difference across the fluid layer, is the gravitational acceleration, and , , and are, respectively, the volume expansion coefficient, kinematic viscosity, thermal conductivity, and thermal diffusivity of the convecting fluid. In many theories and experiments, it is often assumed that there is a simple power law relation between and , i.e. . In the second issue one wants to understand the statistical and geometrical properties of thermal plumes, which is a localized thermal structure and has been shown to play a key role in many natural phenomena and engineering applications, such as in mantle convection where mantle plumes just below Earth’s crust are responsible for the formation of volcanoes (see, for example, Ref. [4, 5]), in nuclear explosions and stellar convection where plumes dominate both the dynamics and the energy transport (see, for example, Ref. [6]). The two issues are not independent of each other. It has been shown recently that for turbulent RB system most heat is carried and transported by thermal plumes [7, 8, 9]. Accordingly, it remains a challenge to establish a quantitative relationship between thermal plumes and heat transport. Although a theoretical effort [10] has recently focused on this connection, few such experimental studies have been made.
Thermal plumes generated by a localized hot/cold spot have a well organized structure, which consists of a mushroom cap with sharp temperature gradient and a stem that is relatively diffusive [11, 12]. Plumes with such a structure are often referred to as mushroomlike plumes, which are also observed in turbulent RBC when viewed from the side [13, 14, 15, 11, 16, 17, 18, 19, 7, 20]. By extracting plumes from temperature time series measured locally near the cell sidewall, Zhou and Xia [21, 22] showed that the size of mushroomlike plumes obey log-normal statistics. However, the morphology of the plumes is totally different when one observes from above (or below): thermal plume is extended in one horizontal direction but concentrated in the orthogonal horizontal direction [23, 13, 15, 24, 25, 26, 27, 28, 29, 30, 31]. Plumes with such a structure are often assumed to have significant vertical extent and thus are called sheetlike plumes. Puthenveettil and Arakeri [27] studied near-wall structures in turbulent natural convection driven by concentration differences across a membrane and found that the plume spacings show a common log-normal probability density function (PDF). Zhou et al. [29] further revealed that both the area and the heat content of sheetlike plumes are log-normal distributed. Shishkina and Wagner [32] investigated quantitatively geometric properties of sheetlike plumes using direct numerical simulations. However, systematical experimental studies of geometrical structures of sheetlike plumes are still missing. Recently, Funfschilling et al. [30] suggested that when viewed from above thermal plumes near the two plates should be better referred to as linelike plumes, as the vertical extent of these structures do not seem to be established and it appears more likely that they are one dimensional excitations in the marginally-stable boundary layers.
As two different configurations of thermal plumes coexist simultaneously in turbulent RB system, it is natural to ask how sheetlike and mushroomlike plumes transform from each other. By using thermochromic-liquid-crystal (TLC) technique, Zhou et al. [29] showed, in a cylindrical cell with unity aspect ratio ( with and as the inner diameter and the height of the convection cell, respectively.), that hot fluids (plumes) move upwards, imping on the top plate from below, then spread horizontally along the top plate and form waves or sheetlike plumes. As they travel horizontally along the plate, these sheetlike plumes collide with each other or with the sidewall, convolute and form swirls. As these swirls are cooler than the bulk fluid, they move downwards, merge and cluster together. By the symmetry of the system, the same process is expected for the morphological evolution of thermal plumes occurring near the bottom plate. However, in Ref. [29] the morphological evolution was visualized only at a single Rayleigh number (), and it is not clear whether this process is universal for much higher or for cells with different aspect ratios. The understanding of this evolution process is of great importance, as the characterization of coherent structures is essential to the understanding of turbulent flows in many systems.
In the present paper, we report new experiments of the temperature and velocity fields measured at varying depths from the top plate over the Rayleigh number range and the Prandtl number range and in three water-filled cylindrical sapphire cells with aspect ratios 0.5, 1, and 2. We present quantitative results on the relationship between plume number density and and results that relate the evolution of the plume morphology to the heat transport. The remainder of the paper is organized as follows. We give a detailed description about the experimental setup and data analysis method in section 2. In section 3, we study the - and -dependence of plume number and discuss the relationship between thermal plumes and the - scaling. Section 4 presents study on the geometric properties of sheetlike plumes, which are mainly based on data from the aspect ratio 1 cell. We summarize our findings and conclude in section 5.
2 Experimental setup and procedures
2.1 The convection cell and the experimental parameters
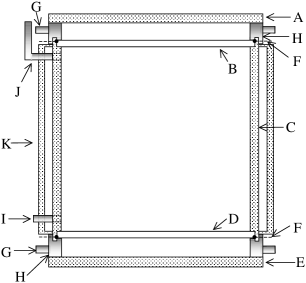
The experiments were carried out in three cylindrical sapphire cells [33, 29]. The schematic diagram of the cells is shown in figure 1. To capture and study the horizontal temperature and velocity fields from top, two sapphire discs (Almaz Optics, Inc) with diameter cm and thickness mm were chosen as the top and bottom plates for their good thermal conductivity ( W/mK at 300 K) compared with other transparent materials. Two chambers, constructed by stainless steel rings and Plexiglas discs and , are used to heat the bottom plate and cool the top plate. Each chamber is connected to a separate refrigerated circulator by four nozzles, water flows into the chamber by two nozzles in two opposite direction and leaves from the other two nozzles perpendicular to the inlets. The sidewall of the cell is a vertical tube made of Plexiglas () with inner diameter cm and wall thickness mm, respectively. The separations between the top and bottom plates are , , and cm so that the aspect ratios of the cells are respectively , 1, and 1/2. Draining () and filling () tubes are fitted on the Plexiglas tube at a distance of cm from the top and bottom plates. A square-shaped jacket () made of flat glass plates and filled with water is fitted to the outside of the sidewall [20], which greatly reduces the spatial variation in the intensity of the white lightsheet caused by the curvature of the cylindrical sidewall. Four rubber O-rings (not shown in the figure) are placed between the two sapphire plates and the steel rings and between the rings and the two Plexiglas discs to avoid fluid leakage. Four thermistors (model 44031, Omega Engineering Inc.) are used to measure the temperature difference between the two sapphire plates. To keep good contact between the plates and the thermistors, the thermistors are wrapped by the heat transfer compound (HTC10s from Electrolube Limited). It is found that the measured relative temperature difference between the two thermistors in the same plate is less than of that across the convection cell for both plates and for all investigated. This indicates the uniform distribution of the temperature across the horizontal plates.
2.2 Liquid crystal measurements
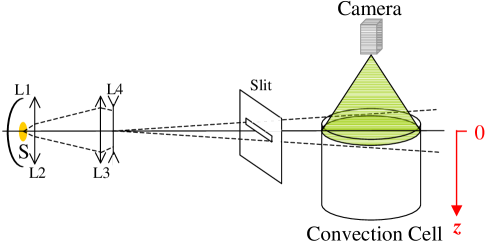
The visualization technique employing thermochromatic liquid crystal (TLC) particles has been widely used and documented in fluid visualization experiments and was used in the present work to visualize the temperature and velocity fields in horizontal fluid layers of varying depth from the cell’s top plate. Two types of TLC microspheres (Hallcrest, Ltd.) were used in the experiments. One type (model R29C4W) was used for low- experiments with the mean bulk temperature ∘C and , and the other type (model R40C5W) was used for high- measurements with ∘C and . Both these particles have a mean diameter of m and density of g/cm3, and were suspended in the convection fluid in very low concentrations (about by weight), at which the influence of TLC particles on the fluid can be neglected. The peak wavelength of light scattered by these particles changes from red to green and then to blue within a temperature window of 4 ∘C from about 29 to 33 ∘C for R29C4W, and of 5 ∘C from about 40 to 45 ∘C for R40C5W. In the experiments, the mean bulk temperature was set to 30 ∘C for R29C4W (Pr ) and to 42 ∘C for R40C5W (Pr ), so that the background fluid appears blue and the red and green regions correspond to cold fluid, i.e. cold plumes. Figure 2 shows a schematic diagram of the optical setup for the experiments. A halogen photo optic lamp () with a power of 650 W was used as the light source. One concave mirror and two condensing lenses and were used to collect the light from and focus it onto the central section of the cell. A horizontal sheet of white light, generated by a diverging cylindrical lens and then projected onto an adjustable slit, passed through the cell parallel to the top plate. The thickness of the lightsheet inside the cell is approximately 3 mm. A Nikon D1X camera, with a resolution pixels and 24 bit dynamic range, was placed on the top of the cell to take photographs of the TLC microspheres. With short camera exposure time ( s), the captured photographs give the instantaneous temperature field, and with long camera exposure time (0.77s) they will in addition show the the trajectories of the particles.
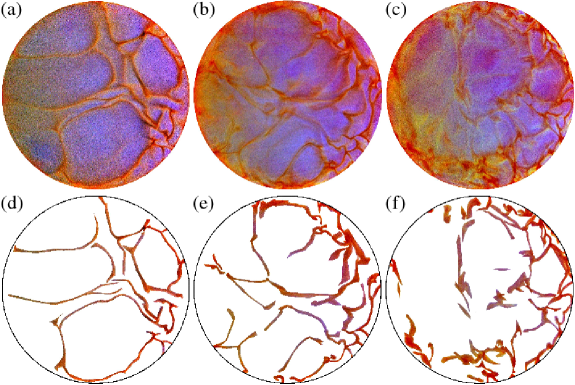
To study thermal plume properties quantitatively, we counted plume numbers and extracted sheetlike plumes. For sheetlike plumes, we took to consecutive images (at mm and with camera exposure time of s) at to s intervals for a given , so that two successive images in each sequence are statistically independent. A cold sheetlike plume is extracted by first manually drawing a contour around its perimeter and then using a software to collect all pixels enclosed by the contour. A program is then used to calculate the perimeter and the area of each extracted plume. To ensure that plumes are identified correctly the operator uses knowledge gained from viewing movies of plume motions. A total of to plumes are identified from the to images, which are not large numbers but should be indicative of the statistical properties. Figures 3(d)-(f) show three examples of extracted plumes with background removed, which correspond to images of TLC microsperes in figures 3(a)-(c), respectively, for three different values of obtained from the unity-aspect-ratio cell. For mushroomlike plumes, we took sequences of images at varying depth from the top plate and with camera exposure time of s at s intervals for each . Each sequence consists images for a given depth. A cold mushroomlike plume was identified as an object with nonzero vorticity and with temperature (color) much lower than that of the background fluid [29] (see, e.g., figure 4(b)). As mushroomlike plumes are partly entangled together, they cannot be separated completely. Nevertheless, we can identify them individually as swirls with cold temperature and thus count their numbers. The cold sheetlike plumes were also identified and counted from these images, as objects with a linelike shape and lower temperature.
3 Plume number statistics
3.1 Morphological evolution of thermal plumes
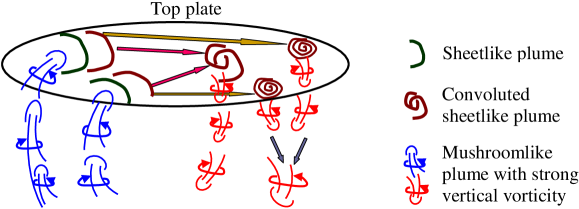
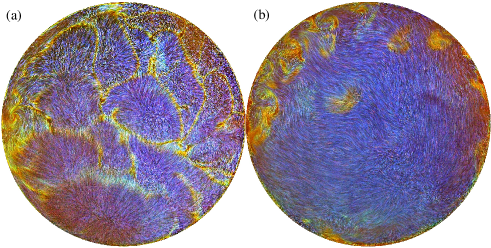
The process of morphological evolution between sheetlike and mushroomlike plumes has been revealed by Zhou et al. [29] in a cylindrical cell. Here, the same process was also observed for all values of and investigated in the experiment. Figure 4(a), taken at 2 mm from the top plate, shows how this evolution comes about. One sees that near the top plate the motion of TLC microspheres appear to emanate from certain regions or “sources” with bluish color, suggesting that hot fluids (plumes) are moving upwards, impinging on and spreading horizontally along the top plate. Along the particle traces, the color turns from blue to green and red, implying that the wave fronts are cooled down gradually by the top plate (and the top thermal boundary layer) as they spread. As they travel along the plate’s surface, sheetlike plumes collide with each other or with the sidewall. As different plumes carry momenta in different directions, they merge, convolute and form swirls (hence generating vorticity). As these swirls are cooler than the bulk fluid, they move downwards, merge and cluster together (see, e.g, figure 4(b)). We note that, by symmetry of the system, the same morphological evolution of thermal plumes should occur near the bottom plate. The physical picture of this evolution process is illustrated in figure 5.
3.2 Depth-dependent properties
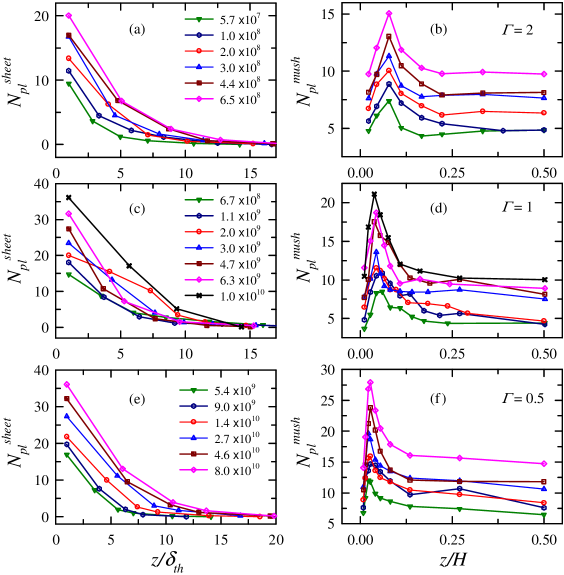
Because of the collision and convolution of sheetlike plumes and the transformation from sheetlike to mushroomlike ones, it is expected that the number of sheetlike plumes should decrease from the top plate, while that of mushroomlike ones should increase, and this is indeed the case as shown in figure 6. Figures 6(a), (c), and (e) show the mean numbers of (cold) sheetlike plumes versus the normalized height obtained from the cells with , 1, and 0.5, respectively. (Here, is the thickness of thermal boundary layer, which was measured in [34, 35].) One sees that decays quickly away from the top plate and the behavior is similar for all studied. Beyond the depth , one can hardly identify any sheetlike plumes from the acquired images. Note that, in addition to transforming into mushroomlike plumes, the rapid reduction of with depth could also be attributed to the limited vertical extent of sheetlike plumes themselves, i.e. plumes, whose vertical extents are shorter than a certain height , could not be captured by the images that are taken farther than from the top plate. We further note that the -dependence of plume numbers may be well described by a decreasing exponential function, i.e. with fitting parameters and for nearly all measured . Hence may be used as a typical height of vertical extent of sheetlike plumes. Figure 7(a) shows the scaled height as a function of . It is seen that increases with for the and 0.5 cells, while keeps nearly constant for the cell. We can not judge the significance of the different behaviors of varying with in cells with different . However, varies only in the range of a few times the thickness of thermal boundary layer (). This suggests that the vertical extent of the so-called sheetlike plumes does not have enough spatial extension in the vertical direction to form sheets.
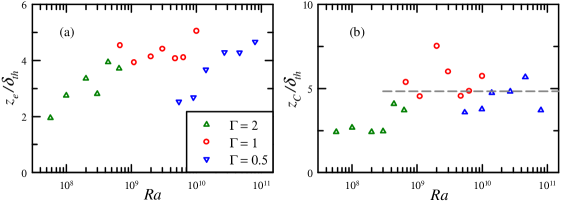
For mushroomlike plumes, the mean numbers of (cold) mushroomlike plumes as a function of the scaled depth is shown in figures 6(b), (d), and (f). With increasing , for all first increases rapidly, then decreases and finally remains approximately constant for positions . When first increases with , it crosses over with at some crossover-depth . The normalized crossover depths are shown in figure 7(b). It is seen that when . For , although the data points seem to be somewhat scattered, they exhibit no clear dependence on and have a mean value of . This implies that the transformation occurs within a region, whose height is only associated with the thermal boundary layer thickness. If one takes this value as the typical vertical extent of sheetlike plumes, these results again suggest that the vertical extent of what is called sheetlike plumes is only the order of several , not much larger than it, and thus not large enough to have a sheetlike shape. This will be further discussed in section 4.4. After attains its maximum value around , it then drops sharply beyond the depth , because of the mixing, merging, and clustering of mushroomlike plumes. As found by Zhou et al. [29], this region corresponds to the region of full width at half maximum of vertical vorticity profile and can be used as a quantitative definition and measure of the mixing zone [36, 21]. It is further found that the peak position in the profiles of , , has no obvious -dependence for each , but decreases slightly from for to for .
3.3 The Rayleigh number dependency
| 0.5 | 1.2 | 0.45 | ||
| 1 | 1.5 | 0.37 | ||
| 2 | 1.6 | 1.86 |
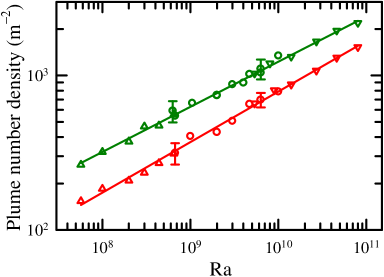
We next focus on the -dependency of plume number density. For sheetlike plumes, the number was counted just outside the thermal boundary layer and the counted number, , for each cell can be well described by a power law , with two fitting parameters and as functions of . Here, the fitted values of and for all three aspect ratios are listed in table 1. It is seen that varies with the cell’s aspect ratio while is approximately the same for all three cells. As the range of is limited for each aspect ratio, we shifted the plume number densities for the and 0.5 cells to agree with data for the cell in their respective overlapping range of . We then fitted a single power-law to the combined data set from the three cells that span almost three decades of . Figure 8 shows the shifted numbers, normalized by the area of the top plate , as well as the plume number from the cell as dark-green symbols. It is seen that a single power law
| (1) |
can be used to well describe the data from all three cells.
For mushroomlike plumes, one sees from figures 6(b), (d), and (f) that there is a peak on the height-profile of mushroomlike plume number for all three cells and for all measured . We use the value at the peak of the height-profile of mushroomlike plume number to examine the -dependence of . It is found that a power law relation can also be used to describe the -dependence of . Again, the fitted is nearly -independent (see table 1). Figure 8 shows the -dependence of (red symbols). Here, the and 0.5 data have also been shifted to agree with the in their respective overlap regions of . It is seen that shows similar trend with as . Again, the relationship between and can be well represented by power-law fits
| (2) |
To make a quantitative connection between thermal plumes and the heat flux, we use the previous experimental finding from both Eularian and Lagrangian measurements that the heat flux are mainly carried by thermal plumes [7, 9]. As mushroomlike plumes are evolved morphologically from sheetlike plumes [29], the total heat flux carried by either type should be the same, i.e.,
| (3) |
Here, and are the mean heat flux carried by individual sheetlike and mushroomlike plumes, respectively, and in the and ranges of the experiment [37, 38]. Recall that the -dependence of [Eq. (1)] and [Eq. (2)] discussed above, one sees that the scaling exponents of the - relation and of the -dependence of plume numbers are the same within experimental uncertainty. This indicates that the heat flux transported by individual plumes is nearly independent of the turbulent intensity, i.e. , and hence the - scaling relation is determined primarily by the number of thermal plumes.
4 Geometric properties of sheetlike plumes
4.1 Aspect ratio of sheetlike plumes
A striking feature that one can observe from figure 3 is that, as the Rayleigh number is increased, the morphology or geometry of sheetlike plumes change from more elongated shape to less elongated and more fragmented. The extracted horizontal cuts of sheetlike plumes may be characterized by a typical length and a typical width . With increasing , the length of sheetlike plumes seems to decrease, while the plume’s width seems to increase. To describe these geometric properties quantitatively, we define the aspect ratio of sheetlike plumes, , as
| (4) |
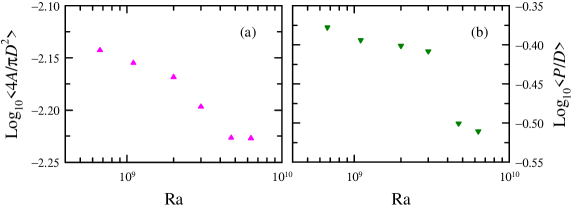
Figure 9 shows the -dependency of the mean aspect ratio of sheetlike plumes in a log-log plot. It is seen that decreases with increasing and the relation can be described by a power-law with a scaling exponent . We note that can also be described by a logarithmic function of and we cannot definitively conclude which one, between power-law and logarithm, is a better choice. Figures 10(a) and (b) show -dependence of (a) the mean normalized area and (b) the mean normalized perimeter of sheetlike plumes. Again, these two quantities are found to decrease with increasing . All these behaviors are well illustrated in figure 3, and suggest that when the flow becomes more turbulent, the increased mixing, collision, and convolution can more easily fragment large-sized sheetlike plumes into smaller ones.
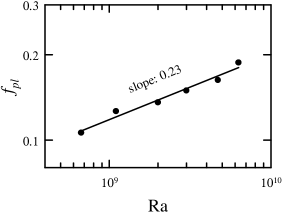
Figure 11 shows the plume area fraction as a function of the Rayleigh number in a log-log plot. It is seen that increases with increasing and a power-law function with a scaling exponent 0.23 can be used to describe well the relationship between and . Using the shadowgraph technique, [30] studied -dependence of the plume area fraction. Although the scaling range is limited, they found a power-law scaling of with for and the obtained scaling exponent is around 2.
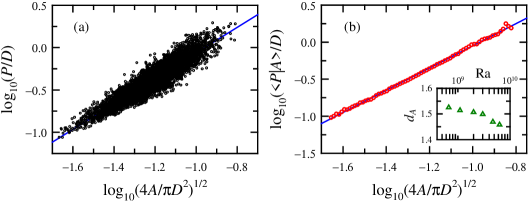
Next we examine the relationship between plume perimeter and area. Figure 12(a) shows a scatter plot of the normalized perimeter and the normalized size of sheetlike plumes, which contains a total of sheetlike plumes, extracted from a sequence of images at Ra . Here, the perimeter and area are normalized by the diameter and the area of the conducting plate, respectively. Although the data look somewhat scatter, one sees that the perimeter increases with area and all data points can be fitted by a power-low function,
| (5) |
To better explore this feature, the conditional average on the normalized size is shown in figure 12(b). In the figure, a good scaling range can be seen and the solid line is a power-law fit . We find that such a scaling behavior exists for all investigated. The inset of figure 12(b) shows the -dependence of . One sees that these have a mean value of , but decrease from to when increases from to . These measured values of are further found to be larger than the value of 1.29 found for isoconcentration contours of passive scalars measured in the same system [40].
Mathematically, as introduced by Mandelbrot [41] and Lovejoy [42], is the fractal dimension of the boundary of sheetlike plumes and satisfies . Fractal dimensions in turbulence have been widely studied (see, for example, Ref. [43]). In the present case, our results seem to suggest that the boundary of sheetlike plumes is fractal with the dimension of around and the slight decrease of may suggest that the shape of sheetlike plumes becomes smoother when the flow becomes more turbulent, as a result of the increased mixing. However, the extracted sheetlike plumes, as shown in figure 3, do not look like fractal objects. To understand this and to see if applying the machinery of fractal analysis to the geometric properties of plume can shed some light on the problem, we study the shape complexity of the plumes.
4.2 Shape complexity of sheetlike plumes
The geometric complexity of an object can be characterized by its shape complexity, which is a dimensionless ratio between its area and volume. The shape complexity was previously used to study the shape of isocontours for passive scalar fields in turbulence [39]. We introduce it here to describe the shape of sheetlike plumes. For a two-dimensional (2D) closed contour, the shape complexity is defined as follows,
| (6) |
where and are the perimeter of the contour and area inclosed by the contour, respectively, and the subscript 2 refers to 2D. As a circle has the minimum perimeter among all 2D objects with the same area , the shape complexity satisfies and can be used to describe the departure of an object from the shape of a circle. For a fractal object, a larger implies a rougher contour (or surface) the object. For a non-fractal object, a larger signifies that the object is more different from a circle (e.g. it is more elongated).
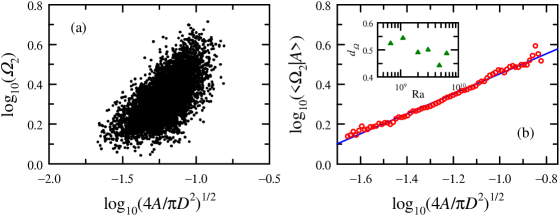
Figure 13(a) shows a scatter plot of the shape complexity and the normalized dimension (or size) of sheetlike plumes, obtained from the same data set as those in figure 12. It is seen that the mean trend of the relation between the size and shape complexity can be captured by an increasing function, i.e., the plume with larger size has a higher probability of possessing a larger . To illustrate this mean trend more clearly, the conditional average on the normalized size is plotted in figure 13(b). The solid line in the figure is a power-law fit, i.e.,
| (7) |
and the reasonable scaling range can be found. Here, is an immediate consequence of the definition of shape complexity [Eq. (6)] together with the power-law relation [Eq. (5)]. The inset of figure 13(b) shows the -dependence of . One sees that decreases slightly with increasing , which may be understood from the decrease of .
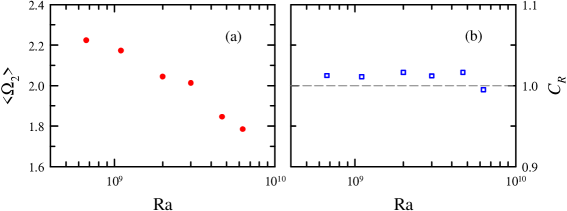
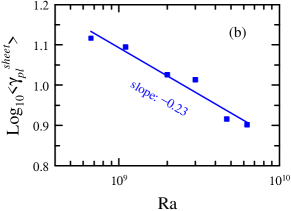
Figure 14(a) shows the -dependence of the mean shape complexity . It is seen that decreases with increasing . This suggests that, because of the increased mixing, collision and convolution of sheetlike plumes, the shape of sheetlike plumes become closer to the shape of a circle when the flow becomes more turbulent. This also implies the decreases of plume’s aspect ratio with increasing . Indeed, with the definitions of [Eq. (4)] and [Eq. (7)], one can obtain the relation between of and , i.e.,
| (8) |
which implies that decreases with decreasing when . Furthermore, is proportional to when . Accordingly, the decrease of , shown in figure 14(a), may be understood as the result of the change in aspect ratio of the sheetlike plumes, i.e. the decrease of (see figure 9), as is much larger than 1 for most of situations. To see this more clearly, we study the ratio between and . Note that Eq. (8) is valid only for an individual plume, while is in an average sense. Figure 14(b) shows as a function of . It is seen that for nearly all investigated. This result demonstrates clearly that the decrease of is caused by the decrease of the plume’s aspect ratio, rather than by a decreased roughness in the case of a fractal object which the sheetlike plumes are not.
4.3 Distributions of geometric measures of sheetlike plumes
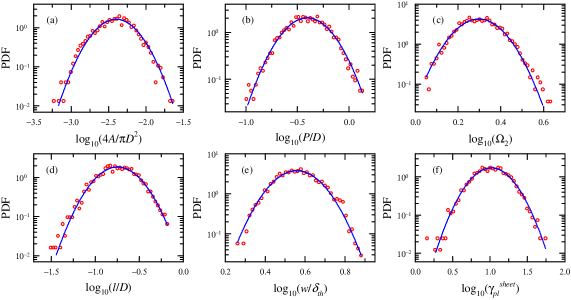
In a previous study, Zhou et al. [29] found that the area of sheetlike plumes obeys log-normal statistics. Here, we further investigate distributions of other geometric measures of sheetlike plumes. Figures 15(a)-(f) show the measured PDFs of normalized geometric measures, i.e. , , , , , and , of sheetlike plumes. It is seen that all these quantities have a same distribution, i.e. the log-normal distribution. The same distributions were also found for all of these quantities at other investigated in our experiments. Together with the log-normal distributions found for mushroomlike plumes [21], these findings suggest that the log-normal distribution is universal for thermal plumes and log-normal statistics may be used to model them, at least in turbulent RBC. In addition, this log-normal statistics of thermal plumes is different from that of passive scalars measured in the same system, which is found to obey a log-Poisson statistics [40].
4.4 Three-dimensional structures of sheetlike plumes
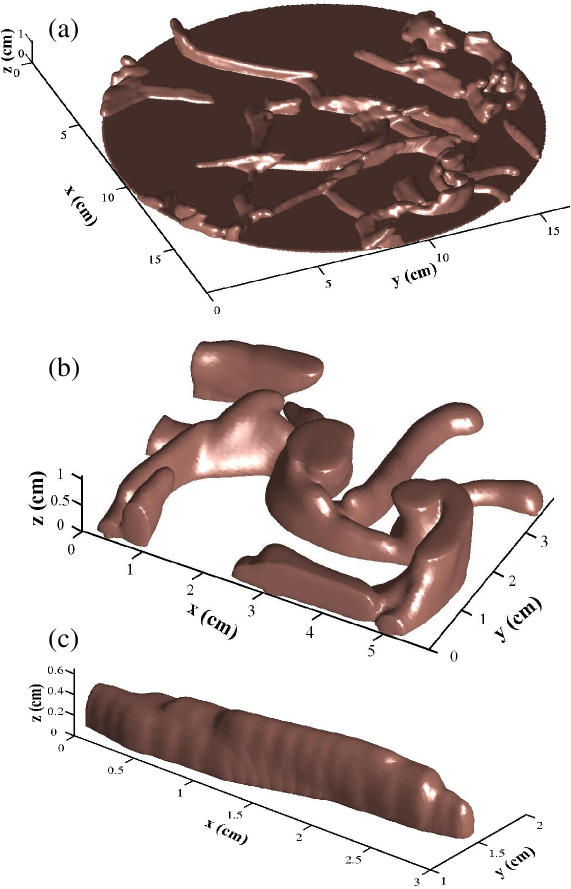
Finally, we study the 3D structures of sheetlike plumes. Results obtained in section 3.2 have suggested that the vertical extent of what is called sheetlike plumes is only of the order of the thermal boundary layer thickness, and hence not large enough to form a sheet. To see this more clearly , we used a tomographic reconstruction technique to construct the 3D image of thermal plumes from sequences of 2D images acquired near the top plate of the cell. To achieve this, the convection cell was placed on a translational stage and, as the cell traverses continuously at a speed of , a series of photographs of TLC microspheres were recorded by a Nikon D3 camera (3CCD, with a resolution of pixels) operating at 11 frames/s. As the speed of the the horizontal motion of the sheetlike plumes are about , the sequences of the horizontal slices of the plumes may be regarded as taken at approximately the same time. In post-experiment analysis, 2D horizontal cuts of cold plumes were extracted from the images taken in each run and a MATLAB script was used to reconstruct 3D thermal plumes from these extracted 2D cuts. Figure 16(a) shows an example of the reconstruction of 3D thermal plumes near the top plate. From the figure, one can see how mushroom-like plumes are formed by the convolution (or spiraling) of sheetlike plumes. Figure 16(b) shows this process more clearly, which is an enlarged region of the image. Another noteworthy feature is that most plumes have a one-dimensional structure, rather than a sheetlike shape. This geometric feature may be illustrated more clearly by figure 16(c), which shows the reconstruction of an enlarged individual 3D plume. It is seen that both the height and the width of this plume extend only to a few millimeters, while its length extends to a few centimeters. This is the most direct evidence thus far that shows thermal plumes near the conducting plates are only one-dimensional structures with horizontal length being much larger than their horizontal width and vertical extent, which has been suggested previously [30]. Therefore, we may hereafter call thermal structures near the conducting plates rod-like plumes. Future investigations will be focused on the geometric properties of 3D structures of both rod-like and mushroom-like thermal plumes.
5 Conclusions
In this paper, we have presented a detailed experimental study of the temperature and velocity fields in turbulent Rayleigh-Bénard convection using the thermochromic-liquid-crystal technique. The number statistics and geometric properties of sheetlike/rodlike thermal plumes were investigated. Major findings are summarized as follows:
(i) When observed from above, the previous-called sheetlike thermal plumes near the top plate seem to be only one-dimensional structures and should be called rodlike plumes hereafter. These plumes evolve morphologically, i.e. convolute or spiral, to mushroomlike plumes. The width () of the region near the plates within which these rodlike plumes exist and evolve morphologically is only associated with the thermal boundary thickness (i.e. several ).
(ii) The numbers of sheetlike/rodlike and mushroomlike plumes, and , are found to both scale as . This finding suggests that the total amount of heat flow is dominated only by the number of thermal (rodlike or mushroomlike) plumes and the normalized mean heat content carried by each type of plumes is approximately independent on .
(iii) As the turbulent intensity is increased, large-sized sheetlike/rodlike plumes are more easily to be fragmented into smaller ones and hence their aspect ratios decrease.
(iv) Although sheetlike/rodlike plumes do not look like fractal objects, , power-law relations can be used to characterize the relationship between their perimeter and area and between their size and shape complexity.
(v) Geometric measures of thermal plumes are found to have a universal distribution, i.e. the log-normal distribution. Thus, log-normal statistics may be used to model thermal plumes. In contrast, for the mixing of passive scalars measured in the same system, it is found that the same quantities obey log-Poisson statistics [40].
(vi) The Ra-dependency of the plume area density ()suggests that the plume number increase with () can be largely attributed to the increased emission of plumes (as is increased), rather than as a result of fragmentation of plumes.
Acknowledgments
We gratefully acknowledge support of this work by the Research Grants Council of Hong Kong SAR (Nos. CUHK403806 and 403807) (K.Q.X.) and by the Natural Science Foundation of Shanghai (No. 09ZR1411200), “Chen Guang” project (No. 09CG41), and RFDP of Ministry of Education of China (No. 20093108120007) (Q.Z.).
References
References
- [1] Siggia E D 1994 High Rayleigh number convection Annu. Rev. Fluid Mech. 26 137-168
- [2] Ahlers G, Grossmann S and Lohse D 2002 Heat transfer and large scale dynamics in turbulent Rayleigh-Bénard convection Rev. Mod. Phys. 81 503-537
- [3] Lohse D and Xia K Q 2010 Small scale properties of turbulent Rayleigh-Bénard convection Annu. Rev. Fluid Mech. 42 335-364
- [4] Morgan W J 1968 Rises trenches great faults and crustal blocks J. Geophys. Res. 73 1959
- [5] Jellinek A M and Manga M 2004 Links between long-lived hot spots, mantle plumes, D”, and plate tectonics Rev. Geophys. 42 RG3002
- [6] Rieutord M and Zahn J P 1995 Turbulent plumes in stellar convective envelopes Astron. Astrophys. 296 127-138
- [7] Shang X D, Qiu X L, Tong P and Xia K Q 2003 Measured local heat transport in turbulent Rayleigh-Bénard convection Phys. Rev. Lett. 90 074501
- [8] Shang X D, Qiu X L, Tong P and Xia K Q 2004 Measurements of the local convective heat flux in turbulent Rayleigh-Bénard convection Phys. Rev. E 70 026308
- [9] Gasteuil Y, Shew W L, Gibert M, Chilla F, Castaing B and Pinton J F 2007 Lagrangian temperature, velocity, and local heat flux measurement in Rayleigh-Bénard convection Phys. Rev. Lett. 99 234302
- [10] Grossmann S and Lohse D 2004 Fluctuations in turbulent Rayleigh-Bénard convection: The role of plumes Phys. Fluid 16 4462-4472
- [11] Moses E, Zocchi G and Libchaber A 1993 An experimental study of laminar plumes J. Fluid Mech. 251 581-601
- [12] Kaminski E and Jaupart C 2003 Laminar starting plumes in high-Prandtl-number fluids J. Fluid Mech. 478 287-298
- [13] Zocchi G, Moses E and Libchaber A 1990 Coherent structures in turbulent convection: an experimental study Physica (Amsterdam) A166 387 C407
- [14] Moses E, Zocchi G, Procaccia I and Libchaber A 1991 The Dynamics and Interaction of Laminar Thermal Plumes Europhys. Lett. 14 55-60
- [15] Gluckman B J, Willaime H and Gollub J P 1993 Geometry of isothermal and isoconcentration on surfaces in thermal turbulence Phys. Fluids A 5 647-661
- [16] Ciliberto S, Cioni S and Laroche C 1996 Large-scale flow properties of turbulent thermal convection Phys. Rev. E 54 R5901-5904
- [17] Zhang J, Childress S and Libchaber A 1997 Non-Boussinesq effect: Thermal convection with broken symmetry Phys. Fluids 9 1034-1042
- [18] Du Y B and Tong P 1998 Enhanced heat transport in turbulent convection over a rough surface Phys. Rev. Lett. 81 987-990
- [19] Qiu X L and Tong P 2001 Onset of convection in turbulent Rayleigh-Bénard convection Phys. Rev. Lett. 87 094501
- [20] Xi H D, Lam S and Xia K Q 2004 From laminar plumes to organized flows: the onset of large-scale circulation in turbulent thermal convection J. Fluid Mech. 503 47-56
- [21] Zhou S Q and Xia K Q 2002 Plume statistics in thermal turbulence: mixing of an active Scalar Phys. Rev. Lett. 89 184502
- [22] Zhou S Q and Xia K Q 2009 Statistical characterization of the thermal structures in turbulent Rayleigh-Bénard to be published
- [23] Tanaka H and Miyata H 1980 Turbulent natural convection in a horizontal water layer heated from below Int. J. Heat Mass Transfer 23 1273-1281
- [24] Vorobie P and Ecke R 2002 Turbulent rotating convection: an experimental study J. Fluid Mech. 458 191-218
- [25] Funfschilling D and Ahlers G 2004 Plume motion and large-scale circulation in a cylindrical Rayleigh-Bénard cell Phys. Rev. Lett. 92 194502
- [26] Haramina T and Tilgner A 2004 Coherent structures in boundary layers of Rayleigh-Bénard convection Phys. Rev. E 69 056306
- [27] Puthenveettil B A and Arakeri J H 2005 Plume structure in high-Rayleigh-number convection J. Fluid Mech. 542 217-249
- [28] Puthenveettil B A and Arakeri J H 2005 The multifractal nature of plume structure in high-Rayleigh-number convection J. Fluid Mech. 526 245-256
- [29] Zhou Q, Sun C and Xia K Q 2007 Morphological evolution of thermal plumes in turbulent Rayleigh-Bénard convection Phys. Rev. Lett. 98 074501
- [30] Funfschilling D, Brown E and Ahlers G 2008 Torsional oscillations of the large-scale circulation in turbulent Rayleigh-Béenard convection J. Fluid Mech. 607 119-139
- [31] Puthenveettil B A and Arakeri J H 2008 Convection due to an unstable density difference across a permeable membrane J. Fluid Mech. 609 139-170
- [32] Shishkina O and Wagner C 2008 Analysis of sheet-like plumes in turbulent Rayleigh-Bènard convection J. Fluid Mech. 599 383-404
- [33] Xi H D, Zhou Q and Xia K Q 2006 Azimuthal motion of the mean wind in turbulent thermal convection Phys. Rev. E 73 056312
- [34] Lui S L 1997 Experimental investigation of the temperature field in turbulent convection M.Phil. Thesis The Chinese University of Hong Kong
- [35] Lui S L and Xia K Q 1998 Spatial structure of the thermal boundary layer in turbulent convection Phys. Rev. E 57 5494-5503
- [36] Castaing B, Gunaratne G, Heslot F, Kadanoff L, Libchaber A, Thomae S, Wu X Z, Zaleski S and Zanetti G 1989 Scaling of hard thermal turbulence in Rayleigh-Bénard convection J. Fluid Mech. 204 1-30
- [37] Xia K Q, Lam S and Zhou S Q 2002 Heat-flux measurement in high-Prandtl-number turbulent Rayleigh-Bénard convection Phys. Rev. Lett. 88 064501
- [38] Nikolaenko A and Ahlers G 2003 Nusselt number measurements for turbulent Rayleigh-Bénard convection Phys. Rev. Lett. 91 084501
- [39] Catrakis H J and Dimotakis P E 1998 Shape complexity in turbulence Phys. Rev. Lett. 80 968-971
- [40] Zhou Q and Xia K Q 2010 Mixing evolution and geometric properties of passive scalar field in high-Schmidt-number buoyancy-driven turbulence to be published
- [41] Mandelbrot B B 1982 The Fractal Geometry of Nature (Freeman, NY, 1982)
- [42] Lovejoy S 1982 Area-perimeter relation for rain and cloud areas Science 216 185-187
- [43] Sreenivasan K R 1991 Fractals and multifractals in fluid turbulence Annu. Rev. Fluid Mech. 23 539-600.