The interacting galaxy pair KPG 390: H kinematics.
Abstract
In this work we present scanning Fabry-Perot H observations of the isolated interacting galaxy pair NGC 5278/79 obtained with the PUMA Fabry-Perot interferometer. We derived velocity fields and rotation curves for both galaxies. For NGC 5278 we also obtained the residual velocity map to investigate the non-circular motions, and estimated its mass by fitting the rotation curve with a disk+halo components. We test three different types of halo (pseudo-isothermal, Hernquist and Navarro Frenk White) and obtain satisfactory fits to the rotation curve for all profiles. The amount of dark matter required by pseudo-isothermal profile is about ten times smaller than, that for the other two halo distributions. Finally, our kinematical results together with the analysis of dust lanes distribution and of surface brightness profiles along the minor axis allowed us to determine univocally that both components of the interacting pair are trailing spirals.
1 Introduction
Interactions and mergers of galaxies are common phenomena in the Universe. Isolated pairs of galaxies represent a relatively easy way to study interactions between galaxies because these systems, from a kinematical point of view, are simpler than associations and compact groups of galaxies, where so many galaxies participate in the interaction process that it is difficult to discriminate the role of each galaxy in the interaction.
In the case of isolated disk galaxies the physical processes that determine secular evolution are internal processes (internal secular evolution). The timescale of these processes is of the order of many galaxy rotation periods and generally involve the interactions of individual stars or gas clouds with collective phenomena such as bars, oval distorsions, spiral structure and triaxial dark matter halos (Kormendy & Kennicutt, 2004; Kormendy & Fisher, 2008). In the case of interacting galaxies one talks about environmental secular evolution. The time scale of the environmental secular evolution is of the same order as that of the internal secular evolution (both are slow processes). This phenomenon is driven by prolonged gas infall, by minor mergers and by galaxy harassment. Secular evolution processes (internal or external) are slow phenomena in comparison with galaxy mergers and stripping of gas that also belong to the context of interacting galaxies and determine their evolutionary stage (Kormendy & Kennicutt, 2004; Kormendy & Fisher, 2008).
Long-slit spectroscopy studies (Nelson et al., 1998; Liu & Kennicutt, 1995) restrict the information only to a few points in a galaxy. These kinds of studies are principally focused on axisymmetric systems such as isolated galaxies because a full rotation curve is obtained by placing the slit along the major axis of the galaxy. In the case of interacting systems, the slit is usually placed only in a few positions obtaining spectra on regions of interest. Although some kinematic information is derived, it is not possible to obtain true rotation curves of the galaxies. On the other hand, scanning interferometric Fabry-Perot observations give us kinematic information of the whole interacting system. This is very important in the case of asymmetrical and perturbed systems as is the case with interacting galaxy pairs. Extended kinematic information can help determine the effect of the interaction process on each of the members of the system (Amram et al., 2004; Rampazzo et al., 2005; Fuentes-Carrera et al., 2007; Bizyaev et al., 2007). This technique allows more sensitivity to detect faint objects due to increased brightness and field of view and has more spatial and spectral resolution than classic spectrographs.
Obtaining kinematical information on interacting galaxies systems is useful to understand the effect the interaction could have on each of the members of the pair (Marcelin et al., 1987; Amram et al., 1994, 2002; Fuentes-Carrera et al., 2004, 2007). Rotation curves measurement, for instance, is necessary to study the mass distribution in spiral galaxies and for estimation of the amount of dark matter (Rubin et al., 1976; Bosma et al., 1977; Blais Ouellette et al., 2001, among other authors).
There are at least two independent methods to study the mass distribution in paired galaxies using kinematics. The first one considers the difference in systemic velocities of the galaxy components as a lower limit to the orbital velocity of the smaller galaxy (companion) assuming a circular orbit, and the projected separation of the orbital radius of the companion galaxy, in order to estimate the lower limit mass of the larger (primary) galaxy (Karachentsev & Myneva, 1984). The second one is based on the decomposition of the rotation curve, considering the contribution of various mass components such as bulge, disk and dark matter halo (van Albada et al., 1985). Thus, one can compare the mass derived from the orbital velocity of the companion in a galaxy pair to the more detailed predictions of a mass model, based on the kinematics of each galaxy component.
In this work we study the system NGC 5278/79 (known also as Arp 239 and KPG 390) belonging to a particular class of interacting pair of galaxies: the M51-type galaxies. According to Reshetnikov & Klimanov (2003), the two empirical criteria to classify an M51-type pair of galaxies are that the B-band luminosity ratio of the components (main/satellite) vary between and , and that the projected distance of the satellite does not exceed two optical diameters of the main component. In the case of NGC 5278/79 the B-band luminosity ratio is and the projected separation is kpc (optical diameter of the main component is kpc as we can see from Table 1). Thus, NGC 5278/79 is classified as an M51-type pair of galaxies. M51-type galaxy pairs are interesting because the mass of the system can be evaluated, in principle, by two different ways, mentioned above: by means of the rotation curves of each component, and by estimating the orbital motion of the satellite galaxy around the main galaxy. With the help of HST images (Windhorst et al., 2002), showing dust lanes across the nuclei of both galaxy components we can determine which are the nearest sides of the galaxies and thus, to determine whether the spiral arms are leading or trailing, as well as to have an extensive view of the geometric conditions of the encounter in order to perform numerical simulations. It is important to recall that according to several studies, leading spiral arms can only exist in interacting systems with retrograde encounters triggering the formation of spiral arms (Athanassoula, 1978; Byrd et al., 1989; Thomasson et al., 1989; Keel, 1991; Byrd et al., 1993), conditions that, in principle, taking into account the morphology, could be fulfilled by NGC 5278/79. Thus, it is worth to explore this possibility in this particular case. These are the main motivations of this work.
In this paper we present scanning Fabry-Perot observations, velocity fields and rotation curves of this interacting galaxy pair. The aim of this study is to perform detailed kinematic and dynamic analysis of NGC 5278/79 using H kinematical data in order to study the mass distribution of this pair of galaxies with the two methods mentioned above and to determine the type of spiral arms (leading or trailing) in the galaxy members with the intention of reproducing both its morphology and kinematics with future numerical simulations that could shed more light on the interaction process. Last, but not least, there are no 3D spectroscopic works on this pair (neither scanning H Fabry-Perot nor HI) neither X-ray data. In Section 2 we present an overview of the observations and the data reduction process. In Section 3 we present the derived velocity field and the associated rotation curve of each component of the pair. In Section 4 the kinematics inferred from the velocity fields and rotation curves is discussed analyzing carefully the role of non-circular motions. Section 5 is devoted to the dynamical analysis with the computation of the mass for each galaxy of the pair. The discussion is presented in Section 6, and conclusions are presented in Section 7.
1.1 NGC 5278/79 (Arp 239; KPG 390; Mrk 271)
This pair was first cataloged by Vorontsov-Velyaminov (1959) with the identifier VV 019. It was later included in Arp’s Atlas of Peculiar Galaxies with the identifier Arp 239 (Arp, 1966). Grouped with other objects it was classified as appearance of fission. It appears in the Karachentsev’s catalog of isolated pair of galaxies (Karachentsev, 1972) as KPG 390. According to Karachentsev’s classification, NGC 5278 is the primary galaxy of the pair (i.e., the main component) and NGC 5279 is the secondary one (i.e., the satellite, according to the discussion on M51-type of galaxy pairs given above). In the Uppsala General Catalog of Galaxies NGC 5278 and NGC 5279 are identified as UGC 08677 and UGC 08678, respectively (Nilson, 1973). The main data about this pair are collected in Table 1. There are not many works on this pair in the literature. The existing works are of statistical character mostly, as part of vast surveys of interacting galaxies (Turner, 1976; Cutri & McAlary, 1985; Klimanov & Reshetnikov, 2001).
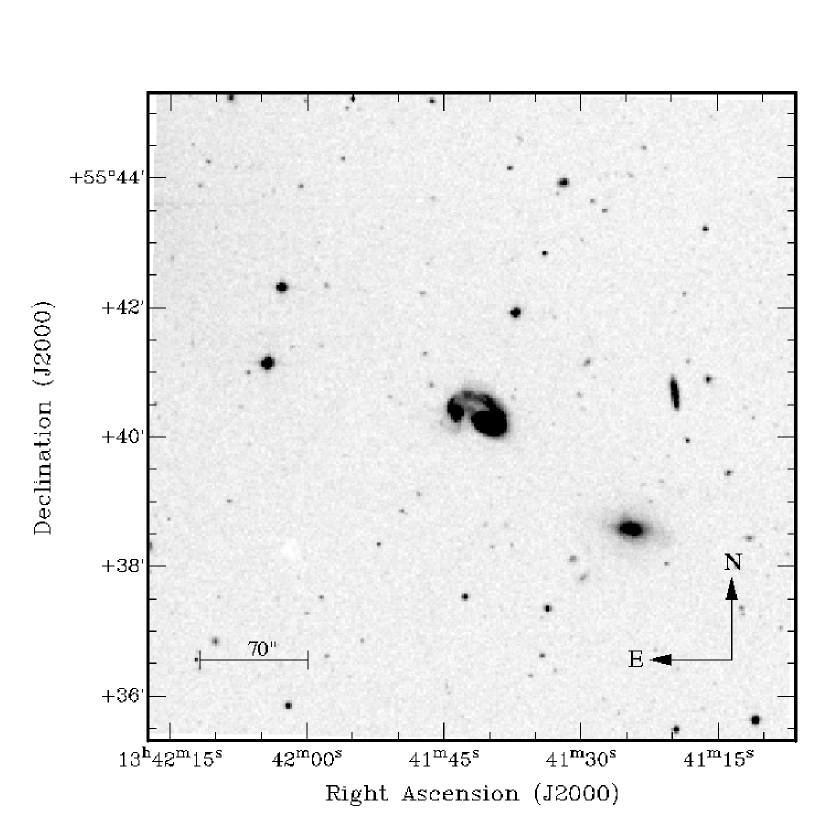
The pair consists of two spiral galaxies NGC 5278 and NGC 5279 (Fig. 1 and Fig. 2). In the DSS blue band image shown in Fig. 1 is evident the bridge region, fainter than the continuum emission of the two components of KPG 390.
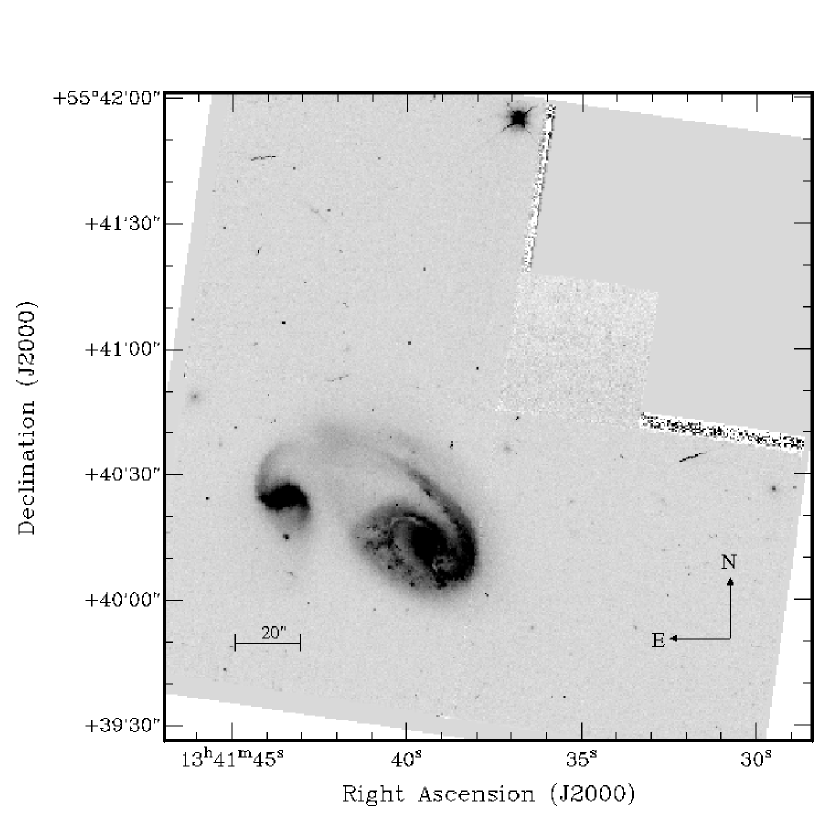
Figure 2 shows HST image from Windhorst et al. (2002). These authors, by means of images observed with the HST Wide Field and Planetary Camera 2 (WFPC2) at several UV-wavelengths, notice that the inner parts of both components show significant dust lanes and observe that part of the dust seems to spread along one of the arms. The most remarkable feature is a very curved thin dust lane that drapes across the primary galaxy. This dust lane starts near the southern spiral arm of NGC 5278, curves around the small nuclear bulge of this galaxy, and appears in the spiral arm connecting the two galaxies in the north-east direction as one can see in Fig. 2. The presence of dust lanes in this M51-type pair allows to determine the tilt of the galaxy (nearer or farther side) once we know the kinematics as it will be discussed later on.
The HST images also show that the encounter clearly distorts the galaxy disks of both components. The result is the formation of tidal tails and excitation of a strong mode in NCG 5278.
| Parameters | NGC 5278 | NGC 5279 |
|---|---|---|
| Coordinates (J2000)aaAdelman-McCarthy et al. (2008); Jarrett et al. (2003) | R.A. | R.A. |
| Dec. | Dec. | |
| Morphological type bbvan den Bergh et al. (2003) | SA(s)b? pec | SB(s)a pec |
| Distance (Mpc) ccde Vaucouleurs et al. (1991) | 100.6 | 101.1 |
| Apparent diameter (arcsec)ccde Vaucouleurs et al. (1991) | 80.912.0 | 36.206.30 |
| Apparent diameter (kpc) ccde Vaucouleurs et al. (1991) | 39.26.0 | 17.53.10 |
| Axis ratioccde Vaucouleurs et al. (1991) | 0.71 | 0.72 |
| (mag)eeMazzarella & Boroson (1993) | 14.29 | 15.20 |
| (mag)eeMazzarella & Boroson (1993) | -20.95 | -20.05 |
| Surface brightness (mag arcsec-2) eeMazzarella & Boroson (1993) | 22.51 | 22.96 |
| Systemic velocity (km s-1) | 7541ccde Vaucouleurs et al. (1991) | 7580ccde Vaucouleurs et al. (1991) |
| 7627ddThis work | 7570ddThis work | |
| Major axis position angle (deg) | 53.0ffPaturel et al. (2000) | 3.0ffPaturel et al. (2000) |
| 42.0ddThis work | 141.5ddThis work | |
| Inclination (deg) | 38.9ffPaturel et al. (2000) | 59.8ffPaturel et al. (2000) |
| 42.0ddThis work | 39.6ddThis work |
. . . . . .
Keel et al. (1985) present spectra of NGC 5278/9, in an attempt to investigate the nuclear activity of the pair, and classify this interacting pair as an intermediate class between Seyfert 2 nuclei and LINER (both galaxies). Radio observations in 21cm HI line found a HI flux of Jy km s-1 and a total HI mass of M⊙ (Bushouse, 1987). Recently, Condon et al. (2002) identified KPG 390 as a radio source stronger than mJy at GHz from the NRAO VLA sky Survey (NVSS). These authors give a GHz flux density of mJy. The broad-band CCD images of this pair presented by Mazzarella & Boroson (1993) reveal a number of regions of enhanced brightness, being the brightest one located in NGC 5279. These authors find morphological properties, luminosities and colors of this system, and also give photometry of the individual nuclei and giant HII regions of KPG 390 or Mrk 271. As this pair is labeled as Markarian, it is very prominent in GALEX images (Martin et al., 2005). A glimpse at FUV and NUV images reveals a bridge between the two galaxies, being much brighter in NUV. Such UV emission is generally associated with regions of intense star formation. Thus, the star formation along the bridge may be induced by a recent tidal passage. In the disk of NGC 5278 and NGC 5279 the emission is irregular and no apparent gradient of emission is observed.
Mazzarella & Boroson (1993) use long-slit spectrometers of low spectral resolution to derive spectroscopic data of KPG 390. Klimanov et al. (2002) by means of long-slit spectroscopy find that both galaxies rotate in opposite directions. An interesting detail noted by those authors is a large discrepancy between dynamic and photometric centers of both components (off centered in positions: ( kpc) for NGC 5278, and ( kpc) for NGC 5279).
Concerning the closest environment of the pair, in the west side of Fig. 1 (field of ) are clearly visible two neighbour galaxies: UGC 8671 seen as edge-on elliptical and MCG+09-22-094. The radial velocity of UGC 8671 is km s-1 (Falco et al., 1999) and the radial velocity of MCG+09-22-094 is km s-1 (van den Bergh et al., 2003). According to Karachentsev (1972), the difference in radial velocity for galaxies to be an interacting system should be km s-1. For this reason MCG+09-22-094 is a false neighbour and in the case of UGC 8671 km s-1, so perhaps this galaxy is a member of KPG 390. Althought the lack of information on mass of UGC 8671, using the values of the major axis (Nilson, 1973) and the B-band magnitude (de Vaucouleurs et al., 1991) we infer that the mass of UGC 8671 is very similar to the mass of NGC 5279 (see Table 1). In order to determine if UGC 8671 is part of a group with NGC 5278 and NGC 5279 we check whether this galaxy satisfies the basic isolation criterion (Karachentsev, 1972). Karachentsev examines galaxies with apparent magnitudes of pair members . The parameters of the basic isolation criterion are , , and the angular diameters of NGC 5278, NGC 5279, UGC 8671 are a, a and a, respectively (see Table 1). Applying the basic isolation criterion to these data we see that the angular diameter of UGC 8671 does not occur in the interval a1 a3 a1, it occurs instead in the interval a2 a3 a2. In the first case KPG 390 is an isolated pair of galaxies. In the second case it satisfies the inequality a3/a2 and, consequently, this pair can also be considered as isolated according to the basic criterium. Thus, according to Karachentsev criteria, the UGC 8671 does not belong to KPG 390. On the other hand there are at least other thirtheen galaxies that are visible in larger field of DSS blue image (not presented in this work). In the south-west direction there are two galaxies PGC 2507704 and PGC 2509387 respectively with radial velocities 10992 km s-1 and 7358 km s-1. In the north-east direction are located other five galaxies PGC 2513261, PGC 2514229, SDSS J134224.97+554926.0, PGC 2515693, PGC 2516823, respectively with radial velocities 7575 km s-1, 20848 km s-1, 12504 km s-1 , 21573 km s-1 and 20293 km s-1. Other six galaxies are clearly visible in the south-east direction IC0922, PGC 2507810, PGC 2505734, IC 0918, IC 0919 and PGC 2505000, respectively with radial velocities 19955 km s-1, 21006 km s-1, 21328 km s-1, 21183 km s-1, 10555 km s-1 and 10453 km s-1 (Abazajian, 2004). The present identification is partial because there are other fainter and smaller galaxies that we cannot distinguish in the DSS blue image. The galaxies PGC 2509387 and PGC 2513261 have km s-1 with respect to KPG 390, but diameters and such that they do not satisfy the basic criterium of Karachentsev (1972).
It would be useful to complement our H kinematic study with EVLA HI observations with high spatial extent and resolution. The 21 cm radio observations could reveal extended features of ongoing interaction, providing additional information on kinematics of the KPG 390 environment.
2 Observations and data reduction
Observations of NGC 5278/79 (Arp 239, KPG 390) were done in 2002 July at the f Cassegrain focus of the 2.1 m telescope at the Observatorio Astronómico Nacional in San Pedro Mártir (México), using the scanning Fabry-Perot interferometer PUMA (Rosado et al., 1995). We used a Site CCD detector and considered only the central pixels corresponding to field of view of arcminutes, encompassing the two galaxy components. The resulting image layout after a binning in both spatial dimensions was pixels with a spatial sampling of pixel-1. In order to isolate the redshifted H emission, we used an interference filter centered at Å with a FWHM of Å. PUMA is a focal reducer built at the Instituto de Astronomía-UNAM used to make direct imagery and Fabry-Perot (FP) spectroscopy of extended emission sources (field of view ). The FP used is an ET-50 (Queensgate Instruments) with a servostabilization system having a free spectral range of Å ( km s-1) at H. Its finesse () leads to a sampling spectral resolution of Å ( km s-1) which is achieved by scanning the interferometer free spectral range through 48 different channels (Rosado et al., 1995).
To average the sky variations during the exposure, we got two data cubes with an exposure time of min each ( s per channel). These data cubes were co-added leading to a total exposure time of min. For calibration we used a Ne lamp whose Å was close to the redshifted nebular wavelength. Two calibration cubes were obtained at the beginning and at the end to check the metrology.
The parabolic phase map was computed from the calibration rings in order to obtain the reference wavelength for the line profile observed inside each pixel. The instrumental and observational parameters are shown in Table 2.
| Parameter | Value |
|---|---|
| Telescope | 2.1 m (SPM) |
| Instrument | PUMA |
| Detector | Site3 CCD |
| Detector size (pixels) | (10241024) |
| Image scale ( binning) | 1.16 ′′ |
| Scanning F-P interferometer | ET-50 |
| F-P interference order at H | 330 |
| Free spectral range at H (Å) | 19.95 |
| Spectral sampling at H (Å) | 0.41 |
| Interference filter (Å) | 6750 |
| Total exposure time (min) | 192 |
| Calibration line (Å) | 6717.043 (Ne) |
The data reduction and most of the analysis were done using the ADHOCw111http://www.oamp.fr/ adhoc/ developped by J. Boulesteix. software. Standard corrections were done on each of the cubes: removal of cosmic rays and bias subtraction. In this case the object cubes do not show a significant night sky continuum or OH sky lines pattern. No spatial nor spectral smoothing was applied to the data. Through the scanning process, we obtained for each pixel a flux value at each of the 48 velocity channels. The velocity profile found along the scanning process contains information about the monochromatic emission (H) and the continuum emission of the object. The continuum image computation was done considering the mean of channels with lowest intensities. For the H image, the H line intensity was obtained by adding those channels (from 17 to 30) of the wavelength data cube for which the diffuse bridge emission was stronger. The seeing of the H image is and the signal to noise ratio . The velocity maps were computed using the barycenter of the H velocity profile at each pixel. We mask the velocity field excluding a rectangular area which contains the part of the radial velocity map corresponding to KPG 390. Then we superimpose on the resulting velocity field the radial velocity profiles and delete every pixel that shows too low signal to noise ratio. In addition, we build the FWHM map by fitting Gaussians to every pixels of the wavelength data cube.
3 Results
In this section we present the analysis of H images and velocity fields of the KPG 390, and describe the obtained rotation curves.
3.1 H image
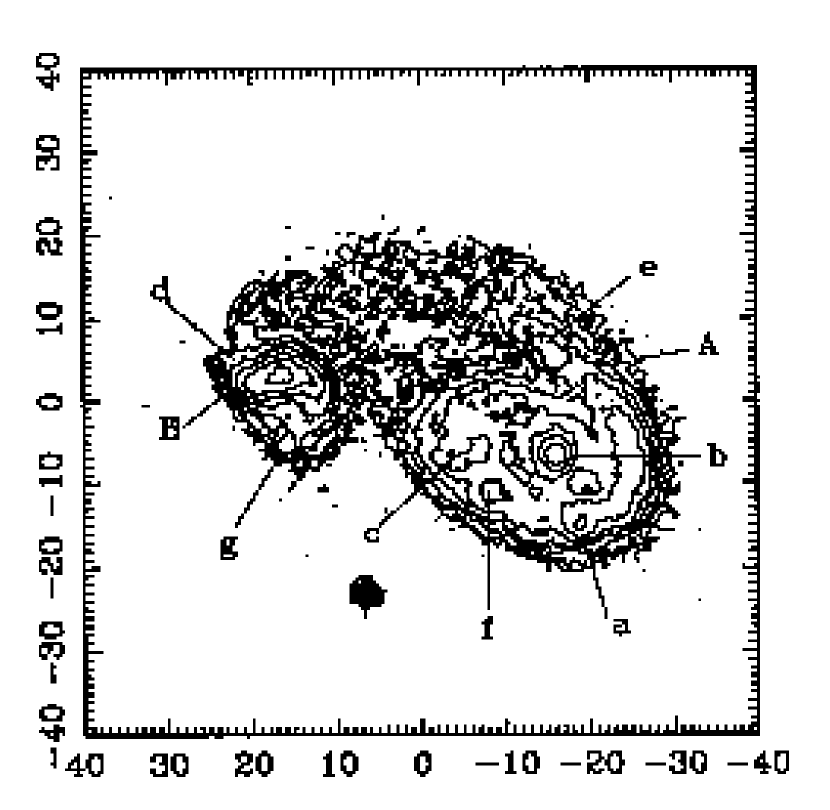
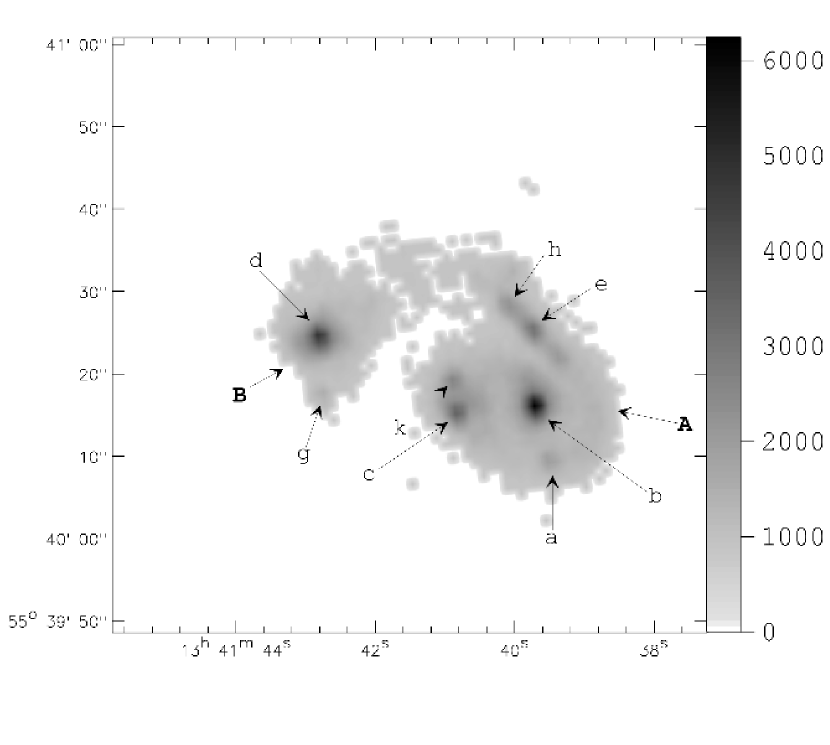
Figure 3 shows the H image of the pair KPG 390 obtained from our FP interferograms, as described in Sect. 2. We compare this map with the image by Mazzarella & Boroson (1993) (their Fig.1)222Reproduced by permission of the AAS.. Those authors present contour diagrams of B band images and find at least five giant HII regions, named with small case letters a, c, e, f and g. The letters d and b refer to the nuclei of the two components. In our monochromatic map at least six giant HII regions are clearly visible, and four of these regions coincide with zones g, c, a and e of Mazzarella & Boroson (1993). The giant HII region f is not visible in our map, but there are other two giant HII regions that are missing in the map of those authors (k and h respectively in Fig. 3). In the presented monochromatic map the nuclei of the two components are clearly visible, named with the same convention of Mazzarella & Boroson (1993). Moreover, the region between the two components of the pair is also present in our image. This region is also visible in the B band contour of Mazzarella & Boroson (1993). In the right panel of Fig. 3, in the northeastern side of the primary component of the pair, we see clearly the bridge component between the two galaxies probably induced by the interaction. The bridge begins at the end of the spiral arm of NGC 5278 where the brighter HII regions in the arm of NGC 5278 totally disappear and the H emission changes into fainter diffuse emission. The bridge region ends in the proximity of the north-western part of the disk of NGC 5279.
3.2 Velocity fields
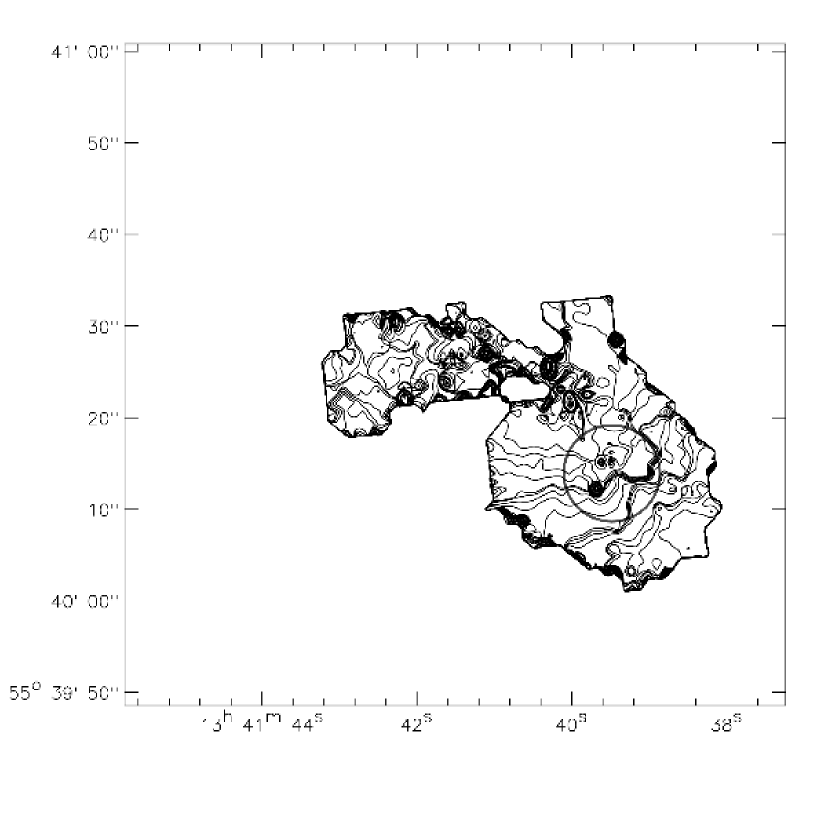
The total velocity field of KPG 390 with each component of the pair and the bridge, is shown in Fig. 4 with H isophotes superposed. The outer isophote clearly shows a common envelope enclosing both galaxies.
The velocity field is far from regular and quite distorted as one can see in the isovelocity contours map shown in the right panel of Fig. 4. In the disk of NGC 5278 the radial velocity values are in the range km s-1. On the other hand, inside the disk region of NGC 5279 the radial velocity values are in the range ( km s-1). For NGC 5279 the mean radial velocity value is of km s-1. The radial velocity values in the bright arm region of the primary galaxy (north side of NGC 5278) are in the range km s-1. In this zone the velocity profiles are slightly broader than those in the disk of NGC 5278.
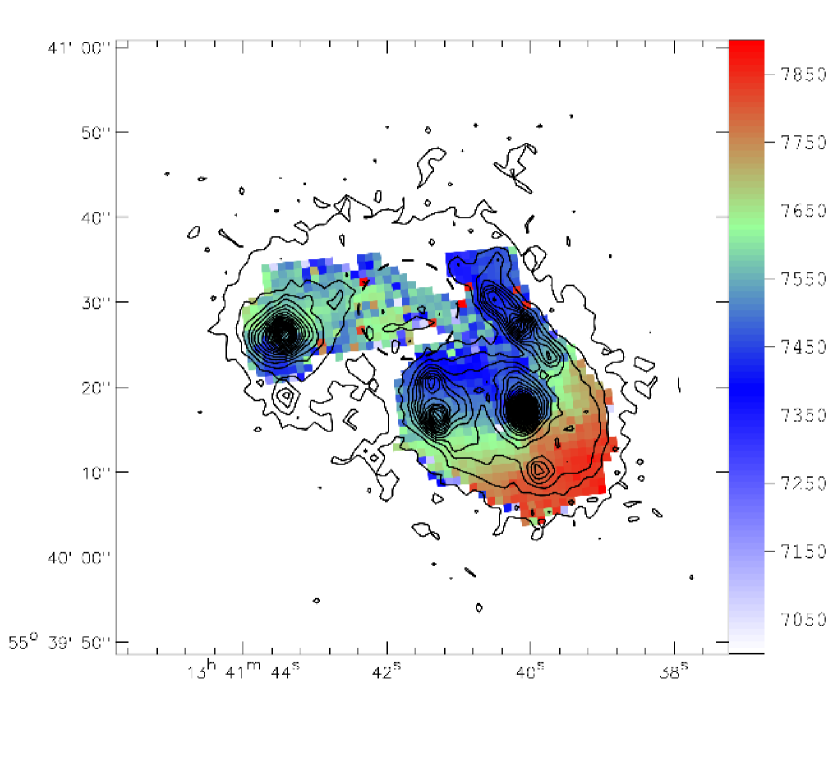
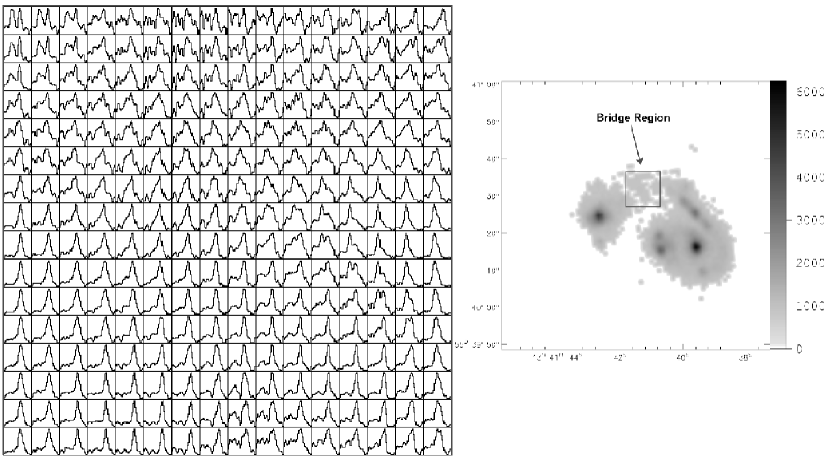
In the bridge region indicated by a dash circle in Fig. 4, the radial velocity profiles are double, or distorted, and the kinematics is more complicated. Such profiles shown in Fig. 5 (region inside the square) have a main radial velocity component and a faint secondary one. In this figure the north part shows profiles with lower signal–to–noise ratio, whereas in the south part the profiles have higher signal to noise ratio. The mean radial velocity of the brightest peak in the double profiles of the bridge region is km s-1, which is close to the mean systemic velocity of both galaxies. The faintest velocity component (at km s-1) could be associated with an extended gas outflow due to the interaction. This outflow would be also responsible for the zone of peculiar velocities discussed in the next section.
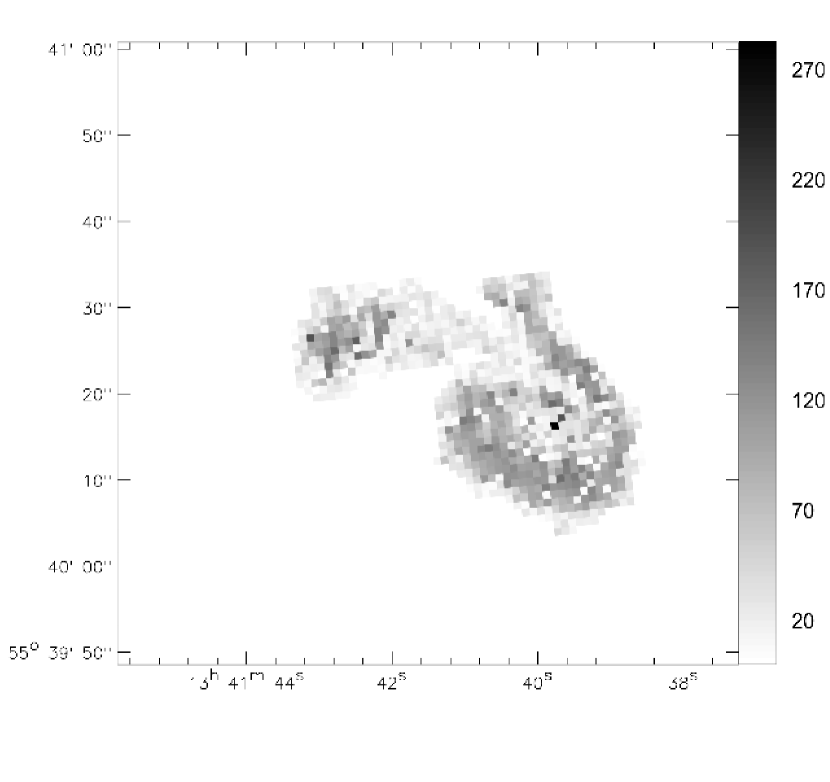
We also present dispersion velocity map obtained from FWHM map in Fig. 6. The map shows that wider profiles are concentrated in the inner disk of both galaxies and along the spiral arms of NGC 5278. In the bridge region the FWHM is smaller, contrary to the broadening that is expected as a result of interaction.
Summarizing, we conclude that there is a transference of material between the two components of the pair, indicatating the ongoing interacion process.
3.3 Rotation curves
Following Fuentes-Carrera et al. (2002, 2004) we obtain the rotation curve of each galaxy. The rotation curves were obtained from the corresponding velocity fields considering the pixels within a given angular sector along the major axis. The main caution is to exclude the spurious pixels near the major axis leading to a strong dispersion of the points of the rotation curve. The exclusion of those points guarantee us the symmetry of both sides of the rotation curve. We can see from the velocity fields that the inner parts of these two galaxies are not strongly perturbed by the interaction process. This is true at least up to a certain radius. In the case of NGC 5278 this radius is kpc () and for NGC 5279 it is kpc (). Thus, we can accurately determine the rotation curve of both galaxies considering a region of the velocity field within a sector of a specified angle inside these radii.
3.3.1 NGC 5278
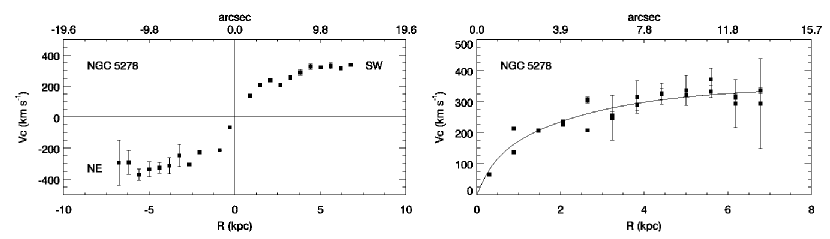
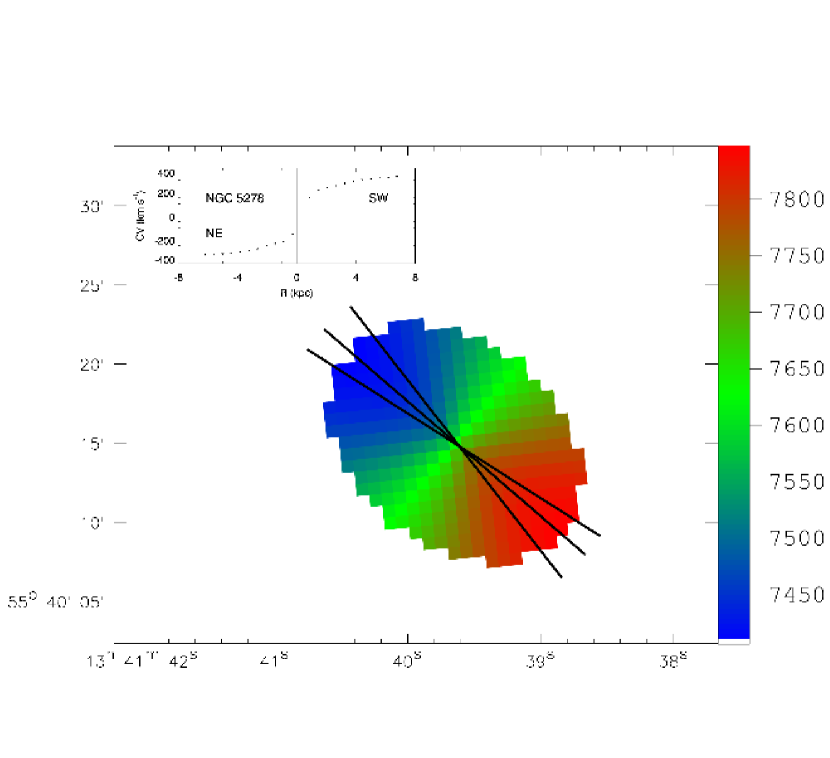
The rotation curve of NGC 5278 was obtained with pixels in the velocity field within an angular sector of around the galaxy major axis. The photometric center of this galaxy is the position of the brightest pixel in the continuum map. The physical coordinates of the photometric center are R.A. and Dec.. The kinematic center, derived as the position around the photometric center at which the scatter in rotation curve is minimized, is R.A. and Dec.. The kinematic center used to compute the rotation curve of this galaxy matches the photometric center within . We compare the kinematical parameters for this galaxy with those given in the literature. The kinematic parameters that give us the most symmetric, smooth, and low-scattered curve inside a radius of are P.A., i , and km s-1. Comparing the values of the kinematic parameters with values found in the LEDA database (see Table 1) we notice that they differ. In this database the P.A. value is of , the inclination with respect to the plane of the sky is of which is almost the same value we find, and the systemic velocity is km s-1. These discrepancies are principally due to the different methods used to determine these parameters (photometric methods in the case of inclination and position angle and slit spectroscopy methods in the case of systemic velocity).
The rotation curve shown in Fig. 7 extends only up to kpc (equivalent to ), because after this point the scatter is so large that the results are not reliable. As one can see the rotation curve is rather symmetric, has low scatter, and rises rapidly till R kpc (), reaching the velocity of km s-1. After this point the curve slowly reaches the maximum rotation velocity of km s-1 at R kpc (). The latter two points show a slow decay to km s-1.
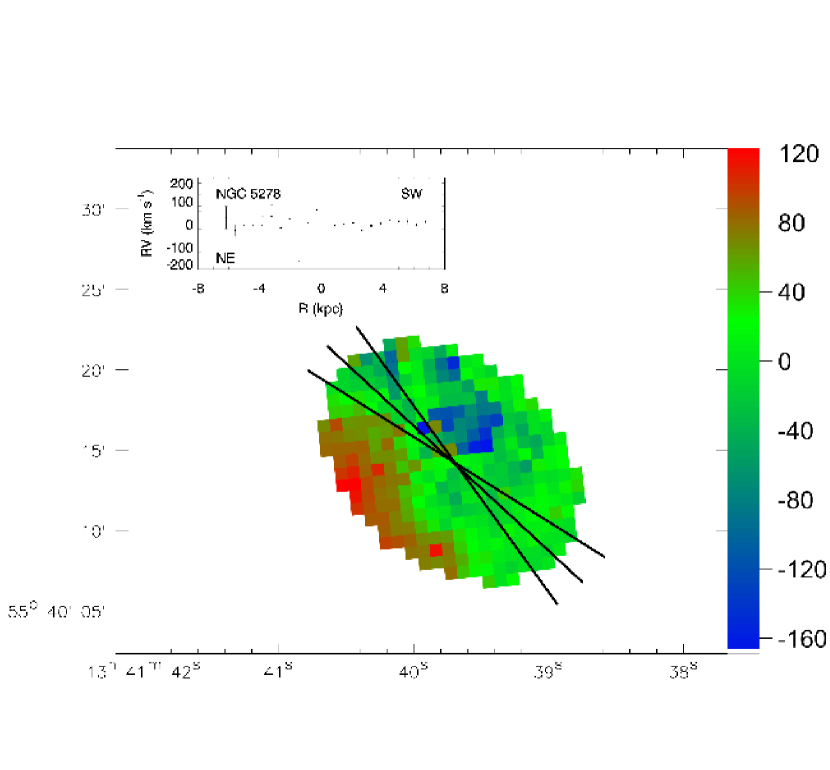
In order to investigate the peculiar velocities in the disk of NGC 5278, we constructed an artificial velocity field using the fit to the averaged rotation curve shown in Fig. 7. Then we subtracted the created field from the observed one, and obtain the residual velocity field. The resultant fields are shown in Fig. 8. The synthetic velocity field shown in the left panel of Fig. 8, was limited by the extension of the rotation curve, and does not cover the entire velocity field of NGC 5278. The inset shows the rotation curve obtained within the same angular sector as the rotation curve in Fig. 7.
The residual velocities shown in the right panel of Fig. 8 are quite small, except for a point with km s-1 which belongs to a strongly perturbed region located to the north of the disk (the inset of Fig. 8). In the rotation curve fit shown in Fig. 7 this point was not included.
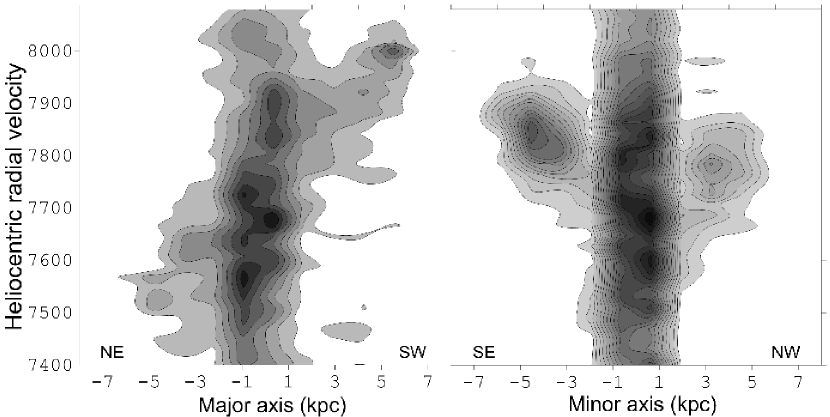
The position velocity diagrams (PVDs) extracted along the major and minor kinematic axes of NGC 5278 bring information about the symmetry of the disk. As shown in Fig. 9 the PVD along the major axis resembles the shape of the rotation curve. However, the distribution of the H intensity is not symmetric, being fainter in the NE side. On the contrary, the PVD along the minor axis is strongly asymmetric showing a bright region on the SE, and a fainter region on the NW. Such asymmetries are usually associated with radial motions of the gas inwards or outwards. The bright region on the SE, corresponding to southern spiral arm, differs by km s-1 from the NW side. These regions reflect the zones of large residuals observed in Fig. 8. We also extracted PVDs parallel to the minor axis at positions kpc from the kinematic center and found a similar asymmetry in velocity.
3.3.2 NGC 5279
The brightest pixel of NGC 5279 in our continuum map has coordinates: R.A. and Dec.. The coordinates of the kinematical center are R.A. and Dec.. The kinematic center used to obtain the rotation curve matches the photometric center within . The kinematic parameters that reduce significantly the asymmetry and scatter in the rotation curve were in this case: P.A., and km s-1.
As in the case of NGC 5278 we compare the P.A. of the major axis, the inclination and the systemic velocity with the values of LEDA and NED database. According to LEDA the P.A. and the inclination is and the NED database gives for the systemic velocity km s-1. From these data we see that the major discrepancies with our results are in the values of P.A. and inclination. In Table 1 we compare our results and the parameters given in the literature.
In order to minimize the asymmetry and scatter within a radius of in the rotation curve of NGC 5279, we choose an angular sector of around the major axis of the galaxy. Figure 10 presents the rotation curve of NGC 5279: as an approaching (NW) and a receding (SE) side, and the superposition of both. From Fig. 10 it is clear that the rotation curve of NGC 5279 has a very unusual behavior. Due to the lack of data points it was impossible to minimize the scattering and asymmetries of the rotation curve. A high asymmetry of both parts of the rotation curve did not allow to make a reliable fit, so we discuss them separately.
The approaching part of the rotation curve reaches the maximum velocity of km s-1 at radius of . Here the velocity is of km s-1. It is impossible to say if there is an actual decrease of the rotation velocity because after the radius of we have no points available. A similar behavior is observed in the receding part of the rotation curve which reaches the velocity km s-1 at . After this point the curve presents a decrease up to zero at the radius , and even shows the change of direction of the rotation. Beyond this radius the determination of the rotation curve is not possible due to high data scattering.
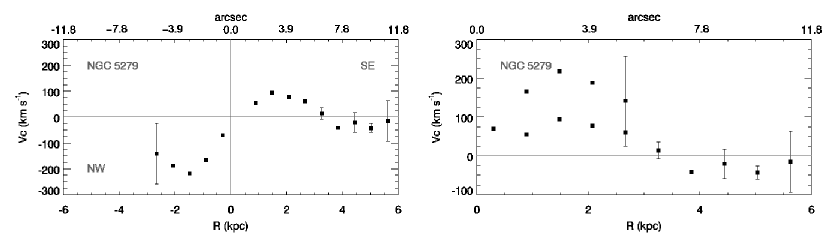
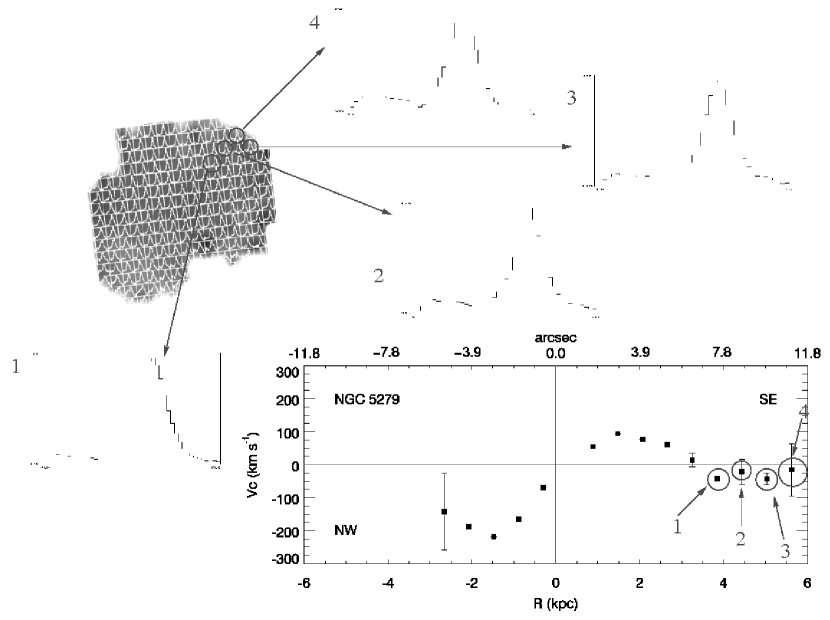
It is clear that the behavior of this side is very unusual. In the receding half of the RC there are four points that are lower than zero. The first is at r and has a rotational velocity of km s-1. The second point is at r with a rotational velocity of km s-1. The third point is at r and its rotational velocity is km s-1. The fourth point is at r and its rotational velocity is km s-1. We identify the regions corresponding to these four points in the velocity field of NGC 5279 shown in Fig. 11 and we have not found any evidence of double profiles nor any other anomalous issue that could help explain the discrepancy in the velocities of these regions. The superposition of the H image and the velocity field of NGC 5279 helps us realize that these regions belong to the external part of the disk of this galaxy. In this zone the material rotating around the NGC 5279 is more influenced by the bridge region between the two galaxies than by the inner part of the disk of NGC 5279. A possible explanation is that material of NGC 5279 is dragging along the bridge between the two galaxies in opposite direction. The interaction can explain the observed high degree of non-axisymmetry, seen in the superposition of the approaching and receding side of the rotation curve of NGC 5279 in Fig. 10.
The asymmetry of the rotation curve did not allowed us to perform a detailed analysis of the velocity field of NGC 5279.
4 Mass estimates using dynamical analysis
A range of possible masses was computed for each galaxy of this pair using an estimate described by Lequeux (1983). This estimation consists in the calculation of the mass up to a certain radius where the rotation velocity has been measured. For spiral galaxies, is in the range , the coefficient whose limit values stand for the case of galaxies dominated by a flat disk or a massive spherical halo, respectively. For NGC 5278 the maximum velocity of km s-1 is reached at the radius of R equivalent to kpc. For this galaxy the mass in the case of a flat disk is M M⊙, where M1 indicates the mass of the primary galaxy. If we consider the spherical case, the mass is MM⊙. For NGC 5279 the maximum velocity of km s-1 is achieved at R equivalent to kpc. For this galaxy the mass considering the flat disk case is M M⊙ and in the spherical case is M M⊙, where M2 indicates the mass of the secondary galaxy. One should note also, that the rotation curve is very unusual in this case, a fact that may influence significantly the determination of the mass.
A second mass estimate is obtained using the relation of Karachentsev & Myneva (1984) to compute the mass of the pair from their orbital motion, assuming a circular orbit.
| (1) |
where is the difference between the systemic velocities of the galaxies, is the projected separation between the nucleus of each galaxy, is the gravitational constant, and is the mean value of the projection factor for circular motion of the members of the pair and isotropic orientation of the orbits. For KPG 390 we have km s-1 and kpc. Assuming that corresponds to a lower limit value for the orbital motion of the pair, we obtain M⊙. This is less than the values obtained for M1, following the Lequeux method. Moreover, the sum of the individual masses of galaxies in the spherical case is M⊙ while in the flat disk case is M⊙. In both cases MMsum and the ratios between these values is MM in the spherical case and MM in the disk flat case. Consequently, the orbital mass method based on statistical grounds does not allow an accurate estimation of the masses. On the other hand, the Lequeux estimation is limited by the radial range adopted in the calculation of the galaxy mass. Thus, none of the above approaches allows us a precise mass estimation.
5 Mass computation from rotation curve decomposition of NGC 5278
In order to accomplish the rotation curve decomposition of NGC 5278, we consider that the galaxy has two components that contribute to the rotation curve: an exponential disk and a massive dark matter (DM) halo. The disk was assumed to be thin and not truncated with an exponential density distribution (Freeman, 1970) expressed by the relation:
| (2) |
where is the surface density of the disk, is the central surface density and is the scale length of the disk.
Photometric observations provide the surface brightness profiles from which we can obtain the central surface brightness, , in magnitude units and the disk scale lenght in kpc. In order to transform these observable parameters to mass density distribution, it is assumed that the ratio is uniform and constant over the disk. In principle, the disk could be known from photometric and spectroscopic observations of the disk which allow us to know the colors, or to perform a population synthesis analysis.
We tested three different types of DM halos: Hernquist halo (Hernquist, 1990), Navarro, Frenk White halo (NFW) (Navarro et al., 1996), and spherical pseudo-isothermal halo. The density profile of the Hernquist halo is given by:
| (3) |
where is the total mass and is a length scale (Hernquist, 1990). The density profile of the NFW halo is (Navarro et al., 1996):
| (4) |
where is a virial radius and is the critical density, the Hubble constant =72 km s-1 Mpc-1, and are dimensionless parameters which are mutually related. The mass of the halo is determined by with the relation . The spherical pseudo-isothermal halo has a density profile given by the relationship:
| (5) |
where is the central density of the halo, and the core radius of the halo.
To accomplish the rotation curve decomposition we fit the rough rotation curve data using an exponential function (Fig. 7). Then we use this fit to perform the disk-halo decomposition. We perform the rotation curve decomposition only for NGC 5278 using the photometric data given by Mazzarella & Boroson (1993) and the LEDA333http://leda.univ-lyon1.fr database (Paturel et al., 2003). Mazzarella & Boroson (1993) present the values of the Holmberg radius of the stellar disk of the galaxy, the mean B-band surface brightness inside this radius, and the apparent magnitude in the B-band for both galaxies. The LEDA database provides the length of the projected major axis of the galaxy at the isophotal level , and the corresponding B-band surface brightness. From these two relations we obtain the central surface brightness, mag arcsec-2 and disk scale length of kpc. Note, however, that the latter value is greater than the extension of the rotation curve shown in Fig. 7, so we treat it as an upper limit. Since for this galaxy we do not have any robust restiction on the luminous mass distribution, we vary the disk scale radius kpc and the mass to luminosity ratio . The halo mass and the halo scale length are in the range M⊙ and kpc, respectively.
In order to carry out the rotation curve fit we use the IDL MPFIT444http://purl.com/net/mpfit package (Markwardt, 2009)555The original fortran package that implements Levemberg-Marquardt method was developed by J. Moré and collaborators at Argonne National Laboratories (More, 1978). As an input to the routine we pass the fit to the rotation curve of NGC 5278 and a weights vector, computed as an inverse of squared standard deviations. The outputs are the best fit model and the normalized by the number of degrees of freedom and the corresponding weights.
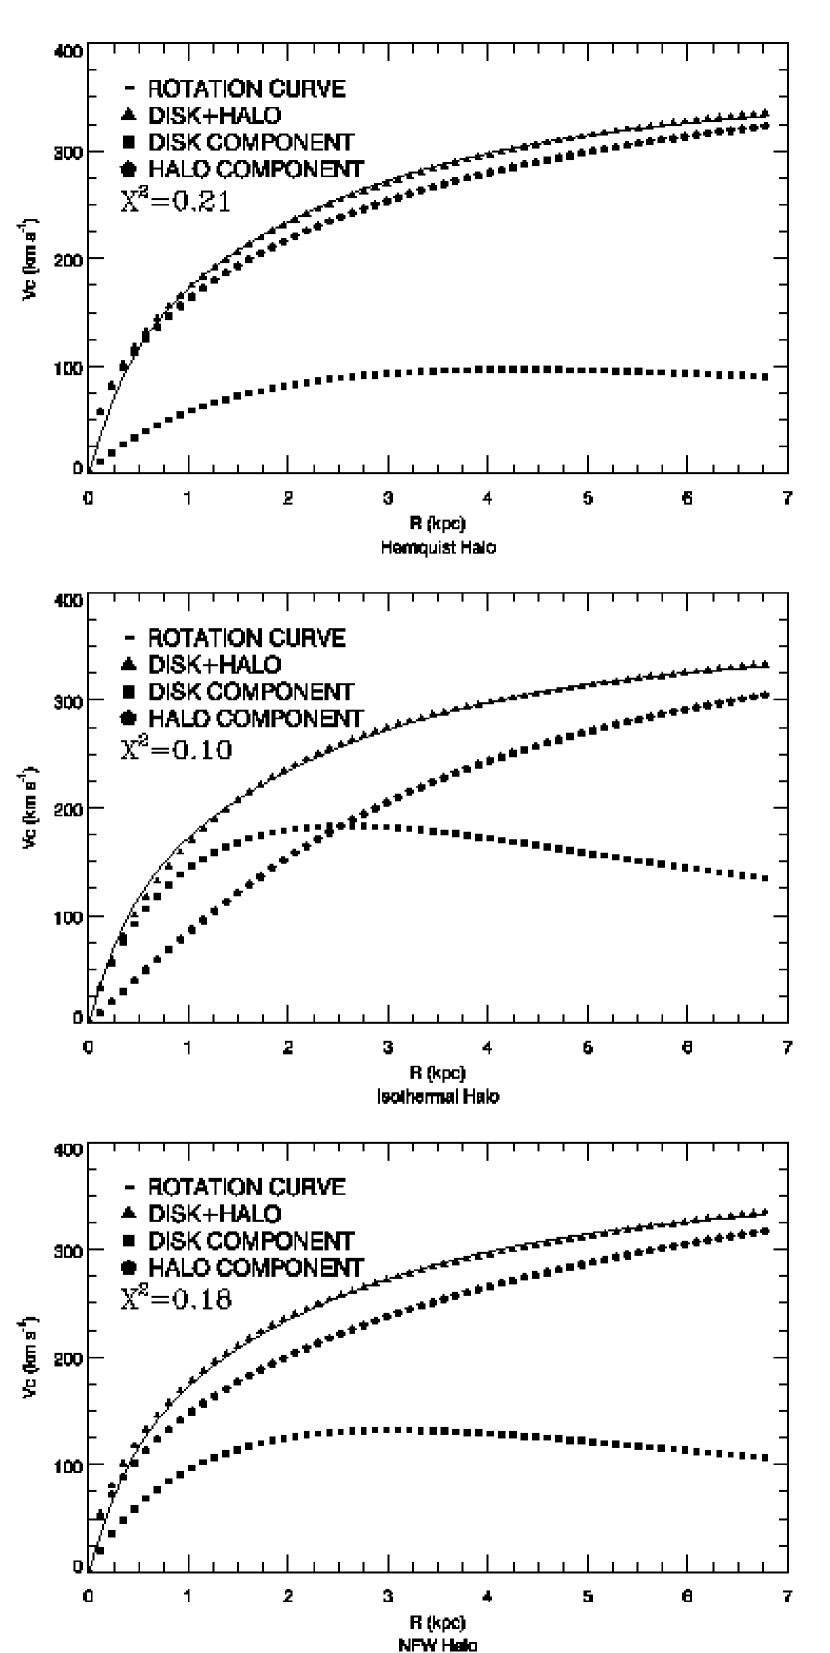
The rotation curve of NGC 5278 can be well fitted with spherical pseudo-isothermal halo, Hernquist halo and NFW halo (Fig. 12). The results obtained are summarized in Table 3.
For pseudo-isothermal halo the best fit was obtained with a mass to light ratio of and the disk mass M⊙. In the case of the Hernquist halo we choose , which corresponds to the disk mass M⊙. For the Navarro et al. (1996) halo (NFW halo) the ratio was of and the disk mass of M⊙.
The pseudo-isothermal mass is in agreement with the dynamical mass estimate of Section 4 and may be considered as a lower limit to the mass of NGC 5278. The second and the third value do not agree with the first estimation of masses and can be considered as upper limits to the mass of NGC 5278. The three fits roughly reproduce the observed rotation curve while the pseudo-isothermal halo requires a dark matter amount ten times smaller than the other two halo models. In all three models the halo component dominates the mass of NGC 5278.
In order to corroborate our results we also estimate the dynamical mass of NGC 5278 using the Tully-Fisher relation (Tully & Fisher, 1977). This relation can be written in the following form M, where km s-1 is the maximum circular velocity, G is the gravitational constant, is the speed of light and is the Hubble constant at current time. We found a dynamical mass of M⊙. This value agrees with the dynamical mass estimate in the case of a flat disk (Section 4).
In the course of the fitting process, we have also explored the effects of having as a third component a buldge with the Hernquist density profile. However, the bulge mass and the length scale in all three cases considered below were too small ( and kpc for spherical isothermal halo and and kpc for Hernquist halo and NFW halo) to justify the necessity of a bulge component in total mass estimation.
The total mass obtained only with our kinematical data does not ensure the actual mass distribution of NGC 5278, because of the small range of H rotation curve, which reflects only the dynamic of the inner disk. Photometric, spectroscopic and population synthesis studies are required to fix the disk ratio and thus discriminate between the different density distributions of DM halos as well as the ratio between luminous and dark matter in this galaxy.
Concerning NGC 5279, we were unable to make a reasonable fit to the rotation curve, and consequently, estimate its mass, due to its unusual shape and lack of resolution.
| Rotation curve mass | Pseudo-isothermalaaMaximum Disk | Hernquist | NFW |
| Disk component (M⊙) | 2.421010 | 1.131010 | 1.51010 |
| Disk lenght scale (kpc) | 1.2 | 2.0 | 1.42 |
| Disk M/L | 2.8 | 1.3 | 1.6 |
| Halo component (M⊙) | 1.91011 | 2.11012 | 6.31012 |
| Halo lenght scale (kpc) | 2.8 | 17.7 | 16.8 |
| Total Mass (M⊙) | 2.11011 | 2.11012 | 6.31012 |
| bbNormalized by degrees of freedom. | 0.12 | 0.53 | 0.54 |
6 Discussion
To study in detail the kinematic structure of a particular isolated pair of galaxies it is very important to have two dimensional velocity fields for each pair component. The kinematic and dynamical analysis allows us to obtain useful information about the transference of material between the two galaxies as well as about the principal mass components of the system.
The procedure of disk-halo decomposition of a given rotation curve is based on a criterion used to decide how much mass has to be assigned to the luminous components and with what distribution. In the case of Sc galaxies that do not involve a significant bulge component, this problem reduces to fit the observed rotation curve only with two contributions: a disk component and a halo component. The profile of the contribution of the rotation curve due to the disk is, in principle, fixed in shape by the observed photometry, while its scale is controlled by the mass–to–light ratio assigned to the disk. The difference between the observed rotation curve and the disk contribution is attributed to the presence of unseen matter i.e. a dark halo component. There are distinct solutions to the problem of modelling the mass distribution of spiral galaxies. A conservative effort is to minimize the role of unseen matter that leads to the choice of the maximum-disk solution for the disk-halo decomposition (van Albada et al., 1985). From a dynamical point of view, other solutions, with a smaller value for the disk mass–to–light ratio and a heavier dark halo are also viable. What regards the luminous part of the rotation curve of NGC 5278, this galaxy is classified as an Sb galaxy, thus, in principle it could have a significant bulge contribution, but with our analysis we demonstrate that the bulge component is too small to need to be taken into account in our decomposition. On the other hand, the disk contribution is partially set by the available photometric data and in the maximum-disk case (pseudo-isothermal halo) is of fundamental importance for the mass distribution. As what concerns the dark component of NGC 5278 we can notice that the difference in the halo mass between pseudo-isothermal and Hernquist or NFW halo components is a factor of ten in the mass. This could be partially due to the choice of the maximum-disk component in the case of pseudo-isothermal halo. The Hernquist and NFW halo components have a very similar behaviour as expected. From our RC fits, there is no reason to think that one of the three fits represents better than the others the mass distribution of NGC 5278. The rotation curve decomposition performed here is only a first attempt at modelling the mass distribution of NGC 5278 that should be completed with at least a detailed photometry of this galaxy.
On the other hand, this kinematic study sheds light on the geometry of the galaxy encounter by determining univocally the real orientation in the sky of the galaxy members, as well as the kind of spiral arms they possess. This later point is not irrelevant in the case of interacting systems where a possibility of having leading spiral arms is open. Indeed, even if leading spiral arms in galaxies are a very uncommon phenomenon, the only examples where are found are interacting systems. Let us revise problem of leading or trailing arms. de Vaucouleurs (1958), in a seminal paper, gave a series of criteria in order to determine the true orientation of a galaxy in space and the kind of spiral arms it has. He also established that in a sample of spiral galaxies the whole trial had trailing arms, concluding that the spiral arms are all trailing, at least for galaxies considered isolated. However, this last issue has been questioned and some authors have revised this important conclusion of the de Vaucouleurs work. The first systematic study on the topic was done by Pasha & Smirnov (1982) and Pasha (1985). These authors from a sample of 200 spiral galaxies found 4 leading arm galaxy candidates. Sharp & Keel (1985) have shown that one of this four leading arm candidates (in NGC 5395) is not leading. The other three candidates are highly dubious cases regarding orientation and existence of arms (NGC 4490) and their tilt (NGC 3786 and NGC 5426). Byrd et al. (2008) demonstrate that NGC 4622 has leading arms since two pairs of detected arms have the opposite sense with each other. Grouchy et al. (2008) detected another example of leading spiral structure in ESO 297-27. Thus, as one can see, there are not so many cases of leading spiral arms in the literature. Following Sharp & Keel (1985) there is a criterion that determines if any particular spiral galaxy has trailing or leading arms. This criterion is based on three main clues (receding-approaching side, direction of spiral arms and the tilt of the galaxy, i. e., which side is closer to observer).
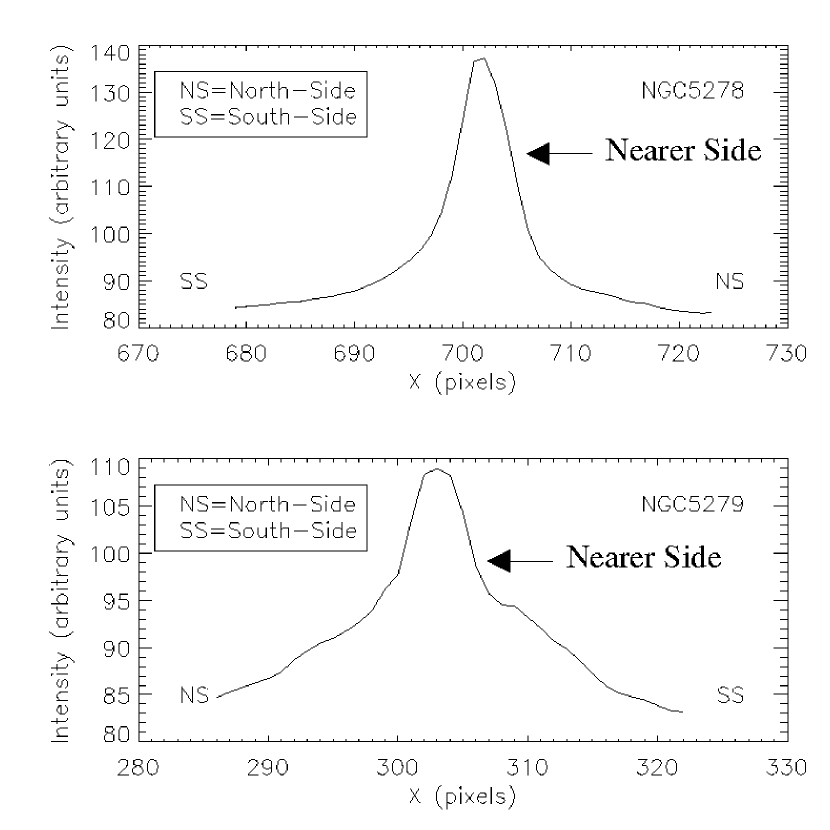
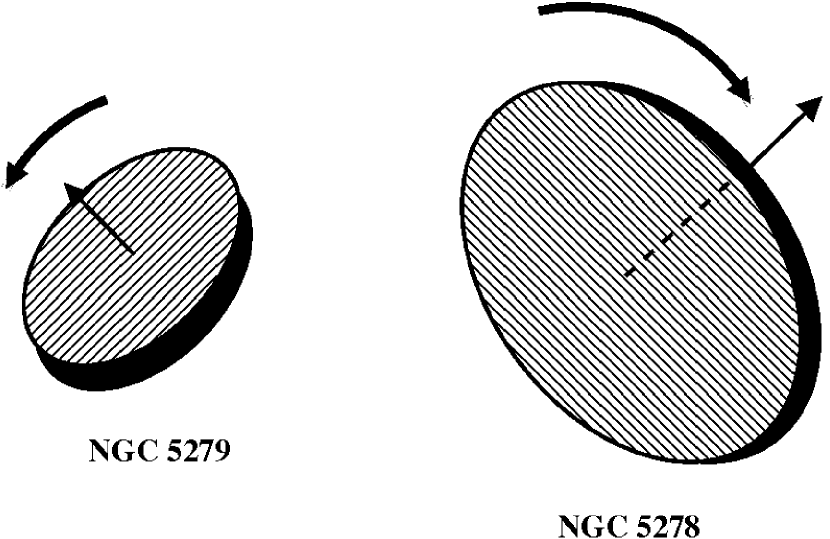
In our particular case, we have both the kinematic information in order to establish which side of the galaxy is receding and which side approaching, as well as very conspicuous morphological aspects such as well defined spiral arm patterns and the presence of dust lanes in both galaxy members running near the galaxy nuclei. This last issue will be used in what follows in two main ways: 1) we will suspect that the nearest side of the galaxy is the side hosting the dust lane and, 2) we will check it by getting an intensity profile of the galactic nucleus along the minor axis. In this kind of profiles, the nearest side is the steepest one (because of the presence of the dust lane). In the case of NGC 5278, the receding radial velocities are in the south-western part, while the approaching radial velocities are at the north-eastern side. From Fig. 2 (bottom panel) it is clear that the arms of NGC 5278 point in anti-clockwise direction and the dust lane is located at the concave side of the bulge, thus the northern side is the nearest. This fact is confirmed by the profile extracted along the kinematic minor axis of NGC 5278 (see Fig. 13). From these figures and the above criteria we have decided that NGC 5278 is a trailing spiral because the sense of rotation is opposite to the direction of the arms. We were able to apply similar arguments to NGC 5279. In this case the receding radial velocities are at the north-eastern side of the galaxy and the approaching radial velocities are at the south-western part. The arms of NGC 5279 point in clockwise direction and the nearest side is the southern side. As in the case of NGC 5278 this fact is confirmed by the profile extracted along the kinematic minor axis of NGC 5279 (see Fig. 13) (Väisänen et al., 2008). We can conclude that NGC 5279 is a trailing spiral also because the sense of rotation is opposite to the direction of the arms.
A scheme of 3D orientation of KPG 390 derived from our kinematic analysis is shown in Fig. 14.
We estimate a lower limit to the time scale of interaction using the ratio of the projected separation between both galaxies ( kpc) (Karachentsev, 1972) and the difference in the systemic velocities of the components of the pair ( km s-1). The result was of yrs. This fact agrees very well with the morphology of the pair. In fact, NGC 5279 do not appear very distorted by the interaction and NGC 5278 shows some signs of an undergoing interaction process. This galaxy presents an extended spiral arm toward the companion galaxy and between the two galaxies one can see a bridge-like structure probably generated by the interaction process. From the age of interaction we can say that this is an early-stage interaction.
We do not know if the bar in the secondary galaxy was due to the interaction process. The origin of bars in interacting disk galaxies remains unclear. Though there have been works showing statistical evidence that companions trigger the formation of bars (Elmegreen et al., 1990; Márquez et al., 2000), bars can be formed as a result of disk instabilities regardless of their environment (van den Bergh, 2002). Perhaps this bar existed before the interaction process took place. Realistic numerical simulations taking into account the kinematic restrictions are needed to establish the extent to which the interacting process is related to the formation of a possible bar in NGC 5279.
Another interesting feature is the bridge-like structure that is very dim in our observations. The fact that the bridge region emits weak diffuse line emission enforce the idea that this structure is a consequence of the interaction process and that the transfer of material is effective in this zone. This area shows double velocity profiles, with velocities in the range of km s-1. Perhaps the transfer of material between the two galaxies of the pair might generate such double profiles. On the other hand, strong motions due to the nearness of the arm of NGC 5278 might alter the velocity profiles in the bridge area and originate double and broader profiles, due to a second velocity component related to the transfer of gas from one galaxy to the other. As pointed out in Section 3.2, the radial velocity values of the double peaks in the bridge region are different from the radial velocity values belonging to the disks of both components of KPG 390.
Regarding non-circular motions, the residual velocity map for NGC 5278 reveal large values in the northern region of this galaxy. The large absolute values of the residual velocities seen in the north-western region and also along the inner part of the south-eastern arm could indicate the response of the gas to the passage of the companion. This can also be noticed from the PVDs extracted along the minor axis. In this sense, the non-typical rotation curve of the companion, NGC 5279, could be a result of interaction. However, such a difference could also be associated with an intrinsic asymmetry of the disk such as a warp. We neither can exclude the possibility of an artifact in the determination of the rotation curve, given the small number of points and the large dispersion associated to this curve.
The results of this work is worth to compare with a widely studied interacting grand-design system M51. Salo & Laurikainen (2000) with N-body simulations were able to match the observed morphological and kinematical data and derive the orbital parameters and the interaction scenario. They explained the formation of the spiral structure of the main galaxy, tidal tail and bridge as a result of multiple encounters. In a previous study of a similar M51-type system ARP 86 by the same authors, it is shown that the material transfer between the components could explain the large activity of the companion (Salo & Laurikainen, 1993). They conclude that such interactions produce an open spiral structure of the primary galaxy, and the bridge tends to be directed to the companion. The multiple passage scenario discussed in Salo & Laurikainen (2000) produces significant peculiar velocities out of the plane of the disk, leading to disturbances in the rotation curve, similar to those observed for NGC 5279. According to separate studies aimed at the investigation of evolution of such asymmetries in rotation curves (Pedrosa et al., 2008, and references therein), the perturbations are short–lived ( Gyr), suggesting that the encounter for KPG 390 took place within this period.
It is very difficult to obtain a clear picture of the process of interaction in this pair of galaxies only from the kinematical analysis. We require more information about the stellar component by means of photometry, spectroscopy and population synthesis models. We also need a detailed dynamical analysis, that would encompass the knowledge of the mass components of both galaxies of KPG 390 and numerical simulations of the pair. In particular, numerical simulations will allow us to have the time evolution of the interaction process. By comparing the results of numerical simulations with observations we will gain some insight about the present stage of the interaction process. Surely, this study does not dissipate all doubts about this pair but may be considered like a valid approach to better understand this kind of phenomena.
7 Conclusions
In this article we presented Fabry-Perot observations of the isolated pair of galaxies NGC 5278/79 (Arp 239, KPG 390) showing that for an interacting and asymmetric system it is important to have kinematic information of large portions of the galaxies participating in the interaction process. We calculate the mass of each galaxy of the pair, following several methods, and also the lower limit to the orbital mass of the pair. We perform the decomposition of the rotation curve for NGC 5278 and determine the content of dark matter of this galaxy, using different types of halos (pseudo-isothermal, Hernquist and NFW halo). According to our estimations the minimum mass ratio of NGC 5278 to NGC 5279 is .
We obtain the rotation curves for NGC 5278 and NGC 5279. From the analysis of the velocity field, we found the presence of double profiles in the bridge region and in the outer regions of both galaxies. We conclude that the presence of such features is undoubtedly connected with the interaction process. Though this seems to be a relatively early encounter, several morphological features of each galaxy were associated with the interaction process, such as the =1 mode of NGC 5278, the presence of bar in NGC 5279 and the bridge connecting the two components of the pair. We will use the kinematic information as a starting point in future numerical simulations of this pair.
References
- Abazajian (2004) Abazajian, K. e. a. 2004, AJ, 128, 502
- Adelman-McCarthy et al. (2008) Adelman-McCarthy et al. 2008, ApJS, 175, 297
- Amram et al. (2004) Amram, P., Bournaud, F., & Duc, P.-A. 2004, in Recycling Intergalactic and Interstellar Matter, edited by P.-A. Duc, J. Braine, & E. Brinks, vol. 217 of IAU Symposium, 526
- Amram et al. (1994) Amram, P., Marcelin, M., Balkowski, C., Cayatte, V., Sullivan, W. T., III, & Le Coarer, E. 1994, A&AS, 103, 5
- Amram et al. (2002) Amram, P., Mendes de Oliveira, C., Plana, H., Balkowski, C., Boulesteix, J., & Carignan, C. 2002, Ap&SS, 281, 389
- Arp (1966) Arp, H. 1966, ApJS, 14, 1
- Athanassoula (1978) Athanassoula, E. 1978, A&A, 69, 395
- Bizyaev et al. (2007) Bizyaev, D. V., Moiseev, A. V., & Vorobyov, E. I. 2007, ApJ, 662, 304
- Blais Ouellette et al. (2001) Blais Ouellette, S., Amram, P., & Carignan, C. 2001, AJ, 121, 1952
- Bosma et al. (1977) Bosma, A., van der Hulst, J. M., & Sullivan, W. T., III 1977, A&A, 57, 373
- Bushouse (1987) Bushouse, H. A. 1987, ApJ, 320, 49
- Byrd et al. (1993) Byrd, G. G., Freeman, T., & Howard, S. 1993, AJ, 105, 477
- Byrd et al. (2008) Byrd, G. G., Freeman, T., Howard, S., & Buta, R. J. 2008, AJ, 135, 408
- Byrd et al. (1989) Byrd, G. G., Thomasson, M., Donner, K. J., Sundelius, B., Huang, T. Y., & Valtonen, M. J. 1989, Celestial Mechanics, 45, 31
- Condon et al. (2002) Condon, J. J., Cotton, W. D., & Broderick, J. J. 2002, AJ, 124, 675
- Cutri & McAlary (1985) Cutri, R. M., & McAlary, C. W. 1985, ApJ, 296, 90
- de Vaucouleurs (1958) de Vaucouleurs, G. 1958, ApJ, 127, 487
- de Vaucouleurs et al. (1991) de Vaucouleurs, G., de Vaucouleurs, A., Corwin, H. G., Jr., Buta, R. J., Paturel, G., & Fouque, P. 1991, Third Reference Catalogue of Bright Galaxies (Volume 1-3, XII, 2069 pp. 7 figs.. Springer-Verlag Berlin Heidelberg New York)
- Elmegreen et al. (1990) Elmegreen, D. M., Elmegreen, B. G., & Bellin, A. D. 1990, ApJ, 364, 415
- Falco et al. (1999) Falco, E. E., Kurtz, M. J., Geller, M. J., Huchra, J. P., Peters, J., Berlind, P., Mink, D. J., Tokarz, S. P., & Elwell, B. 1999, PASP, 111, 438
- Freeman (1970) Freeman, K. C. 1970, ApJ, 160, 811
- Fuentes-Carrera et al. (2002) Fuentes-Carrera, I., Amram, P., & Rosado, M. 2002, Ap&SS, 281, 411
- Fuentes-Carrera et al. (2004) Fuentes-Carrera, I., Rosado, M., Amram, P., Dultzin-Hacyan, D., Cruz-González, I., Salo, H., Laurikainen, E., Bernal, A., Ambrocio-Cruz, P., & Le Coarer, E. 2004, A&A, 415, 451
- Fuentes-Carrera et al. (2007) Fuentes-Carrera, I., Rosado, M., Amram, P., Salo, H., & Laurikainen, E. 2007, A&A, 466, 847
- Grouchy et al. (2008) Grouchy, R. D., Buta, R., Salo, H., Laurikainen, E., & Speltincx, T. 2008, AJ, 136, 980
- Hernquist (1990) Hernquist, L. 1990, ApJ, 356, 359
- Jarrett et al. (2003) Jarrett, T. H., Chester, T., Cutri, R., Schneider, S. E., & Huchra, J. P. 2003, AJ, 125, 525
- Karachentsev (1972) Karachentsev, I. D. 1972, Astrofizicheskie Issledovaniia, Izvestiya Spetsial’noj Astrofizicheskoj Observatorii, 7, 3
- Karachentsev & Myneva (1984) Karachentsev, I. D., & Myneva, V. A. 1984, Soviet Astronomy Letters, 10, 235
- Keel (1991) Keel, W. C. 1991, ApJ, 375, L5
- Keel et al. (1985) Keel, W. C., Kennicutt, R. C., Jr., Hummel, E., & van der Hulst, J. M. 1985, AJ, 90, 708
- Klimanov & Reshetnikov (2001) Klimanov, S. A., & Reshetnikov, V. P. 2001, A&A, 378, 428
- Klimanov et al. (2002) Klimanov, S. A., Reshetnikov, V. P., & Burenkov, A. N. 2002, Astronomy Letters, 28, 579
- Kormendy & Fisher (2008) Kormendy, J., & Fisher, D. B. 2008, in Astronomical Society of the Pacific Conference Series, edited by J. G. Funes, & E. M. Corsini, vol. 396 of Astronomical Society of the Pacific Conference Series, 297
- Kormendy & Kennicutt (2004) Kormendy, J., & Kennicutt, R. C., Jr. 2004, ARA&A, 42, 603
- Lequeux (1983) Lequeux, J. 1983, A&A, 125, 394
- Liu & Kennicutt (1995) Liu, C. T., & Kennicutt, R. C., Jr. 1995, ApJ, 450, 547
- Marcelin et al. (1987) Marcelin, M., Lecoarer, E., Boulesteix, J., Georgelin, Y., & Monnet, G. 1987, A&A, 179, 101
- Markwardt (2009) Markwardt, C. B. 2009, in Astronomical Society of the Pacific Conference Series, edited by D. A. Bohlender, D. Durand, & P. Dowler, vol. 411 of Astronomical Society of the Pacific Conference Series, 251
- Márquez et al. (2000) Márquez, I., Durret, F., Masegosa, J., Moles, M., González Delgado, R. M., Marrero, I., Maza, J., Pérez, E., & Roth, M. 2000, A&A, 360, 431
- Martin et al. (2005) Martin et al. 2005, ApJ, 619, L1
- Mazzarella & Boroson (1993) Mazzarella, J. M., & Boroson, T. A. 1993, ApJS, 85, 27
- More (1978) More, J. J. 1978, The Levenberg-Marquardt algorithm: Implementation and theory, vol. 630 (Springer Berlin / Heidelberg)
- Navarro et al. (1996) Navarro, J. F., Frenk, C. S., & White, S. D. M. 1996, ApJ, 462, 563
- Nelson et al. (1998) Nelson, C., Weistrop, D., & Angione, R. 1998, in Bulletin of the American Astronomical Society, vol. 30 of Bulletin of the American Astronomical Society, 925
- Nilson (1973) Nilson, P. 1973, Nova Acta Regiae Soc. Sci. Upsaliensis Ser. V, 0
- Pasha (1985) Pasha, I. I. 1985, SvAL, 11, 1
- Pasha & Smirnov (1982) Pasha, I. I., & Smirnov, M. A. 1982, Ap&SS, 86, 215
- Paturel et al. (2000) Paturel, G., Fang, Y., Petit, C., Garnier, R., & Rousseau, J. 2000, A&AS, 146, 19
- Paturel et al. (2003) Paturel, G., Petit, C., Prugniel, P., Theureau, G., Rousseau, J., Brouty, M., Dubois, P., & Cambrésy, L. 2003, A&A, 412, 45
- Pedrosa et al. (2008) Pedrosa, S., Tissera, P. B., Fuentes-Carrera, I., & Mendes de Oliveira, C. 2008, A&A, 484, 299
- Rampazzo et al. (2005) Rampazzo, R., Plana, H., Amram, P., Bagarotto, S., Boulesteix, J., & Rosado, M. 2005, MNRAS, 356, 1177
- Reshetnikov & Klimanov (2003) Reshetnikov, V. P., & Klimanov, S. A. 2003, Astronomy Letters, 29, 429
- Rosado et al. (1995) Rosado, M., Langarica, R., Bernal, A., Cobos, F., Garfias, F., Gutierrez, L., Tejada, C., Tinoco, S., & Le Coarer, E. 1995, in Revista Mexicana de Astronomia y Astrofisica Conference Series, edited by M. Pena, & S. Kurtz, vol. 3 of Revista Mexicana de Astronomia y Astrofisica, vol. 27, 263
- Rubin et al. (1976) Rubin, V. C., Peterson, C. J., & Ford, W. K., Jr. 1976, in Bulletin of the American Astronomical Society, vol. 8 of Bulletin of the American Astronomical Society, 297
- Salo & Laurikainen (1993) Salo, H., & Laurikainen, E. 1993, ApJ, 410, 586
- Salo & Laurikainen (2000) — 2000, MNRAS, 319, 377
- Sharp & Keel (1985) Sharp, N. A., & Keel, W. C. 1985, AJ, 90, 469
- Thomasson et al. (1989) Thomasson, M., Donner, K. J., Sundelius, B., Byrd, G. G., Huang, T.-Y., & Valtonen, M. J. 1989, A&A, 211, 25
- Tully & Fisher (1977) Tully, R. B., & Fisher, J. R. 1977, A&A, 54, 661
- Turner (1976) Turner, E. L. 1976, ApJ, 208, 20
- Väisänen et al. (2008) Väisänen, P., Ryder, S., Mattila, S., & Kotilainen, J. 2008, ApJ, 689, L37
- van Albada et al. (1985) van Albada, T. S., Bahcall, J. N., Begeman, K., & Sancisi, R. 1985, ApJ, 295, 305
- van den Bergh (2002) van den Bergh, S. 2002, AJ, 124, 782
- van den Bergh et al. (2003) van den Bergh, S., Li, W., & Filippenko, A. V. 2003, PASP, 115, 1280
- Vorontsov-Velyaminov (1959) Vorontsov-Velyaminov, B. A. 1959, in ”Atlas and Catalog of Interacting Galaxies”, Sternberg Institute, Moscow State University
- Windhorst et al. (2002) Windhorst et al. 2002, ApJS, 143, 113