Observation of Supernova Remnant IC 443 with
the Fermi Large Area Telescope
Abstract
We report observation of the supernova remnant IC 443 (G189.1+3.0) with the Fermi Gamma-ray Space Telescope Large Area Telescope (LAT) in the energy band between 200 MeV and 50 GeV. IC 443 is a shell-type supernova remnant with mixed morphology located off the outer Galactic plane where high-energy emission has been detected in the X-ray, GeV and TeV gamma-ray bands. Past observations suggest IC 443 has been interacting with surrounding interstellar matter. Proximity between dense shocked molecular clouds and GeVTeV gamma-ray emission regions detected by EGRET, MAGIC and VERITAS suggests an interpretation that cosmic-ray (CR) particles are accelerated by the SNR. With the high gamma-ray statistics and broad energy coverage provided by the LAT, we accurately characterize the gamma-ray emission produced by the CRs accelerated at IC 443. The emission region is extended in the energy band with for an assumed 2-dimensional Gaussian profile and overlaps almost completely with the extended source region of VERITAS. Its centroid is displaced significantly from the known pulsar wind nebula (PWN) which suggests the PWN is not the major contributor in the present energy band. The observed spectrum changes its power-law slope continuously and continues smoothly to the MAGIC and VERITAS data points. The combined gamma-ray spectrum (200 MeV 2 TeV) is reproduced well by decays of neutral pions produced by a broken power-law proton spectrum with a break around 70 GeV.
1 Introduction
IC 443 is a well-studied supernova remnant (SNR), possessing strong molecular line emission regions that make it a case for a SNR interacting with molecular clouds. The SNR is one of the best candidates for revealing the connection among SNRs, molecular clouds and high-energy gamma-ray sources as reviewed by Torres et al. (2003).
IC 443 is located in the outer Galactic plane and listed as a core-collapse supernova remnant (SNR), G189.1+3.0, in Green’s catalog (Green 2004). The SNR has an angular extent of 45′ in the radio with a complex shape consisting of two half-shells with different radii (Shells A and B) (e.g., Fesen & Kirshner 1980; Braun & Strom 1986a, b; Petre et al. 1988; Furst et al. 1990; Leahy 2004, and references therein). Its age is uncertain: some analyses indicate a young age ( ky) (e.g., Petre et al. 1988; Troja et al. 2008) but others indicate that it is older ( ky) (e.g., Lozinskaya 1981; Chevalier 1999; Olbert et al. 2001; Gaensler et al. 2006; Bykov et al. 2008; Lee et al. 2008). Its distance has not been measured directly but is assumed to be kpc, the distance to the Gem OB1 association to which the SNR belongs (e.g., Woltjer 1972; Olbert et al. 2001; Welsh & Sallmen 2003; Gaensler et al. 2006). A pulsar wind nebula (PWN), CXOU J061705.3+222127, has been found in the southern periphery of the SNR but its association with the SNR has not yet been firmly established (Keohane et al. 1997; Olbert et al. 2001; Bocchino & Bykov 2001; Leahy 2004; Gaensler et al. 2006; Troja et al. 2008). To this day pulsation has not been reported at the position of the putative pulsar.
A general picture has been drawn from past observations and analyses that a variety of dynamical processes are taking place in the complex structure of IC 443 (e.g., Troja et al. 2006; Lee et al. 2008; Troja et al. 2008, and references therein). The processes include: interaction of SNR shocks with molecular and atomic clouds of various densities which produced a break-out (Shell B) from Shell A as well as associated small-scale structures; interaction of the half-shells with another SNR G189.6+3.3 (e.g., Asaoka & Aschenbach 1994; Keohane et al. 1997); penetration of shock fronts into dense molecular clouds leading to molecular line emission (e.g., Denoyer 1979a, b; Denoyer & Frerking 1981; Huang et al. 1986; Burton et al. 1988; van Dishoeck et al. 1993; Richter et al. 1995; Chevalier 1999; Hewitt et al. 2006); and interaction between the PWN and the environment (Olbert et al. 2001; Leahy 2004; Gaensler et al. 2006; Troja et al. 2008).
Of special interest for this study are the detections of high and very high energy (VHE) gamma rays in the IC 443 vicinity. EGRET detected a gamma-ray source above 100 MeV, co-spatial 111We assume that the gamma-ray sources detected in the region are associated with locally accelerated CRs based on the spatial overlap with the IC 443 structure seen in the radio, IR, optical and X-ray bands. with the SNR (3EG J0617+2238) (Sturner & Dermer 1995; Esposito et al 1996; Lamb & Macomb 1997; Hartman et al 1999). The MAGIC telescope discovered a VHE source, MAGIC J0616+225 (Albert et al. 2007) which is displaced with respect to the position of the EGRET source, and co-spatial with what appears to be the most massive molecular cloud in the neighborhood detected in 12CO and 13CO emission lines (Burton et al. 1988; Dickman et al. 1992; Dame et al. 2001; Seta et al. 1998). VERITAS has confirmed the VHE emission (VER J0616.9+2230) and resolved the source to be extended (Acciari et al. 2009). The centroids of these 3 gamma-ray sources are displaced from that of the PWN.
The LAT data for IC 443 provide an exciting opportunity to study the interaction of an SNR with the interstellar medium, cosmic-ray (CR) acceleration and subsequent injection to the Galactic space. The entire Milky Way has been deeply observed by the LAT and modeling of the diffuse emission thereon allows the emission associated with IC 443 (the “IC 443 contribution”) to be considered separately from the underlying Galactic diffuse emission, which has contributions from inverse Compton scattering of CR electrons (the “Galactic IC component”) and CR electron and proton interactions with interstellar nuclei (the “Galactic CR contribution”). In the LAT data the spatial extension of the contribution from IC 443 can be measured along with its broad-band spectrum
This paper is organized in the following sections: A brief description of the observation, event reconstruction and gamma-ray selection is given in section 2. The analysis procedure is explained in section 3 including the instrument response function (IRF) and separation of the Galactic CR contribution, Galactic IC contribution, extragalactic emission and instrumental background. We present results on the spatial extension and spectrum of the IC 443 contribution in section 4. Discussion is given in section 5 and the paper is concluded in section 6.
2 Observations, Event Reconstruction and Gamma-Ray Selection
2.1 Observation in the Survey Mode
The Fermi Gamma-ray Space Telescope, launched on 11 June 2008, has been surveying all sky with the Large Area Telescope (LAT) since August 2008. Its wide field of view ( sr), large effective area ( cm2 at GeV), the improved point spread function (PSF) 222The PSF is significantly different for gamma rays detected in the front and back portions of the tracker described in this section: the first and second of the two values separated by are for those detected in the front and back, respectively. We use and with superscripts , and to quantify the PSF, source localization error and source extension, respectively. The integrated probabilities in the 2-dimensional angular radii of and are 68% and 95%, respectively. For a symmetric 2D Gaussian distribution is . ( at GeV) and the broad energy coverage (20 MeV 300 GeV) bring much improved sensitivity and gamma-ray statistics over its predecessor EGRET (Atwood et al. 2009).
The LAT is a pair-conversion telescope where a gamma-ray is converted to an pair. Their trajectories are recorded in the tracker and the subsequent shower development are sampled both in the tracker and calorimeter. The tracker is surrounded by a segmented anti-coincidence detector which is used to reject events induced by charged CRs (Atwood et al. 2009; Abdo et al. 2009a). The LAT PSF () is determined at lower energies by multiple scattering in the tracker. At higher energies the PSF approaches to the limit given by the granularity of the tracker channels: it is at 5 GeV and at 10 GeV (Atwood et al. 2009).
The LAT was operated in the nominal all-sky survey during the present observation. In the observation the instrument axis was tilted from the zenith toward the orbit’s north and south poles by 35 deg or 39 deg on alternate orbits to make sky coverage uniform. The trigger rate, mostly on cosmic rays, was kHz in average and varied between the maximum of kHz and the minimum of kHz dependently on the geomagnetic cut-off rigidity. On-board filtering reduced the event rate to Hz for the downlink. Data taking is disabled during passages through the South Atlantic Anomaly (Abdo et al. 2009a).
2.2 Gamma-ray Selection
Gamma-ray candidates are defined in 3 classes on the gamma-ray probability, background expected in orbit, current knowledge of the astronomical gamma-ray fluxes, and performance of the LAT. The Diffuse class has the tightest background rejection of the three (Atwood et al. 2009). However the effective area becomes small and strongly dependent energy below 200 MeV. The averaged rate for the Diffuse class event was Hz during the observation.
In the survey mode the Earth limb, an extremely bright source of gamma-rays, comes near the edge of the field of view. We have removed these gamma-rays with the reconstructed zenith angles greater than .
Cosmic-ray induced background in the Diffuse class becomes comparable in intensity to gamma-rays from the IC 443 region at energies below MeV and above GeV. The background consists of residual cosmic rays misclassified as gamma rays and cosmic rays that convert in the passive material just outside of the LAT without leaving a signal in the anti-coincidence detector. We limit the energy range of this analysis between 200 MeV and 50 GeV where the effective area and the instrumental background is best undersood 333We are currently developing an improved event classification procedure to retain higher effective area at lower energies and to reduce background contaminations in the entire energy range..
The data analyzed here were obtained between 4 August 2008 and 4 July 2009. The gamma rays in the circular region-of-interest (ROI) of radius 15∘ centered at the best-fit centroid of the IC 443 contribution to be determined in section 4.1 (, ) are selected for later ananlyses. We refer to this set of events as the data set: the key selections described here are summarized in Table 1.
Events in the data set are binned in energy at 13 logarithmic steps of starting from 200 MeV. The matching energy-dependent exposure is calculated based on the orbit location, pointing direction, orientation and live-time accumulation of the LAT. The intensity is then calculated by dividing maps of counts with maps of exposure in each energy bin.
3 Analysis Procedure
The present analysis focuses on determination of the centroid and extension of the IC 443 contribution after separation of the Galactic CR contribution in the region. The latter will reflect the detailed spatial structure of the molecular clouds through pionic and bremsstrahlung interactions and potentially can be mistaken as a part of the IC 443 contribution. The uniform all-sky coverage of the LAT observation allows us to isolate the IC 443 contribution cleanly from all Galactic-scale contributions and determine its extension accurately. The Sourcelike analysis has been designated specifically for this kind of analyses. Spectral analysis has been done with the LAT Science Tool gtlike 444Available from http://fermi.gsfc.gov/ssc/data/access/lat/BackgroundModels.html, the Fermi Science Support Center url for the Science Tools. and has been cross-checked by Sourcelike. We give a brief description of the Instrument Response Function (IRF) and Sourcelike before proceeding to the fitting.
3.1 Instrument Response Function
The spatial extension and spectral features of the gamma-ray emission are studied by comparing the observation with predictions of source models. Predictions are made by convolving the spatial distribution and spectrum of the source models with the IRF and the exposure for the observation.
The IRF describes the overall performance of the instrument, event reconstruction and gamma-ray selection. In the Fermi LAT it has been formulated, before the launch, using an instrument simulation program (Atwood et al. 2009). The simulation program has been calibrated against beam test results (Atwood et al. 2009; Abdo et al. 2009a) and the predicted IRF has been validated on several bright point sources in the early operation phase.
The variation in the trigger rate results in variation in the fraction of the trigger-enabled time (the “live-time fraction”) between % to %. Besides lowering the live-time fraction and the exposure, CR hits overlaid on a genuine gamma-ray track can reduce reconstruction efficiency and lead to incorrect event selection. The overall inefficiency has been found to scale linearly with the loss in the live-time fraction with a coefficient that depends on energy. The IRF used in the analysis, IRF P6_V3_Diffuse, has been corrected for inefficiency by, for example, %, % and % at 200 MeV, 500 MeV and 1 GeV, respectively.
3.2 Extension Analysis with Sourcelike
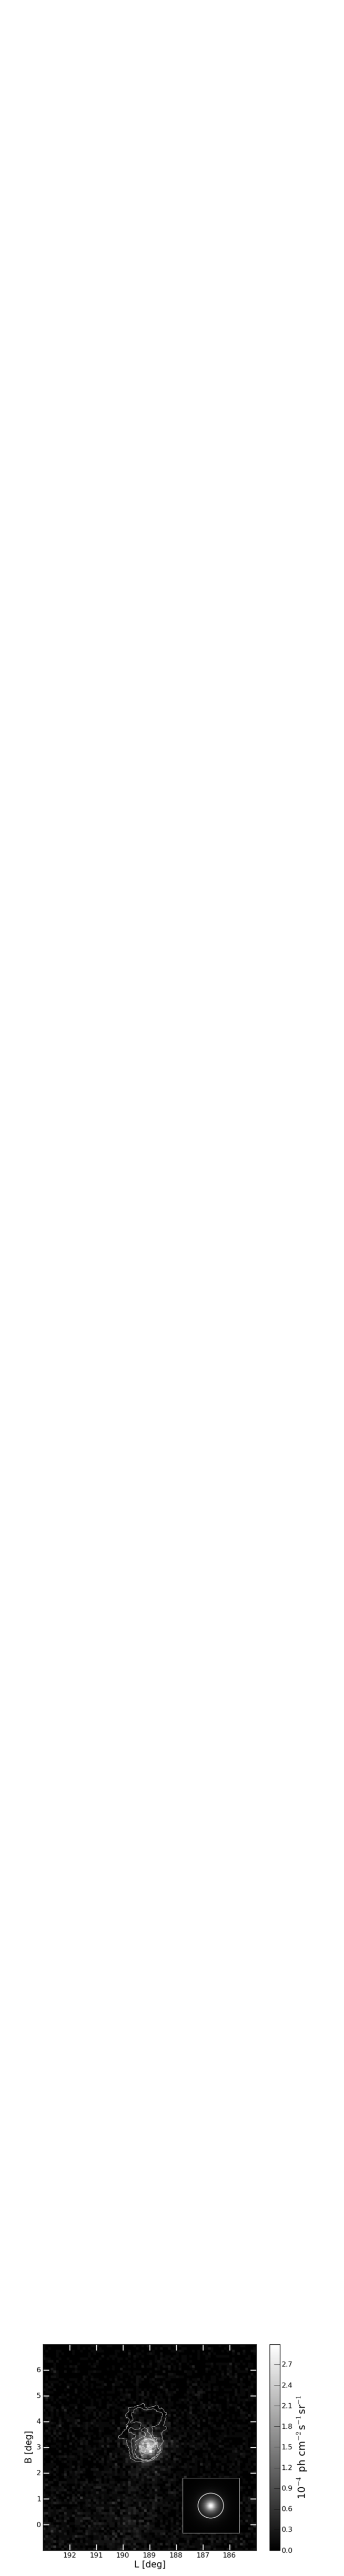
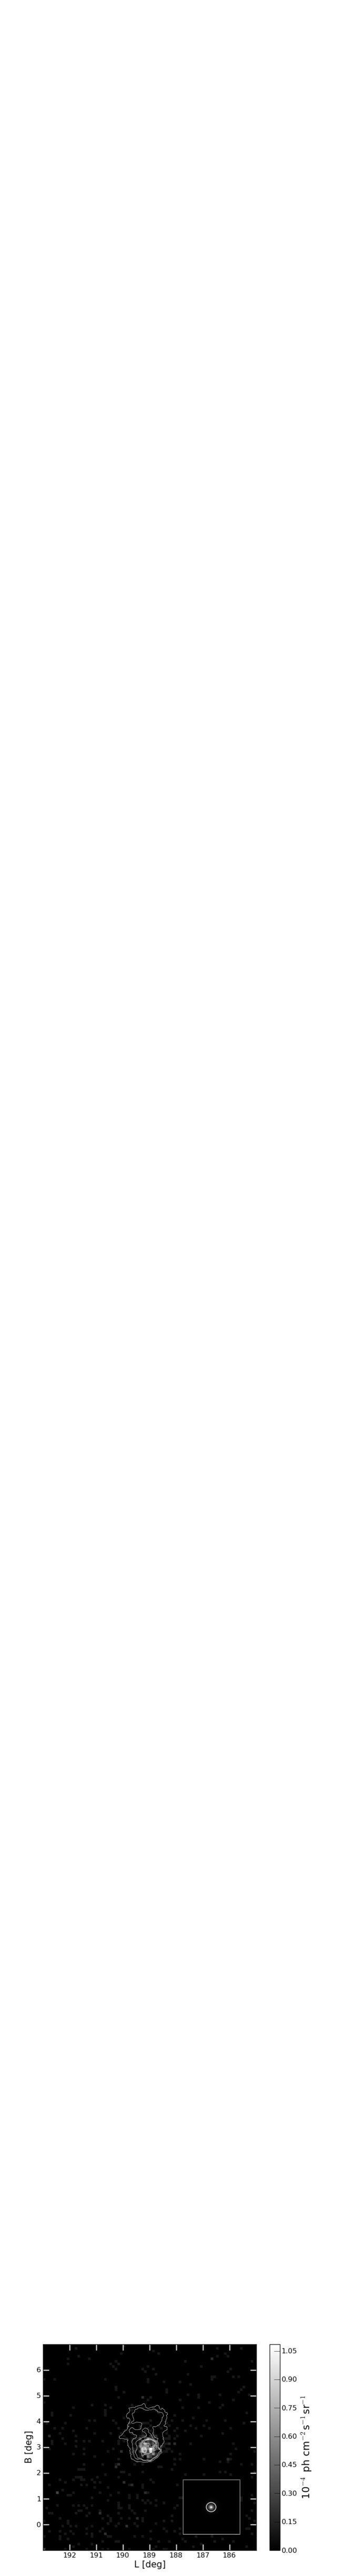
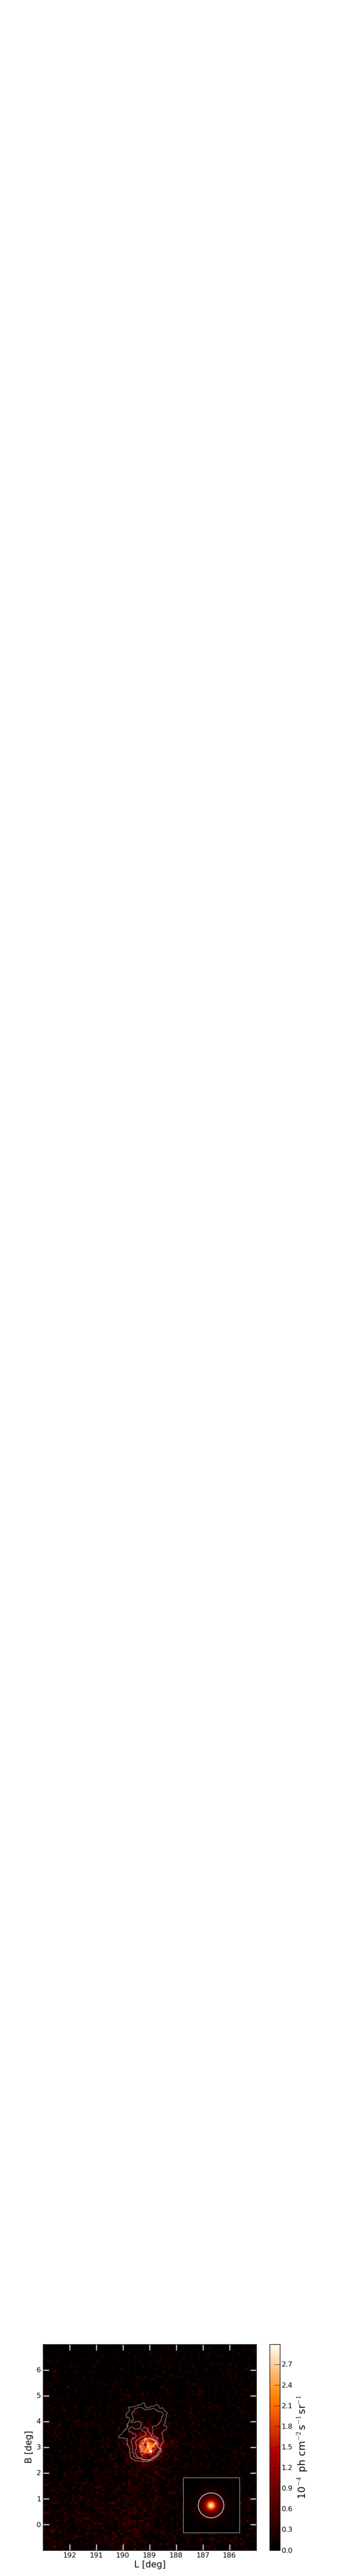
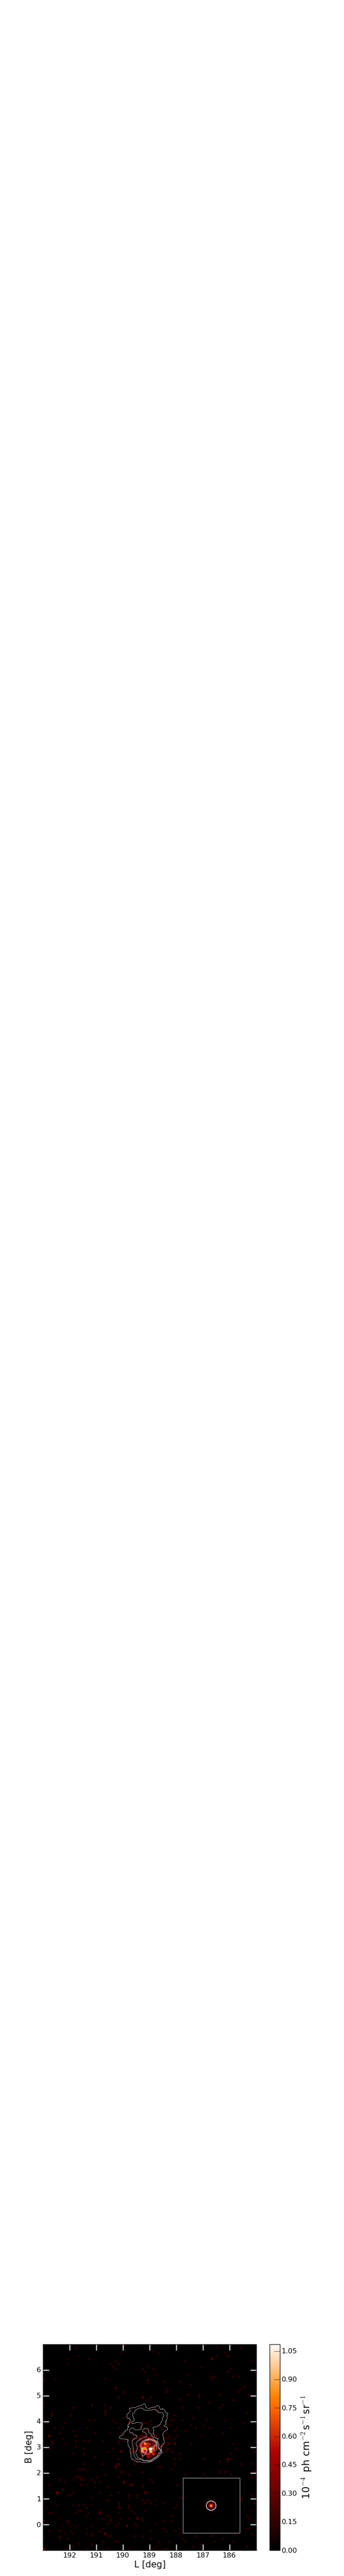
The intensity distribution observed by LAT from the IC 443 region is shown in Fig. 1 for a lower ( GeV) and a higher ( GeV) energy bands for an area of centered at (, ) () with pixelization. Spatial extension of the IC 443 contribution is determined on the intensity distribution using Sourcelike, an analysis tool developed by the LAT team. In the tool, likelihood fitting is iterated to the data set assuming spatial source models and a spatial background model: we use combination of a symmetric 2D Gaussian source model or a point-source model and the standard background model.
The standard background model used in Sourcelike is formulated by summing the Galactic CR contribution, Galactic IC contribution and isotropic component555The sum of the extragalactic background, unresolved sources and instrumental background: its spatial distribution is assumed to be isotropic. given in the diffuse emission model 666gll_iem_v02.fit and isotropic_iem_v02.txt available from the url given in footnote 4.: it is referred as the background here after. All bright sources detected with the LAT (Abdo et al. 2009b) within 15∘ of the the centroid are included in the background.
The fit is performed for the entire data in the user-determined energy range. Absolute normalization of individual background components can be constrained or unconstained in the fit: we leave the diffuse emission model as one unconstained component and so are all bright sources in the ROI in the Sourcelike fit. The difference in Test Statistic (TS) values between the best-fit Gaussian distribution and the best-fit point-source which is gives a measure of statistical significance of the extension. We refer to this difference as TSext in this paper.
The ROI is energy dependent in the Sourcelike: at 200 MeV and shrinks to a minimum of at 50 GeV, which is at least a factor of larger than of the LAT at the same energy and more than a factor of larger than the spatial extension () of the source to be determined later.
4 The IC 443 contribution
4.1 Spatial Extension of the IC 443 Contribution
Two energy bands, 1 GeV5 GeV (the lower energy band) and 5 GeV50 GeV (the higher energy band) have been selected to study the spatial extension of the IC 443 contribution. Sourcelike has been run for events in the two energy bands separately as well as in the combined energy band under a 2D Gaussian and point source hypotheses. The best-fit results are summarized in Table 2.
The number of gamma rays in the fitted Gaussian distribution is 4972 for 200 MeV1 GeV, 1597 for 1 GeV5 GeV and 236 for 5 GeV50 GeV. For a given PSF, the accuracy of centroid determination is predicted to improve proportionally to the inverse of the square-root of the number of events. The accuracy quoted in Table 2 is consistent with this prediction for the effective PSF averaged over events in the energy bands 1 GeV5 GeV and 5 GeV50 GeV.
The difference in TS (TSext) between the symmetric 2D Gaussian and point hypotheses is to ( to )777The two TSext values quoted are: the first one for that used in P6_V3_diffuse; and the second one for a worst-case PSF to be used later in section 5 to obtain a conservative systematic error. for the GeV band and to ( to ) for the GeV band. The centroids for the two bands are consistent within . The IC 443 contribution is extended to in the two energy bands. The centroid in the high energy band is displaced southwards by () in the Galactic coordinate from that in the low energy band.
The results on source location and extension are robust: TS values have been examined at discrete points offset from the best-fit location and extension to confirm the fit. To verify the fit further, we have generated 100 simulated sets of events assuming the best-fit centroid, extension and background with the LAT Science Tool gtobssim. The simulated data are then processed through Sourcelike under 2D Gaussian and point source hypotheses. The distribution of TSext between the two hypotheses is consistent with the values given in Table 2.
The point source hypothesis is rejected at TSext or independently in the two energy bands and at TSext or in the combined energy band. The extensions in the two energy bands are mutually consistent within the errors given in Table 2.
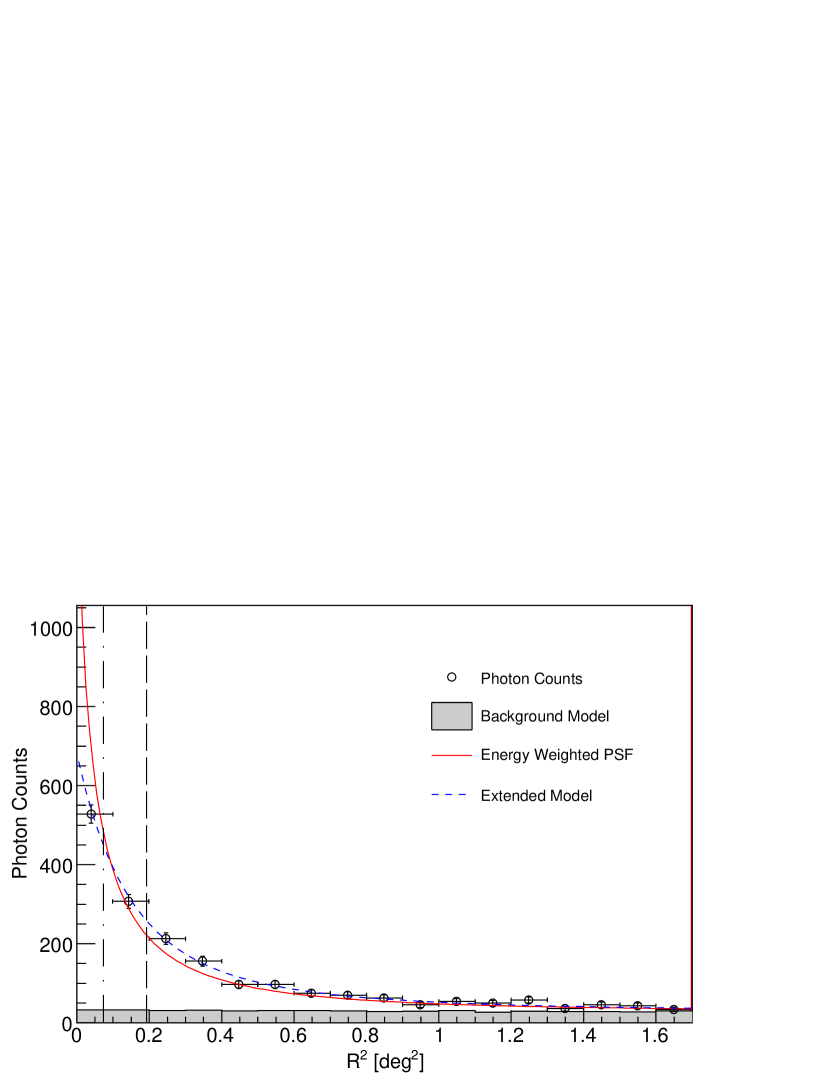
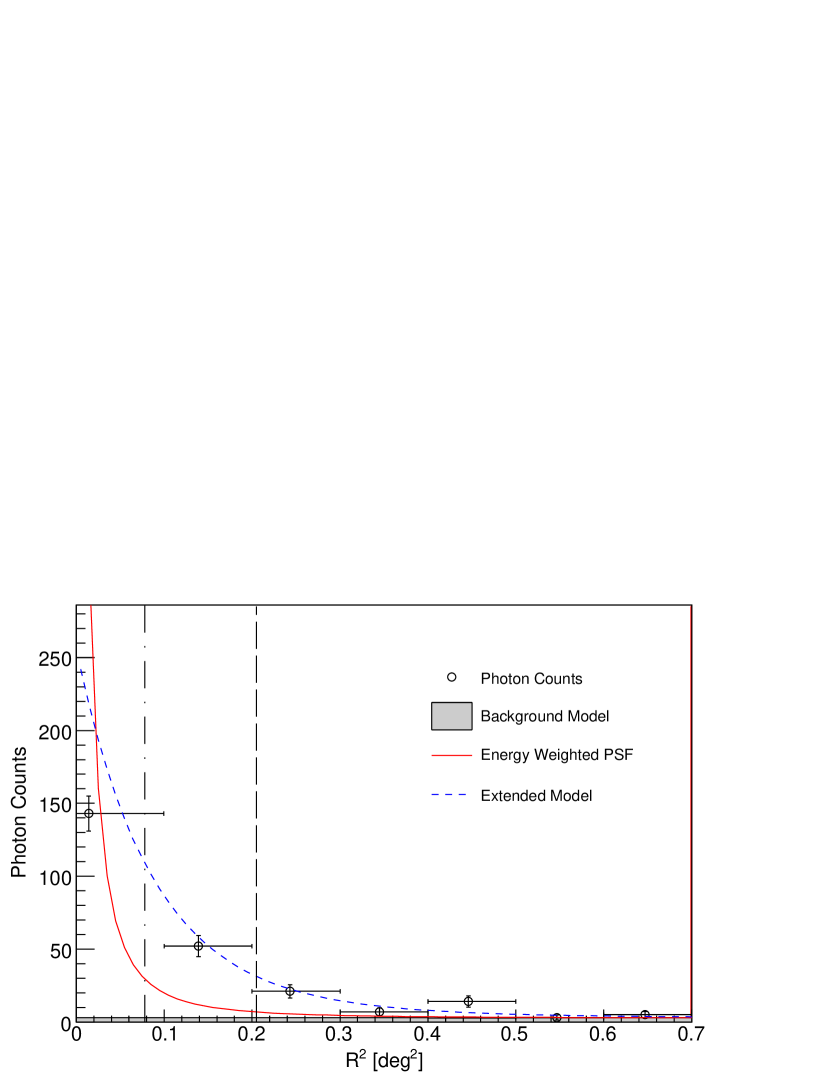
The radial profiles of event distribution around the centroid is shown in Fig. 2 for the low and high energy bands together with the profile predicted for the point source hypothesis which is the LAT PSF weighted with the spectral distribution of the events Sourcelike has associated with the source under the point-source hypothesis.
Extension was poorly determined for E=200 MeV 1 GeV because of the large PSF of the LAT in the energy range (Atwood et al. 2009). However, the centroid and extension are consistent with the extension determined above 1 GeV and given in Table 2. Hence we assume the same 2D Gaussian distibution in the entire energy range.
4.2 Spectrum of the IC 443 Contribution
The spectrum of the IC 443 contribution is fitted by the Science Tool gtlike, the Fermi standard tool, as well as by Sourcelike. In gtlike, we have to assume a spatial template for all spectral components included in the fitting. The data set is assumed to be a sum of three contributions: the best-fit 2D Gaussian distribution given for the GeV range in Table 2 which represents the IC 443 contribution 888The extension could not be determined at a high statistical significance for MeV GeV but the spatial distribution of gamma rays is consistent with those given in Table 2.; the background whose spatial distribution is represented by the sum of gll_iem_v02.fit and isotropic_iem_v02.txt; and the bright sources listed in Abdo et al. (2009b) in the square region of centered at the best-fit centroid (, ).
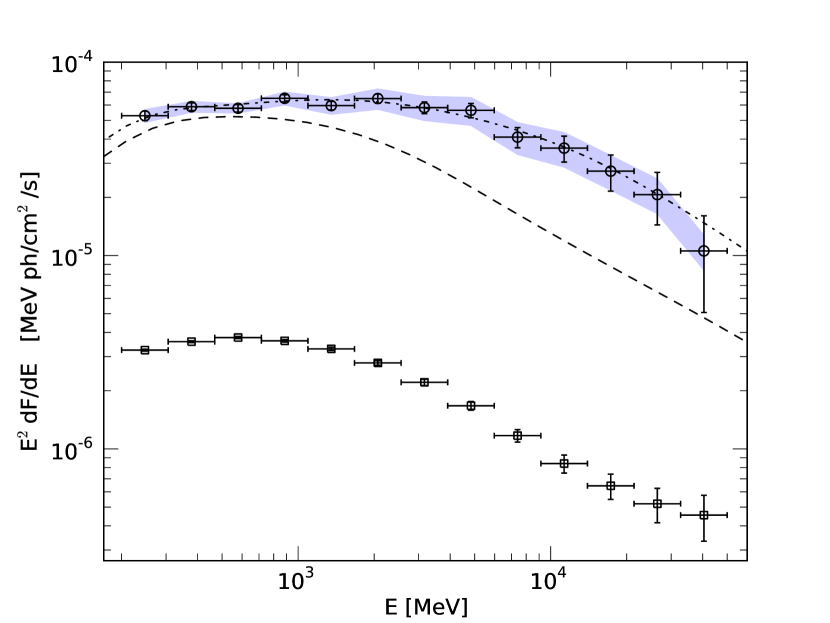
The fitted IC 443 spectra from gtlike and Sourcelike agree well within the total error. We adopt the spectrum obtained with gtlike and tabulate in Table 3. It is converted to the spectral energy density (SED) and shown by circles with error bars in Fig. 3. Squares with error bars in the figure is the background spectrum normalized to the solid angle subtended by around the centroid given in Table 2. The IC 443 contribution is approximately 20 times higher than the background in the entire energy band.
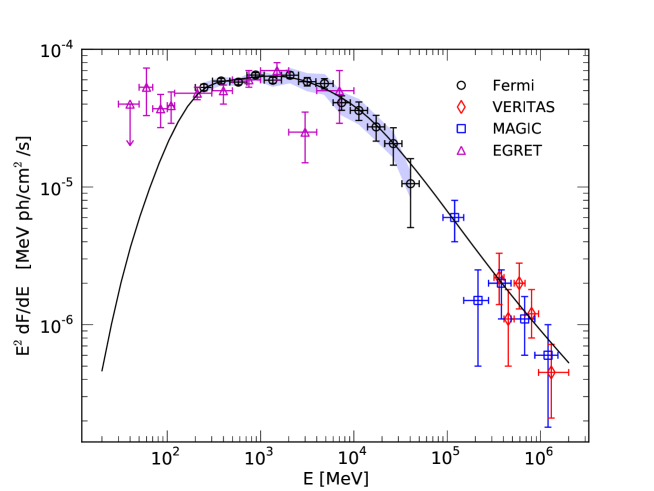
The SED of the IC 443 contribution thus determined has been fitted with a single power-law and broken-power-law models: the results are tabulated in Table 4. The single power-law fit fails to represent the spectrum giving a large reduced chi-square of while the broken power-law fit represents the overall shape quite well giving a small reduced chi-square () as shown in Table 4. The SED of the IC 443 contribution is plotted with those from previous observations, EGRET (Esposito et al 1996), MAGIC (Albert et al. 2007) and VERITAS(Acciari et al. 2009) in Fig. 4.
4.3 Systematic error in determination of the centroid, extension and spectrum
When we determine the centroid of the IC443 contribution, uncertainty in the spatial distribution of the Galactic diffuse emission adds to the systematic error. The spatial template is taken from the standard diffuse emission model, gll_iem_v02.fit. To confirm our analysis, we have fitted the data set with the standard version of GALPROP for Fermi LAT (GALDEF 54_59Xvarh8S) (Strong & Moskalenko 1998; Strong et al. 2001, 2009) made of the CO line survey by Dame et al. (2001) and H I survey by Kalberla et al. (2005) as well as with a gas model made of the map by Dobashi et al. (2005) and H I survey by Kalberla et al. (2005). The two alternate gas models have given centroids consistent with that given in Table 2.
The residual misalignment of the LAT and the star tracker can also contribute to the systematic error: the source localization has been verified on orbit using bright point sources to arc-sec as of August 2009. The combination of all errors described here gives the overall systematic localization error in Table 5.
Our flux measurement depends on the knowledge on the effective area as a function of gamma-ray energy. We estimate systematic error in the effective area to be 10 %, 5 %, and 20 % at E=100 MeV, 562 MeV and GeV respectively.
Uncertainty in the background used in gtlike and Sourcelike can also introduce error in the flux measurement. This uncertainty is estimated to be % for 200 MeV 1 GeV and % for 1 GeV of the background (Abdo et al. 2009c, d). Systematic error at each energy bin is determined through a linear interpolation in among the values quoted above.
The PSF used in this analysis has been derived on the detector simulation which was itself verified in accelerator tests (Atwood et al. 2009). As gamma-ray statistics improves, the PSF will be updated against measurement on bright point sources. In the present study, we have used a preliminary upper limit to assess possible systematic error introduced by inaccurate formulation of PSF: we consider this as the “worst-case” PSF. The worst-case PSF () gives a widest limit while the for GeV is about 40% larger than the default PSF. The source centroid comes out to be consistent within the total error when Sourcelike is run with the worst-case PSF. We have included the difference in the systematic error given in Tables 2 and 5.
5 Discussion
The IC 443 system consists of a complex distribution of molecular and atomic clouds in the southern rim of Shell A (e.g., Snell et al. 2005; Lee et al. 2008, and references therein). Molecular clouds wrap around the southern rim and the boundary region between Shells A and B (Beichman et al. 1988; Seta et al. 1998; Dickman et al. 1992; Dame et al. 2001). Molecular lines from shocked gas have been found in several clouds suggesting interaction with the blast-wave at multiple sites (e.g., Cornett et al. 1977; Denoyer & Frerking 1981; Huang et al. 1986; Burton et al. 1988; Dickman et al. 1992; van Dishoeck et al. 1993; Richter et al. 1995; Seta et al. 1998; Snell et al. 2005). A prominent band of HI gas has also been found in the southeastern part of Shell A (Denoyer 1978; Giovanelli & Haynes 1979; Lee et al. 2008, and references therein.). Some parts of the H I gas are found to be shocked (Braun & Strom 1986a; Lee et al. 2008).
The total mass of the molecular gas in the region is estimated to be M⊙ (Torres et al. 2003), of which only a small fraction is shocked (Snell et al. 2005). The total mass in the H I belt is estimated at M⊙ of which M⊙ is shocked (Lee et al. 2008). Despite past extensive observations and analyses, little is known about how the multiple shell-like structures are spatially correlated and where one or more supernova explosions took place.
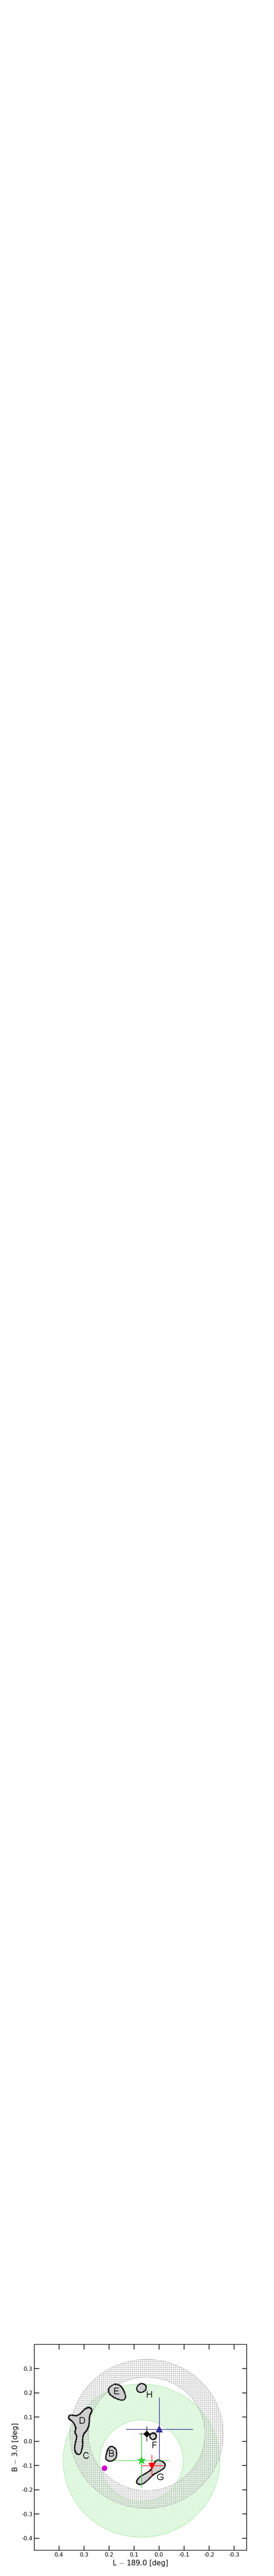
In the group of shocked molecular clouds schematically shown in Fig. 5, Cloud G 999Labeling is given by Denoyer (1979b); Huang et al. (1986). lies closest to the centroid of the MAGIC and VERITAS sources (Huang et al. 1986). It appears to be extended by and overlaps with a non-shocked CO cloud formation (Huang et al. 1986; Burton et al. 1988; Dickman et al. 1992). Chevalier (1999) has suggested that interaction between Shell A and Cloud G is responsible for the gamma-ray emission observed by EGRET. Existence of an OH Maser in the cloud suggests that the densities reach cm-3 (Frail et al. 1996; Hewitt et al. 2006, 2008). A later CO line observation by Snell et al. (2005) found a compact core of extension in Cloud G at (, ). Fainter maser emission has also been found in Clouds B and D at (, ) and (, ), respectively (Hewitt et al. 2006, 2008).
The locations and extensions of the gamma-ray emission from IC 443 detected by EGRET (Hartman et al 1999), MAGIC (Albert et al. 2007), VERITAS (Acciari et al. 2009), and Fermi LAT are summarized in Table 5 and shown in Fig. 5. Fermi LAT gives the best source localization or the smallest error circle () for the 2D Gaussian centroid () and a precise determination of the source extension ( (sys)). Our centroid determined for 1 GeV 50 GeV, (, ), is 0.05 deg away from the EGRET source (3EG J0617+2238) but within of their localization error; 0.15 deg from the MAGIC source (J0610+225) which is at more than 5 times their localization error (); and 0.12 deg from the VERITAS source (VER J0616.9+2230) or at 1.5 times their localization error ().
The measured source extension, , is comparable with 101010We assume the extension is modeled by a symmetric 2D Gaussian and converted to . given by VERITAS. The two extended regions overlap almost completely. The three shocked clouds with OH maser (Clouds B, D and G) are within our measured extension and so are other shocked clouds (Clouds C, E, F and H). The PWN localized at (, ) by Olbert et al. (2001) and Gaensler et al. (2006) is 0.26 deg away from our centroid but within our measured extension .
The Fermi spectrum of the IC 443 contribution shown in Fig. 3 is flat between a few 100 MeV and GeV, suggesting the origin being mostly neutral pions produced by protons 111111We include cosmic-rays and target nuclei heavier than the proton (the alpha particle and heavier nuclei) in protons throughout this paper. In the approximation we adopt here (Gaisser & Schaefer 1992), these can be accounted for by multiplying a nuclear factor () without changing the CR proton spectrum. The known gamma-ray producing particle processes which do not go through neutral pions (e.g., and direct photon production) contribute less than 1 % in the present energy range.. The dashed line in the figure represents the gamma-ray spectrum expected from a M⊙ cloud bombarded with the Galactic CR protons predicted at IC 443 scaled up by a factor of 100. The Galactic CR spectrum is taken from the standard GALPROP (54_59Xvarh8S) (Strong & Moskalenko 1998; Strong et al. 2001, 2009) and the parameterized cross-section for by Kamae et al. (2006). In GALPROP the Galactic CR proton spectrum depends on the radius from the Galactic Center and the displacement from the Galactic Plane. The spectrum at the radius of IC 443 is % lower than that in the solar vicinity and has a power-law shape with index .
The Fermi SED is compared with those of EGRET MAGIC and VERITAS in Fig. 4. The EGRET spectrum is consistent with our spectrum except for their 3 GeV point. MAGIC and VERITAS do not overlap with the LAT in the energy coverage. Their fluxes are consistent with ours if extrapolated down to GeV by assuming their measured power-law indices.
Since the source regions of Fermi LAT and VERITAS overlap within their respective uncertainties listed in Table 5, we can judiciously proceed to fit the 2 spectra with one spectral model.
On the assumption that the distance is kpc, the isotropic luminosity of IC 443 integrated over the energy band ( GeV) is erg/s. Electron bremsstrahlung can hardly explain the observed IC 443 gamma-ray emissivity: the cross-sections for bremsstrahlung and pionic gamma-ray emission are similar in the present energy band, so the bremsstrahlung-to-pion ratio is approximately the ratio of CR electron and proton fluxes which is . The observed gamma-ray flux is too high for bremsstrahlung to be the dominant process. Inverse Compton scattering can not explain the observed IC 443 gamma-ray emission either: the gas density of the emission region is cm-3 and the Compton-to-bremsstrahlung ratio is for the seed photon density of the cosmic microwave background. We note that there is no bright source of seed photons known in the region of the IC 443 contribution. The gamma-ray energy will be strongly bound by the electron spectrum which likely rolls down similarly as the proton spectrum. Our observation, however, does not rule out a small contribution from bremsstrahlung near the minimum of the present energy band.
In a hadronic scenario, the observed photon spectrum up to TeV energies can be well fitted by an underlying pion-producing proton population with a broken power-law spectrum Fp(Tp) = (T GeV)-α (MMgas) cm-2s-1GeV-1, where is for T GeV and for T GeV respectively, and Mgas is the gas mass in the interaction region. The error (statistical) in the fitted break energy is GeV and the chi-square for the best-fit broken power-law model is per degree-of-freedom. Assuming the gas density (n cm-3) is uniform and the proton spectrum is the broken power-law everywhere in the interaction region, the total energy of the interacting protons is given by Wp( GeV) = (n cm-3)-1(d kpc)2 erg. Note that the pion production threshold is GeV. Taking M M⊙ and a gas volume ranging from (d)3 = cm3 up to (d)3 = cm3, we obtain n cm-3, giving Wp( GeV) erg. We note that energies carried by local nuclear cosmic rays outside of the interaction region and by local leptonic cosmic rays are not included in the estimation. The fitted gamma-ray spectrum is shown in Fig. 3 and Fig. 4. We note that inclusion of the MAGIC points in the fit does not change the above results.
Broad-band gamma-ray spectral models have been proposed assuming CR interaction with interstellar gas in IC 443 by Torres et al. (2008) and Zhang & Fang (2008). Torres et al. (2008) model the CR diffusion in the SNR to allow spectral differences in the protons interacting with the ambient gas in the shell and in a detached molecular cloud. Zhang & Fang (2008) predict one contribution to come from the SNR shell evolving in the interstellar matter and the other from CR interaction with molecular clouds. One difference between the two models is that Zhang & Fang (2008) include inverse Compton scattering as a possible emission mechanism.
The combined spectrum of Fermi and VERITAS gives a strong constraint to spectral models for the IC 443 contribution. Since the spectrum of the dominant CR component (proton) is rolling over at GeV, secondary electrons and positrons can only contribute at energies GeV. This constrains the parameter space of the model by Zhang & Fang (2008). The overlap between the Fermi and VERITAS spatial extensions and the smooth spectral transition from Fermi to VERITAS constrain the parameter spaces of the models by Torres et al. (2008) and Zhang & Fang (2008).
We discuss briefly about possible mechanisms behind the broken power-law form of the proton spectrum deduced from the gamma-ray observation of IC 443. The most obvious one is escape of highest energy CRs from the acceleration site. When accelerated CR protons exceed the maximum energy determined by the magnetic field and linear-scale of the aceleration site, they escape into the Galactic space. Theory of diffusive shock acceleration (DSA) assumes spherically symmetric morphology and predicts the CR spectrum to roll over exponentially at the maxmum energy. The maximum energy depends on the condition of the acceleration site: Ptuskin & Zirakashvili (2005) have incorporated various instabilities in DSA and predict the maximum energy as a function of the SNR age. For the age of IC 443 ( kyr), the maximum proton energy can be around 100 GeV (Fig.1 of Ptuskin & Zirakashvili 2005) or near the observed break energy ( GeV) beyond which the spectrum is assumed to cut-off exponentially. We have fitted the observed gamma-ray spectrum with a single power-law, exponentially cut off proton spectrum to get chi-square per degree-of-freedom of 30.3/15 much higher than 9.6/14 for the broken power-law spectrum. This simple statistical test therefore suggests that the observed broad-band gamma-ray spectrum is inconsistent with the simple DSA-based CR escape scenario which predicts a simple powerlaw with an exponential cutoff in the proton spectrum. We also note that DSA has mostly been studied for uniform gas densities around 1cm-3, while the gas around IC443 is inhomogenous and in various shocked molecular clouds around the remnant also denser.
Historically, after the discoveries of the EGRET source (Sturner & Dermer 1995; Esposito et al 1996) and the hard X-ray source (Keohane et al. 1997) but before the discoveries of the PWN (Olbert et al. 2001) and MAGIC source (Albert et al. 2007), models have been proposed to explain the emission between keV and GeV by bremsstrahlung in dense clouds (e.g., Bykov et al. 2000) with possible mix of synchrotron (e.g., Sturner et al. 1997). The SNR was also studied as a part of non-linear shock evolution in various environments (e.g., Baring et al. 1999). While their predictions for IC 443 are not supported by the later observations including the present one, parameters in these studies can be readjusted to describe the bremsstrahlung contribution discussed below.
The bremsstrahlung likely makes a non-negligible contribution below MeV where the EGRET data points exceed the best-fit pionic spectrum (see Fig. 4). As our understanding of the IRF and cosmic-ray-induced background improve, analysis will be extended to energies lower than 200 MeV and the bremsstrahlung spectrum component will be determined accurately. The hard X-ray SED measured by Beppo-SAX (Bocchino & Bykov 2000) is substantially higher than that by XMM (Bocchino & Bykov 2001): which may suggest bremsstrahlung contribution near the PWN location as has been discussed by Sturner et al. (1997) and Bykov et al. (2000).
6 Conclusions
We have studied gamma-ray emission from the nearby SNR IC 443 (G189.1+3.0) using the first 11 months of science data from Fermi LAT. The uniform sky coverage and high gamma-ray statistics of the observation have enabled us to separate the genuine IC 443 contribution from the emissions by Galactic CRs on interstellar gas, inverse Compton scattering by Galactic CR electrons on large-scale interstellar radiation field, extragalactic sources and instrumental background.
Based on the extension study described in subsections 4.1 and the spectral analysis described in subsection 4.2 as well as discussions given in section 5, we conclude that:
-
•
The gamma-ray emission from IC 443 is detected at level: the emission is extended with 68% containment angular radius in the energy range between 1 GeV and 50 GeV. The extension remains unchanged within error in the low (1 GeV 5 GeV) and high (5 GeV 50 GeV) energy bands.
-
•
The centroid of the emission moves at level toward that of the VERITAS source as the energy band changes from GeV to GeV. The centroid is inconsistent with the PWN location, suggesting that the PWN is not the major contributor in the present energy range.
-
•
The centroid of the emission is consistent with that of EGRET (3EG J0617+2238), displaced more than (MAGIC) from that of MAGIC (J0610+225), and at (VERITAS) that of VERITAS (VER J0616.9+2230).
-
•
The extended source region overlaps almost completely that of VERITAS. A group of molecular clouds (Clouds B, C, D, F, and G), the SNR shell and the PWN are within the overlapping region (), leaving possibility that some or all of them contribute to the observed emission.
-
•
The SED can not be represented by a single power-law but is consistent with a broken power-law with a break at GeV.
-
•
The SED has a broad peak between a few 100 MeV and GeV which is consistent with the majority of the emission coming from neutral pion decays. For the emission being hadronic originating from a single proton population, the underlying proton spectrum is consistent with a broken power-law shape (chi-square per degree-of-freedom of 9.6/14) but not with an exponential cut-off (30.3/15). For the estimated total mass of interacting gas of M⊙, the total energy in the pion-producing protons is estimated to be erg.
Higher statistics is needed to establish association or non-association of the gamma-ray emission with the molecular clouds and/or the PWN as well as CR injection process from the SNR into the Galactic space. Identification of the emission mechanisms and underlying CR spectra effective in individual sites will follow after such studies.
Fermi LAT is expected to accumulate needed statistics well within the planned mission lifetime.
Acknowledgements
The LAT Collaboration acknowledges generous ongoing support from a number of agencies and institutes that have supported both the development and the operation of the LAT as well as scientific data analysis. These include the National Aeronautics and Space Administration and the Department of Energy in the United States, the Commissariat à l’Energie Atomique and the Centre National de la Recherche Scientifique / Institut National de Physique Nucléaire et de Physique des Particules in France, the Agenzia Spaziale Italiana and the Istituto Nazionale di Fisica Nucleare in Italy, the Ministry of Education, Culture, Sports, Science and Technology (MEXT), High Energy Accelerator Research Organization (KEK) and Japan Aerospace Exploration Agency (JAXA) in Japan, and the K. A. Wallenberg Foundation, the Swedish Research Council and the Swedish National Space Board in Sweden.
Additional support for science analysis during the operations phase is gratefully acknowledged from the Istituto Nazionale di Astrofisica in Italy and the Centre National d’Etudes Spatiales in France.
References
- Abdo et al. (2009a) Abdo, A. A., et al. 2009a, Astropart. Phys. (in press), arXiv:0904.2226
- Abdo et al. (2009b) Abdo, A. A. et al. 2009b, ApJS, 183, 46
- Abdo et al. (2009c) Abdo, A. A. et al. 2009c, Phys. Rev. Lett., (submitted)
- Abdo et al. (2009d) Abdo, A. A. et al. 2009d, ApJ, 703, 1249
- Acciari et al. (2009) Acciari, V. A., et al. 2009, ApJ, 698, L133
- Albert et al. (2007) Albert, J., et al. 2007, ApJ, 664, L87
- Asaoka & Aschenbach (1994) Asaoka, I. & Aschenbach, B. 1994, A&A, 284, 573
- Atwood et al. (2009) Atwood, W., et al. 2009, ApJ, 697, 1071
- Baring et al. (1999) Baring, M. G., Ellison, D. C., Reynolds, S. P., Grenier, I. A., & Goret, P. 1999, ApJ, 513, 311
- Beichman et al. (1988) Beichman, C., et al. (eds.), 1988, IRAS Catalogs and Atlases, NASA RP-1190.
- Bocchino & Bykov (2000) Bocchino, F. & Bykov A. M., 2000, A&A, 362, L29.
- Bocchino & Bykov (2001) Bocchino, F. & Bykov A. M., 2001, A&A, 376, 248.
- Braun & Strom (1986a) Braun, R., & Strom, R. G. 1986a, A&AS, 63, 345
- Braun & Strom (1986b) Braun R. & Strom R. J. 1986b, A&A, 164, 193
- Burton et al. (1988) Burton, M. G., Geballe, T. R., Brand, P. W. J. L., & Webster, A. S. 1988, MNRAS, 231, 617
- Bykov et al. (2000) Bykov, A. M., Chevalier, R. A., Ellison, D. C., & Uvarov, Y. A. 2000, ApJ, 538, 203
- Bykov et al. (2008) Bykov, A. M. et al. 2008, ApJ, 676, 1050
- Chevalier (1999) Chevalier, R. A. 1999, ApJ, 511, 798
- Cornett et al. (1977) Cornett, R. H., Chin, G., & Knapp, G. R. 1977, A&A, 54, 889
- Dame et al. (2001) Dame, T., Hartmann, D., & Thaddeus, P. 2001, ApJ, 547, 792
- Denoyer (1978) Denoyer, L. K. 1978, MNRAS, 183, 187
- Denoyer (1979a) Denoyer, L. K. 1979a, ApJ, 228, L41
- Denoyer (1979b) Denoyer, L. K. 1979b, ApJ, 232, L165
- Denoyer & Frerking (1981) Denoyer, L. K., & Frerking, M. A. 1981, ApJ, 246, L37
- Dickman et al. (1992) Dickman, R. L., Snell, R. L., Ziurys, L. M., & Huang, Y.-L. 1992, ApJ, 400, 203
- Dobashi et al. (2005) Dobashi, K. et al. 2005 PASJ, 57, S1
- Esposito et al (1996) Esposito, J. A., Hunter, S. D., Kanbach, G., & Sreekumar, P. 1996, ApJ, 461, 820
- Fesen & Kirshner (1980) Fesen, R. A. & Kirshner, R. P. 1980, ApJ, 242, 1023
- Frail et al. (1996) Frail, D. A., Goss, W. M., Reynoso, E. M., Giacani, E. B., Green, A. J., & Otrupcek, R. 1996, AJ, 111, 1651
- Furst et al. (1990) Furst, E., Reich, W., Reich, P., & Reif, K. 1990, A&AS, 85, 691
- Gaensler et al. (2006) Gaensler B. M. et al., 2006, ApJ, 648, 1037.
- Gaisser & Schaefer (1992) Gaisser, T. K., & Schaefer, R. K. 1992 ApJ, 394, 174
- Giovanelli & Haynes (1979) Giovanelli, R., & Haynes, M. P. 1979, ApJ, 230, 404
- Green (2004) Green, D. A., 2004, BASI, 32, 335G.
- Hartman et al (1999) Hartman, R. C. et al. 1999, ApJS, 123, 79
- Hewitt et al. (2006) Hewitt, J. W. et al., 2006, ApJ, 652, 1288
- Hewitt et al. (2008) Hewitt, J. W. et al., 2008, ApJ, 683, 18 Federman, S. R., Wallerstein, G., & Means, T. 2009, ApJ, 696, 1533
- Huang et al. (1986) Huang, Y.-L., Dickman, R. L., & Snell, R. L. 1986, ApJ, 302, L63
- Kalberla et al. (2005) Kalberla, P. M. W., et al. 2005, A&A, 440, 775
- Kamae et al. (2006) Kamae, T. et al. 2006, ApJ, 647, 692; Erratum 2007, ApJ, 662, 779
- Keohane et al. (1997) Keohane, J. W., Petre, R., Gotthelf, E. V., Ozaki, M., & Koyama, K. 1997, ApJ, 484, 350
- Lamb & Macomb (1997) Lamb, R. C., & Macomb, D. J. 1997, ApJ, 488, 872
- Leahy (2004) Leahy, D. A. 2004, AJ, 127, 2277
- Lee et al. (2008) Lee, Jae-Joon, et al. 2008, ApJ, 135, 796
- Lozinskaya (1981) Lozinskaya, T. A. 1981, Soviet Astron. Lett., 7, 17 & Bowyer, S. 1976, ApJ, 207, 894
- Olbert et al. (2001) Olbert, C. M., Clearfield, C. R., Williams, N. E., Keohane, J. W., & Frail, D. A. 2001, ApJ, 554, L205
- Petre et al. (1988) Petre, R., Szymkowiak, A. E., Seward, F. D., & Willingale, R. 1988, ApJ, 335, 215
- Ptuskin & Zirakashvili (2005) Ptuskin, V. S., & Zirakashvili, V. N. 2005, A&A, 429, 755
- Richter et al. (1995) Richter, M. J., Graham, J. R., & Wright, G. S. 1995, ApJ, 454, 277
- Seta et al. (1998) Seta, M., et al. 1998, ApJ, 505, 286
- Snell et al. (2005) Snell, R. L. et al., 2005 ApJ 620 758
- Strong & Moskalenko (1998) Strong, A. W., & Moskalenko, I. V. 1998 ApJ,, 509, 212
- Strong et al. (2001) Strong, A. W., Moskalenko, I. V., & Reimer, O. 2001 ApJ, 537, 763
- Strong et al. (2009) Strong, A. W., et al., 2009 arXiv:0907.0559
- Sturner & Dermer (1995) Sturner, S. J., & Dermer, C. D. 1995, A&A, 293, L17
- Sturner et al. (1997) Sturner, S. J., Skibo, J. G., Dermer, C. D., & Mattox, J. R. 1997, ApJ, 490, 619
- Torres et al. (2003) Torres, D. F., Romero, G. E., Dame, T. M., Combi, J. A., & Butt, Y. M. 2003, Phys. Rep., 382, 303
- Torres et al. (2008) Torres, D. F., Rodriguez Marrero A. Y., & de Cea del Pozo E. 2008, MNRAS Letters, 387, 59
- Troja et al. (2006) Troja, E., Bocchino, F. & Reale, F. 2006, ApJ, 649, 258
- Troja et al. (2008) Troja, E., Bocchino, F., Miceli, M., & Reale, F. 2008, A&A, 485, 777
- van Dishoeck et al. (1993) van Dishoeck, E. F., Jansen, D. J., & Phillips, T. G. 1993, A&A, 279, 541
- Welsh & Sallmen (2003) Welsh, B. Y., & Sallmen, S. 2003, A&A, 408, 545
- Woltjer (1972) Woltjer, L. 1972, ARA&A, 10, 129
- Zhang & Fang (2008) Zhang, L. and Fang, J., 2008, ApJ, 675, L21
| Parameter | Value |
|---|---|
| Time Period (MET) | |
| Energy Range …….. | MeV - GeV |
| ROI …………………… | in radius |
| Photon Class ………. | Pass 6 Diffuse |
| Additional Cut ……….. | Zenith angle |
| Model | (∘) | (∘) | (∘) aaErrors of centroids and extensions quoted include systematic errors. | (∘) aaErrors of centroids and extensions quoted include systematic errors. | (∘) aaErrors of centroids and extensions quoted include systematic errors. | TSext bbThe two values shown in this column are the lower and higher of the TSext obtained with the default PSF (the first) and worst-case PSF (the second) described in the text. |
|---|---|---|---|---|---|---|
| GeV | ||||||
| Point Source | ||||||
| Gaussian | ||||||
| GeV | ||||||
| Point Source | ||||||
| Gaussian | ||||||
| GeV | ||||||
| Point Source | ||||||
| Gaussian |
| [MeV] | [cm-2 s-1 MeV-1] | (stat error) | (sys error) |
|---|---|---|---|
| 247.31 | 8.63 | 4.80 | 6.37 |
| 378.19 | 4.11 | 1.87 | 2.52 |
| 578.32 | 1.72 | 7.81 | 8.89 |
| 884.36 | 8.31 | 3.59 | 6.11 |
| 1352.34 | 3.25 | 1.65 | 3.12 |
| 2067.96 | 1.51 | 8.36 | 1.78 |
| 3162.27 | 5.81 | 4.06 | 8.14 |
| 4835.67 | 2.40 | 2.05 | 3.90 |
| 7394.58 | 7.49 | 8.98 | 1.38 |
| 11307.60 | 2.80 | 4.29 | 5.61 |
| 17291.30 | 9.13 | 1.93 | 1.82 |
| 26441.41 | 2.95 | 8.94 | 5.90 |
| 40433.51 | 6.46 | 3.35 | 1.29 |
| Model | Ebreak (GeV) | F200aaTotal flux integrated above MeV obtained with gtlike assuming the best-fit broken power-law model and the best-fit 2D Gaussian spatial distribution. ( cm-2 s-1) | ||||
|---|---|---|---|---|---|---|
| IC 443 | Broken PL | |||||
| IC 443 | PL |
| Observation | of localization (∘) | of extension (∘) | ||
|---|---|---|---|---|
| EGRET | 189.00 | 3.05 | 0.13 () | N/A |
| MAGIC | 189.03 | 2.90 | (stat) (sys) | N/A |
| VERITAS | 189.07 | 2.92 | (stat) (sys) | (stat) (sys) |
| Fermi | 189.05 | 3.03 | (stat) (sys) | (stat) (sys) |