Chemodynamics of Compact Stellar Systems in NGC 5128: How similar are globular clusters, ultra-compact dwarfs, and dwarf galaxies?$\star$$\star$affiliation: Based on observations made with ESO Telescopes at the Paranal Observatories under program 69.D-0094 and 69.D-0196.
Abstract
Velocity dispersion measurements are presented for several of the most luminous globular clusters (GCs) in NGC 5128 (Centaurus A) derived from high-resolution spectra obtained with the UVES echelle spectrograph on the 8.2m ESO/Very Large Telescope. The measurements are made utilizing a penalized pixel fitting method that parametrically recovers line-of-sight velocity dispersions (LOSVD). Combining the measured velocity dispersions with surface photometry and structural parameter data from the Hubble Space Telescope enables both dynamical masses and mass-to-light ratios to be derived. The properties of these massive stellar systems are similar to those of both massive GCs contained within the Local Group and nuclear star clusters and ultra-compact dwarf galaxies (UCDs). The fundamental plane relations of these clusters are investigated in order to fill the apparent gap between the relations of Local Group GCs and more massive early-type galaxies. It is found that the properties of these massive stellar systems match those of nuclear clusters in dwarf elliptical galaxies and UCDs better than those of Local Group GCs, and that all objects share similarly old ( Gyr) ages, suggesting a possible link between the formation and evolution of dE,Ns, UCDs and massive GCs. We find a very steep correlation between dynamical mass-to-light ratio and dynamical mass of the form above . Formation scenarios are investigated with a chemical abundance analysis using absorption line strengths calibrated to the Lick/IDS index system. The results lend support to two scenarios contained within a single general formation scheme. Old, massive, super-solar [/Fe] systems are formed on short ( Myr) timescales through the merging of single-collapse GCs which themselves are formed within single, giant molecular clouds. More intermediate- and old-aged ( Gyr), solar- to sub-solar [/Fe] systems are formed on much longer (Gyr) timescales through the stripping of dE,Ns in the potential wells of massive galaxies and galaxy clusters.
Subject headings:
galaxies: star clusters: general — globular clusters: general — galaxies: formation — galaxies: evolution — galaxies: stellar content — galaxies: individual: NGC 51281. Introduction
In the past decade, studies of the central regions of the Virgo and Fornax galaxy clusters have revealed dozens of massive compact objects in the luminosity range mag, with half-light radii between 10 and 30 pc and central velocity dispersions km s-1 (Hilker et al., 1999; Drinkwater et al., 2000; Mieske et al., 2002, 2004; Haşegan et al., 2005; Jones et al., 2006; Hilker, 2009). Phillips et al. (2001) dubbed the new objects “ultra-compact dwarf” galaxies (UCDs), a term that was immediately controversial because of the galaxian origin that it implies. The term has since come to describe a “mixed bag of objects”, in the words of Hilker (2009), defined only by observational parameters and saying nothing about evolutionary history. When combined with other structural parameters, these objects show similarities to both massive globular clusters, and nuclear star clusters in dwarf elliptical galaxies (Côté et al., 2006), raising the possibility of a shared formation history among some of these objects. The GC system of the nearby giant elliptical galaxy NGC 5128 offers an interesting target to compare the properties of massive stellar systems to those of typically less massive systems contained within the Local Group. The relatively simple structures of GCs are fairly well approximated by isotropic, single-mass King (1966) models and the structural parameters of these stellar systems such as core- and half-light radii, central concentrations, surface brightnesses, velocity dispersions, mass-to-light ratios, etc., have been shown to inhabit only a narrow region called the fundamental plane (FP; Djorgovski 1995).
While the FP relations are well established for Milky Way GCs, there have been only limited studies done for the properties of GCs in external galaxies. The external galaxy for which similar studies have mostly been done is M31, a disc galaxy similar to the Milky Way. The structures of its GCs appear to share similar properties to those in the Milky Way (Fusi Pecci et al., 1994; Holland, Fahlman, Richer, 1997; Barmby, Holland, Huchra, 2002; Barmby et al., 2007). Djorgovski et al. (1997) undertook one such study and report velocity dispersions for four of the M31 clusters being as high as 20 kms-1, implying masses of the order of the largest galactic globular cluster Cen (Meylan et al., 1995; Sollima et al., 2009). It is interesting to note that both Cen and G1, the largest of the four M31 clusters, share similar peculiarities. Cen is the most flattened galactic globular cluster (White & Shawl, 1987) with significant [Fe/H] differences among its member stars (Norris & Da Costa, 1995; Pancino et al., 2002), two characteristics shared by G1, although it should be noted that G1’s metallicity spread was inferred from the photometric width of the RGB (Meylan et al., 2001).
A possible explanation for the odd properties of these massive clusters is that they could be the nuclei of tidally stripped dwarf elliptical galaxies (dEs; Zinnecker et al., 1988; Hilker & Richtler, 2000; Meylan et al., 2001; Gnedin et al., 2002; Bekki & Freeman, 2003). This idea seems to be supported by studies of massive, compact stellar systems in the Virgo (DGTOs; Haşegan, 2007), and Fornax (UCDs; Drinkwater et al., 2003) galaxy clusters, which appear to share characteristics with both nuclear star clusters in dEs (dE,Ns) and the most massive globular clusters in M31 and the MW. The Virgo and Fornax DGTO/UCDs show a size-luminosity relation similar to that of dE/dE,Ns while having a range of sizes similar to that of massive local GCs (Evstigneeva et al., 2008; Hilker, 2009).
Another explanation is that massive compact systems could be merged young massive clusters (YMCs) produced by violent galaxy-galaxy mergers (Fellhauer & Kroupa, 2002). Mieske et al. (2006) present [Fe/H] estimates from a spectroscopic study of 26 compact objects in the central regions of Fornax which were compared to 5 known Fornax dE,Ns. It was found that the mean metallicities of compact objects with mag are dex higher than for the dE,Ns while their colors suggest that they are generally younger (and/or more metal-poor) than the dwarf nuclei. The mean metallicities agreed much more with those for YMCs of comparable masses, thus consistent with the YMC merging formation scenario. Studies of massive star clusters discovered in the Virgo cluster (Haşegan et al., 2005; Jones et al., 2006) reveal brighter and bluer objects compared to Fornax compact objects and are suggestive of the stripping scenario. These results together imply that both formation scenarios are possible, perhaps even likely, but that what occurs could be dependent on environmental factors such as local galaxy density.
To make progress on the question of the origin of compact stellar systems it is necessary to study clusters that bridge the mass gap between the systems like Cen and G1, and dwarf galaxies in a variety of environments. Being the central galaxy in a large group, NGC 5128 not only provides a less dense environment compared to the central regions of galaxy clusters, but evidence for recent merger activity in the form of the dust lane, faint shells (Malin, 1978), and a young tidal stream (Peng et al., 2002) make it a likely environment for YMCs to be formed. NGC 5128 is also the nearest giant galaxy to the Milky Way beyond M31 and thus it is possible to get high resolution spectra and structural parameters of its large population of star clusters, many of which are at the upper end of the globular cluster mass distribution (Harris et al., 1984, 2002). All of these features make NGC 5128 an interesting target for such a study.
The goal of this work is to study correlations between dynamical properties, such as dynamical masses and mass-to-light ratios, and basic evolutionary parameters, e.g. relative ages, metallicities, and [/Fe] ratios. The ratio of -capture to Fe-peak elements [/Fe]) can provide information on the star formation history (SFH) of stellar populations. Super-solar [/Fe] is indicative of a short burst of SF, typical of GCs and elliptical galaxies, while sub-solar values mean a more quiescient or drawn out SFH. Ages, metallicities, and [/Fe] ratios are usually estimated from integrated-light spectra by the measurement of absorption-line features that have been calibrated to the Lick/IDS index system (Burstein et al., 1984; Worthey et al., 1994; Worthey & Ottaviani, 1997; Trager et al., 1998) and compared to models that assume simple stellar populations (SSPs; see e.g. Thomas et al., 2003a). These parameters then provide useful clues to the evolutionary pasts of the objects.
In this work we measure dynamical masses of compact star clusters in NGC 5128 using a homogeneous analysis method based on the penalized pixel fitting (pPXF) code of Cappellari & Emsellem (2004). The results compare favourably with those of Rejkuba et al. (2007), who derive dynamical masses for 27 objects based on measured using a cross-correlation technique. These dynamical masses are then combined with photometric structural parameters to derive the FP relations and we compare them to those of objects ranging in mass from the smallest Local Group GCs to giant elliptical galaxies. Chemical abundances from the literature for the NGC 5128 objects derived using the Lick/IDS system are used to investigate the ages and star formation histories. These properties, along with dynamical masses and mass-to-light ratios, are directly compared to those for early-type galaxies, UCDs and Local Group GCs.
The paper is organised as follows. §2 summarizes the data and observations. The measurement of is described in §3 as well as the calculations that lead directly to dynamical mass estimates () and both photometric and dynamical mass-to-light ratios ( and ). §4 compares the NGC 5128 clusters to other compact stellar systems using a comparison of key structural parameters, a fundamental plane and -space analysis as well as a comparison of stellar population properties. We conclude with a discussion of the main results in light of the various formation scenarios in §5.
2. Observations
2.1. Instrumental Setup
High resolution spectra of GCs in NGC 5128 were obtained with the UVES spectrograph at the 8.2m Very Large Telescope on Cerro Paranal in Chile. UVES is a two-arm, cross-dispersed echelle spectrograph operating at the Nasmyth B focus of UT2 (Kueyen). The two arms of UVES cover the wavelength ranges 3250–4500 Å and 4700–6800 Å for the blue and red arms respectively. The spectrograph was set to its Dichroic #1 mode for the observations taken in program 69.D-0094 in order to obtain spectra on both arms simultaneously, whereas the spectra obtained in program 69.D-0169 were taken with the red arm only. With the 1″ slit used for all observations, UVES provides a spectral resolution of , corresponding to a velocity resolution FWHM of 7.5 km s-1 ( km s-1). For further details of the UVES operating specifications we refer to Dekker et al. (2000).
2.2. Cluster Sample
Pipeline-reduced high-resolution spectra for 23 globular clusters were obtained from the ESO/UVES archive and are summarized in Table 1, which lists cluster identifications according to Harris et al. (2002) (old) along with the newer, homogeneous identifiers of Woodley et al. (2007) (new), the total integration times, apparent -band magnitudes, and the average S/N over the wavelength ranges used. The total integration times listed are sums of three or four individual sub-exposures taken during the observations. The apparent magnitudes listed are taken from the Peng et al. (2004a) catalogue where available; otherwise, the magnitudes are from the original discovery publications. The airmass was in the range 1.054–1.986 for all cluster observations and the seeing ranged from 0.52″to 1.35″.
2.3. Template Stars
All template stars were observed with the same instrumental setup as the clusters, but with only single exposures of a few seconds each. The template stars cover a spectral range of G0–M0.5 and luminosity classes Iab, Ib, IIa, II, and III as listed in Table 2. The seeing and airmass during the collection of the template spectra were comparable to the cluster observations. All template stars were observed around April 2002 in two separate observing programs with some overlap in their target lists. To increase the S/N, any of the template stars for which multiple observations were made were summed together. Because of the heliocentric corrections applied to the spectra prior to their combination a systematic uncertainty of not more than km s-1 is introduced to the final velocity dispersion measurement. This is added in quadrature to the total error budget resulting from the pPXF analysis (see Sect. 3.2) using the corresponding template star.
2.4. Data Processing
The basic data reduction was done by the ESO-UVES pipeline, which provided flux- and wavelength-calibrated, de-biased spectra that were further processed using a combination of IRAF111IRAF is distributed by the National Optical Astronomy Observatory, which is operated by the Association of Universities for Research in Astronomy, Inc., under cooperative agreement with the National Science Foundation. tasks and IDL programs. The signal-to-noise ratios (S/N) per pixel for all of the clusters and template stars were measured over the wavelength ranges described in §2 using the splot task in IRAF and are listed in Tables 1 and 2. The S/N over the REDL(4800–5750Å) and REDU(5800–6800Å) regions of the spectra were high enough to perform the convolutions for the subsequent velocity dispersion analysis. It was found that the S/N over the BLUE arm (3300–4500Å) was too low for accurate measurements with errors well above the expected velocity dispersion of our target clusters. For this reason the values measured from the BLUE CCD are dropped from the subsequent analysis.
3. Analysis
3.1. Penalized Pixel Fitting
We use the penalized pixel-fitting code (pPXF) described in detail in Cappellari & Emsellem (2004) to measure the line-of-sight velocity dispersion (LOSVD), , of our target GCs. In summary, pPXF expands the LOSVD as a Gauss-Hermite series of the form
| (1) |
where and is the -th Hermite polynomial. pPXF then makes use of an input ‘initial guess’ for the relative radial velocity, , of the template star as well as an estimated for the cluster in order to calculate the best fitting , and the Gauss-Hermite moments for the best fitting LOSVD. The code uses a penalty function that is derived from the integrated square deviation of the line profile from the best-fitting Gaussian. The fit is iterated until the perturbed penalty function cannot decrease the variance of the fit any further. This key feature of pPXF serves to bias the solution towards a Gaussian shape when the S/N is low but allows the solution to reproduce the higher-order details of spectral features when the S/N is high. Features of note, that are implemented in the pPXF routine, include fitting of an optimal template together with the kinematics to minimize the impact of template mismatches as well as an iterative sigma clipping routine that acts to clean the spectra of any residual bad pixels or cosmic rays (see Cappellari & Emsellem, 2004, for details).
In order to maximize the accuracy of the LOSVD measurements the wavelength range of the object spectra was constrained to 500–600 Å sections around prominent features. Extensive experimentation showed that the wavelength regions which provided the most robust results from the REDL and REDU CCDs were 4951–5550Å containing the Mgb triplet and several Fe features, and 5850–6400Å, containing the NaD doublet and two TiO molecular bands. Figure 1 shows a representative sample of our cluster spectra constrained to these regions for both REDL and REDU ranging from the lowest S/N spectra at the top to the highest S/N at the bottom. The spectra were left with enough continuum for pPXF to perform the convolutions up to km s-1.
In order to minimize the input scatter, one of the parameters required by pPXF, , was measured using the fxcor task in IRAF for all of the clusters against each of the template stars. The averaged results, which are in good agreement with those in the literature (e.g Rejkuba et al., 2007; Woodley et al., 2010), are listed in Table 3 along with the standard errors. The measured from fxcor was obtained with Welch filtering using cut-on and cut-off wavenumbers of 0 and 500, respectively, in the constrained regions. Adjusting the filtering parameters can produce small variations in the measured , which might add to uncertainties in the final . To test this, pPXF was used to measure with the input held constant as the input was varied for each cluster against the templates. The results of this test showed that the scatter in the measured values was no more than 1 km s-1, indicating that pPXF is relatively insensitive to variations in assuming that the input is a ‘good’ guess within a few tens of km s-1. Therefore, any uncertainty in measuring the ‘initial guess’ with fxcor should not translate into larger uncertainties of the final measurement.
3.2. LOSVD Measurement
The pPXF code does indicate a sensitivity to very high or low input estimates for , so before any measurements were made, the input was varied between 5–50 km s-1 in steps of 5 km s-1 while was held constant at the measured values. This range was selected because the typical of massive clusters in the Local Group is of the order of km s-1 (Martini & Ho, 2004). For this reason, all of the input estimates are ‘good’ guesses, and account for any under- or over-estimates of the cluster velocity dispersions. The resulting measurements from all template star-GC combinations were clipped to within one standard deviation based on measurements from all 21 templates, which includes any uncertainties from fxcor, the stellar template library, and systematic uncertainties intrinsic to the pPXF code due to template mismatches. For each cluster, the mean of the clipped was calculated and recorded for both REDU and REDL spectral regions. The errors were taken as one standard deviation of the mean-clipped measurements.
Due to the strength and distinctiveness of the Mgb triplet in the REDL spectral range compared to the many, but less distinct, features in the REDU range (5850–6400 Å), the measured has much more robust results from the REDL CCD than from the REDU CCD. Figure 2 (top and lower right panels) shows a comparison of the measurement from both CCDs combined against those from only the REDL or REDU CCD, and against each other. The plots indicate that almost all of the results from both CCDs fall within errors from either of the single CCDs, thus justifying the use of the weighted mean from both CCDs, as listed in Table 6. As as check against the possibility of interstellar absorption affecting the measurements around the NaD regions of the REDU spectra, measurements were made for the representative spectra shown in Fig. 1 as well as the outlier GC0382 (see Fig. 2 both with and without these features. The results suggest a negligible effect for low S/N spectra; however, for higher S/N, could be over-estimated by km s-1, indicating that the larger error bars for the REDU measurements could be at least in part due to interstellar absorption.
The range of measured from our sample was km s-1 with the former measured for GC0217 and the latter for GC0330. Figure 2 (lower left panel) shows the pPXF results against the recorded by Rejkuba et al. (2007), which were obtained using a cross-correlation technique and whose measurements were shown to agree well with those of Martini & Ho (2004). The measurements agree very well for 21 out of the 23 clusters, although we measure significantly higher for the two clusters GC0330 and particularly GC0382. Rejkuba et al. (2007) reported =4.9 km s-1 for GC0382, but this was based on a CCF with multiple peaks due to additional absorption features in the spectrum. They suggest that these abnormalities could be due to spatially unresolved Galactic foreground stars. While we do not offer an explanation for this discrepancy, considering the restricted spectral ranges described above and the fact that pPXF has a certain amount of robustness against features such as these, we tend to prefer our measurements over previous determinations from the literature, but bear in mind the significant confusion regarding this object.
3.3. Structural Parameters
Structural parameters, such as projected core-radius, , the King concentration parameter, c, and the projected half-light radius, Rh, are important for aperture corrections to our LOSVD measurements and are listed in Table 6. For all but the clusters from the Holland et al. (1999) study (with HCH99 designations, see Tbl. 1), Rh and rc were quoted from Harris et al. (2002) and the HCH99 cluster parameters were quoted from their paper. In converting Rh and rc to pc, a distance modulus of =27.880.05 mag, corresponding to a distance of 3.80.1 Mpc, was used for NGC 5128 (Harris et al., 2009).
3.4. Aperture Effects
The central velocity dispersion, , plays a pivotal role in dynamical mass estimates. However, LOSVD measurements in the literature are often performed at various radii depending on the instrumental setup and target sample of the particular study. Because of varying seeing conditions, target distances, and variations in the instrumental specifications, such as spectral and spatial resolution and sampling, the light entering a given aperture may not be representative of the object being observed as a whole and thus the true central velocity dispersion is often inaccessible and must be extrapolated using assumptions on stellar orbit distributions. Mieske et al. (2008) show that aperture corrections for objects in the mass range of massive GCs or UCDs can be significant, and so appropriate corrections were applied to the NGC 5128 objects.
The aperture corrections applied to our data were performed using the code discussed in detail in Hilker et al. (2007) and Mieske et al. (2008), which uses the basic cluster structural parameters that define the shape of the cluster light profile (i.e. Rh and , see Table 6). To create a 3-dimensional stellar density profile, a King surface density profile is assumed, from which the cumulated mass function M(), potential energy , and energy distribution function (E) are computed. The 3-D profile and (E) are then used to create an N-body representation of the cluster; in our case, particles were simulated for each cluster. Each particle is then convolved with a Gaussian corresponding to the seeing during the observations. A light profile is then generated and used to calculate the velocity dispersion at a given radius or within a given aperture.
To estimate the uncertainties of the inferred central velocity dispersions, each of the clusters were modeled three times. Firstly, the code was run using , , and from Table 6 to get . Maximum and minimum values for , and were calculated by adding or subtracting the errors listed in Table 6 which were used to determine the upper and lower uncertainties for by re-modelling the clusters using , and (for ) and , and (for ). The differences between and were then assigned as the upper and lower uncertainties which were then propagated through Eq. 3 to calculate the absolute errors on .
The first two columns of Table 3 show the velocity dispersions measured in our slit apertures, , against those calculated by the models with the cluster structural parameters, , as a demonstration of how well the model reproduces the observed values. We use the model to correct our measurements to the central velocity dispersion, , as listed in the last column of Table 3. The third column of Table 3 shows , which is the predicted by the model if an aperture is used that covers the cluster to the tidal radius.
3.5. Aperture Corrections of Literature Data
Our goal is to compare our sample GCs to other stellar systems. For that purpose we searched the literature for central velocity dispersion measurements. Strader et al. (2009, and references therein) provide measurements for a number of M31 clusters based on high-resolution spectra, all of which have been aperture corrected to the cluster centers using the corrections described in Barmby et al. (2007). Geha et al. (2003) list data for six dEs (five of which are nucleated), which they analyze in two ways. First they model the objects as dEs, fitting a Sérsic model to the surface brightness profile for ″, then as dE,Ns by fitting a Plummer model to the surface brightness profile within ″. While their profile fitting method is not completely consistent with ours, we use their measurements to distinguish, at least, between the core and envelope parameters of nucleated dwarf ellipticals. In the following we break their measurements into three groups: one non-nucleated dE, five dE,Ns (core plus envelope), and only the cores of the same five dE,Ns. Geha et al. (2002) define of the dE,Ns as the velocity dispersion of the nuclei (r 1″), and so in order to analyze the three groups consistently we treat their measurements all as observed values, which are probably lower limits to .
Velocity dispersion measurements for the UCDs come from three different sources. Data for 15 UCDs in the Fornax cluster and 11 in the Virgo cluster were taken from Mieske et al. (2008) and Patrick Côté (private communication) respectively, who both provide aperture corrected using the code of Hilker et al. (2007). An additional six Virgo UCDs were culled from Evstigneeva et al. (2007) who list calculated using a generalized King model, with the exception of one object with a King + Sérsic profile, and aperture corrected to pc.
For early-type galaxies we use the data of Bender et al. (1992) who list for a wide range of elliptical galaxies. In constructing this data set, they take data from many different sources, who all provide either mean-, global-, or central-velocity dispersions and who rarely, if ever, state whether any aperture corrections were applied. So keeping potential biases in mind we use their listed values, which like the dE/dE,Ns, are likely lower limits of the real values.
3.6. Colors, Metallicities and Photometric Mass-to-Light Ratios
To determine a good knowledge of the ages and metallicities of the stellar populations is required, for which basic photometric and spectroscopic properties are needed. The apparent -band magnitudes listed for the clusters in Table 1 were taken from Holland et al. (1999) (HCH99 designations) and Peng et al. (2004a) (all other clusters, see Table 1) and were de-reddened based on the quoted values taken from their respective papers. For the clusters from Peng et al. (2004a), the values ranged from 0.10 to 0.13 mag whereas for the HCH99 clusters a value of 0.11 mag was used based on the reddening maps of Burstein & Heiles (1982). The de-reddened apparent magnitues () are listed in column 2 of Table 4, assuming =3.1. No corrections for internal reddening in NGC 5128 were applied.
In Table 4 we list the , , and colours for the clusters from Peng et al. (2004a); however, for all of the HCH99 clusters, only the colour was available. The metallicities, , listed in column 7 of Table 4 were taken from Beasley et al. (2008), who performed a large spectroscopic study of the globular cluster system of NGC 5128 in order to derive an empirical metallicity distribution function calibrated on Milky Way GCs. The metallicities were derived using a Tukey biweight scheme applied to six Lick indices (Fe4383, Mg2, Mgb, Fe5270, Fe5335, and Fe5406; see Beasley et al., 2008). We use the de-reddened colours and metallicities to compute (see Table 6) and compare those to our dynamically derived mass-to-light ratios.
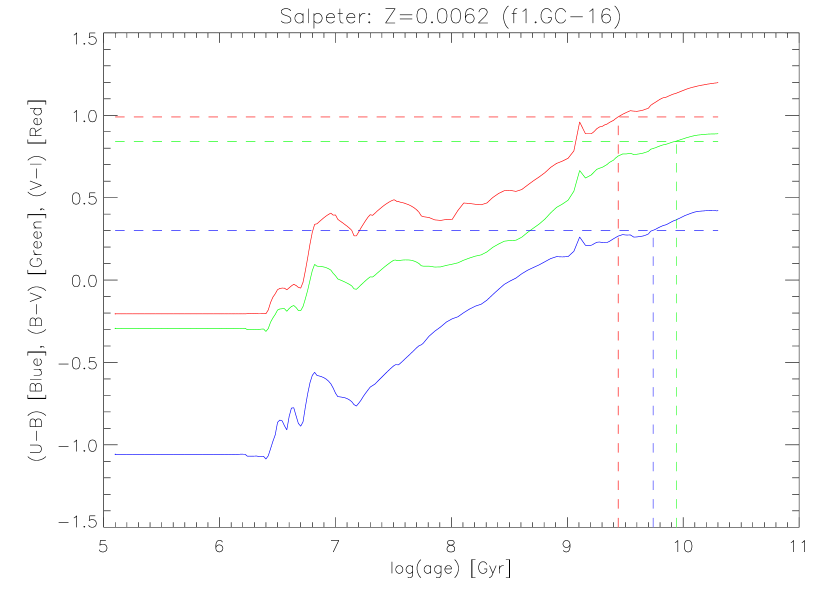
Owing to a lack of published age estimates based on spectroscopy in the literature, we use spectroscopic metallicities which are listed in Beasley et al. (2008) for 16 star clusters from our sample to interpolate the SSP models of Bruzual & Charlot (2003) to the corresponding metallicity, assuming a Chabrier (2003) IMF. We note that the metallicity scale of the Beasley et al. measurements is tied to old Galactic GCs and for younger clusters will systematically overestimate the metallicity values according to to (Worthey, 1999). Figure 3 shows a plot of , , and vs. for the cluster GC0378 (f1.GC-16) with as an illustration of the method. The logarithmic ages from the three colours , , and are , 9.9, and 9.4, respectively, with the mean . This age translates to a photometric mass-to-light ratio of , matching well with our dynamically derived . This exercise was carried out for all 16 clusters and the output and from all interpolations are listed in Table 5. For comparison with the Chabrier IMF results we also list the resulting and assuming a Salpeter (1955) IMF. From Table 5 it can be seen that is on average 60% larger than .
The cluster ages based on alone were always found to be less than the mean of the ages when all three colours were used, and so because reliable values for and could not be found in the literature for the clusters GC0217 and GC0242, the photometric mass-to-light ratios for these two are considered to be highly uncertain.
3.7. Dynamical Masses and Mass-to-Light Ratios
While there are several ways of inferring the total mass of a compact stellar system, the most straightforward approach is the virial theorem (e.g. Binney & Tremaine, 2008). This method relies on the symmetric properties of what are assumed to be relaxed clusters with an isotropic stellar-orbit distribution. The dynamical masses and mass-to-light ratios listed in Table 6 are estimates based on the virial theorem of the form (Spitzer, 1987):
| (2) |
where is the central line-of-sight velocity dispersion, and 3 is the mean-square velocity of the stars. is the half-mass radius of the cluster measured in 3D, which if the assumption is made that luminosity follows mass, can be inferred from the two dimensional projected half-light radius, Rh=. Considering the treatment of the data sets described in §§ 3.4 and 3.5, we therefore re-write Equation 2 as
| (3) |
where the scaling factor depends on the surface brightness profile. We use this virial mass estimator for our subsequent dynamical mass calculations. For galaxies with surface brightness profiles Cappellari et al. (2006) find , which corresponds to a Sérsic index for an isotropic one-component system. To stay consistent with their study we use for our comparison sample of giant early-type galaxies. However, their measurements for M32 indicate that is significantly higher for more compact stellar systems, in the range . They also provide a scaling relation between and the Sérsic index of the form (cf. their Eq. 20) which implies for our GCs and UCDs. A more detailed study of the behavior of as a function of indicates a turnover at very low , typical for King profiles (Côté & McLaughlin, private communication). For both our data and the UCDs with we find to a very good approximation.
With total mass estimates having been calculated, we estimate mass-to-light ratios from the de-reddened apparent -band magnitudes listed in Table 4. The dynamical mass-to-light ratios () were computed by dividing the estimated virial masses by the corresponding -band luminosities
| (4) |
assuming mag. The estimated for the 21 sample clusters, for which mass estimates could be made, range in value between 2.2 and 8.0 (see Table 6). The average of the clusters is 4.2, significantly higher than the median of our M31 sample of , and almost twice that of the median reported by McLaughlin (2000) for Galactic GCs of using in Equation 3, a value appropriate for the more compact LG GCs (see above) and thus assumed for this data set.
4. Discussion
4.1. Comparison with Other Star Clusters
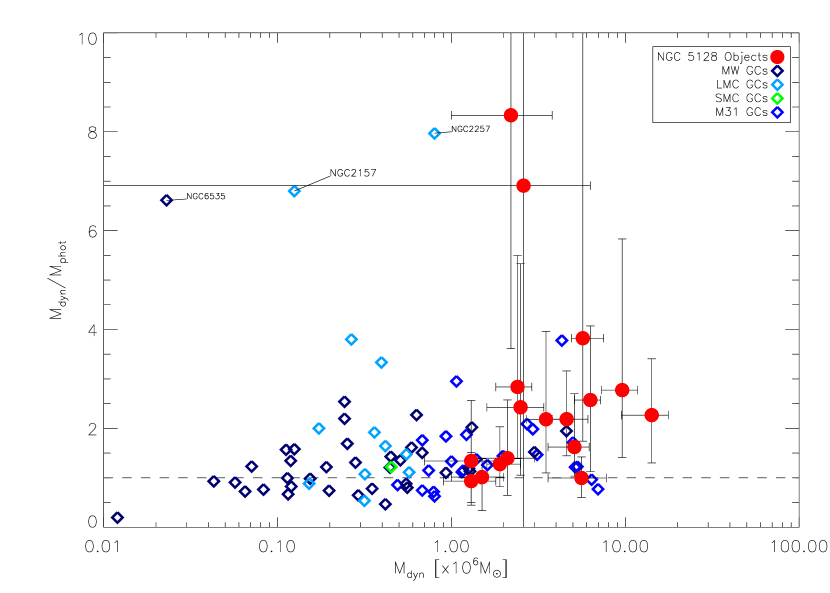
To check for systematic differences between photometric and dynamical mass-to-light ratios in our sample clusters, we plot in Figure 4 the ratios of to against for our sample NGC 5128 objects and Local Group GCs. For the Local Group comparison sample McLaughlin & van der Marel (2005) derived structural parameters for SMC, LMC and the MW GCs using three different profiles. Values for based on the Wilson (1975) profile were chosen because it fits cluster surface brightness profiles at least as well, and often substantially better than the King profiles or power-law models. M31 objects have derived from listed in Strader et al. (2009), and from Barmby et al. (2007) who also provide the values used in Figure 4.
Figure 4 indicates that while many of our sample clusters have to ratios consistent with the bulk of Local Group GCs, our sample has on average , or as much as for the cases of GC0265, GC0217 and GC0242. Possible explanations for the particularly high to ratios include a dark gravitating component, non-equilibrium dynamical processes (e.g. tidal disruption, pre-relaxation, young stellar systems), or/and simply that the values based on SSP models are underestimated due to a younger-than-expected stellar sub-component or an unusual (top- or bottom-heavy) IMF. The latter possibilty was proposed by Dabringhausen et al. (2008) who show that the elevated of massive compact objects with masses cannot be explained by current stellar population models if a canonical IMF is assumed. They suggested that either a bottom-heavy IMF (see Mieske & Kroupa, 2008) or a top-heavy IMF (see Dabringhausen et al., 2009) could be responsible for the discrepancy between dynamical and (canonical) stellar population mass-to-light ratios. However for the cases of GC0265, GC0217 and GC0242, the high values shown in Fig. 4 are most likely due to significantly underestimated photometric ages.
The possibility of a younger-than-expected stellar sub-component has some support from recent work (e.g. Bedin et al., 2004; Piotto, 2008) that goes against the current paradigm that GCs are always made of SSPs but show evidence for a composite stellar population. However, if the ratio were entirely due to age and metallicity this would translate to an age underestimate of Gyr or a metallicity underestimate of [Z/H] dex. Larger offsets would require a combination of even larger age and metallicity mismatches. The spectroscopic metallicity estimates for our sample GCs are expected to be accurate to better than dex, but our rough photometric ages (see Sect. 3.6) could be affected by unknown horizontal-branch morphologies, significant blue-straggler stellar populations, and variable chemical compositions, especially at high metallicities and old ages.
We investigate the option of non-equilibrium stellar kinematics in the form of signatures of tidal disruption in those clusters with high ratios, by studying the outliers in the Local Group GC sample in Figure 4. We find that generally the clusters show indications of being in dynamically non-equilibrium states. In the case of NGC 2157, the cluster is not expected to be relaxed, having an age ( Gyr) less than its median two-body relaxation time ( Gyr) (McLaughlin & van der Marel, 2005). Dieball et al. (2002) performed a statistical study of LMC binary clusters, and multiple cluster systems, finding that many of them could be explained statistically by a chance superposition in the sky. However, some tidally connected binary clusters may introduce non-virial velocity fields which would lead to excess .
As a final check against the dependence of mass-to-light ratio determinations on the choice of surface brightness profiles, the difference between Wilson and King profiles for the McLaughlin & van der Marel (2005) data was investigated. The results showed that although the King profile results in systematically lower ratios, the median difference is only and does not affect our results significantly.
4.2. Fundamental Plane Relations
4.2.1 and Relations
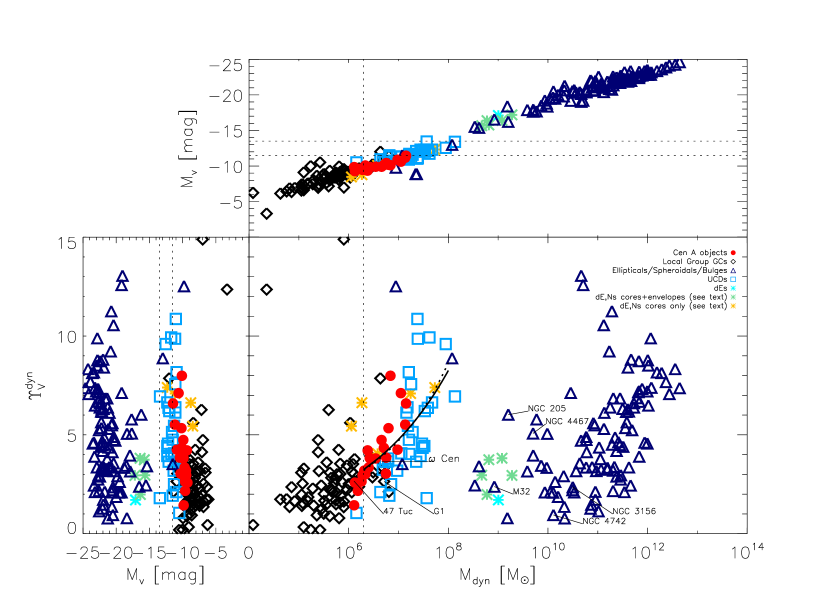
Figure 5 shows the correlations between , , and , while Figure 6 illustrates relations between , , and for our sample GCs as well as Local Group GCs, UCDs, and other early-type galaxies. In Fig. 5, we see that clusters with almost exclusively belong to objects with masses larger than 10, where most of our NGC 5128 GCs reside. We find a strong correlation between and and approximate the following two fitting functions:
| (5) | |||||
| (6) |
for compact stellar systems with using Chauvenet criteria to remove outliers. For the power-law fit in Equation 5 we obtain and with a reduced . For the exponential fit in Equation 6 we get a marginally better reduced and find and . The corresponding relations are illustrated in Figure 5 as dotted (exponential) and solid curves (power-law fit). While the physical cause for this correlation may be due to a non-baryonic component, we point out that is also dependent on the cluster SFH, the IMF, and any changes to the stellar population due to dynamical evolution and the chemical makeup of the constituent stellar components. The detailed discussion of the origin of this trend must await more accurate spectroscopic data.
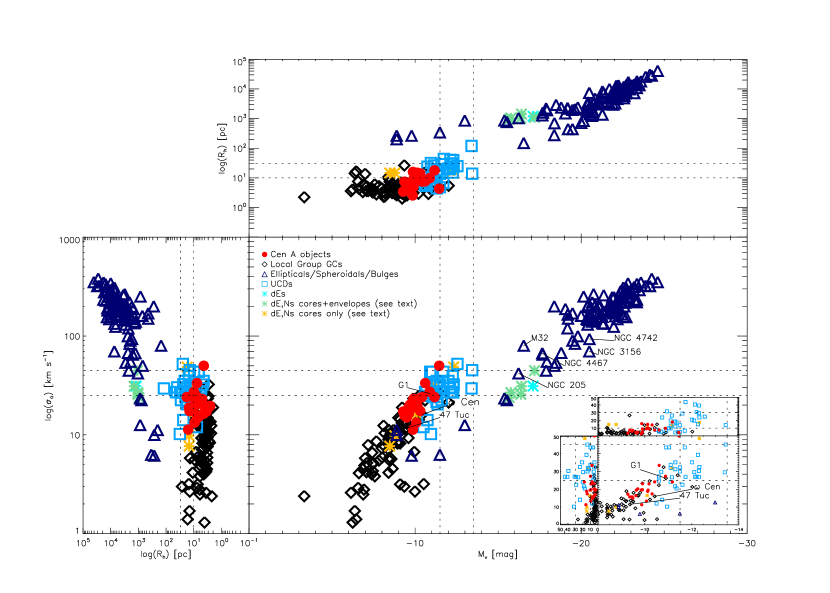
4.2.2 Size-Luminosity Relations
Fig. 6 clearly shows the break in the size-luminosity relation in that the UCDs and dE,N cores all have sizes systematically larger than the Local Group GCs for mag. However, the NGC 5128 sample splits in the region such that 4/12 (see inset of Fig. 6) objects appear to fall along the size-luminosity relation for early-type galaxies, while the rest are more consistent with no size-luminosity relation similar to Local Group GCs. We also note that all of the NGC 5128 objects in this region show sizes that are more consistent with those of low-luminosity UCDs and the dE,N cores, while those objects having show sizes similar to the Local Group globular clusters. Figures 5 and 6 also indicate that while the dE,N cores appear to be similar to massive GCs and UCDs, their envelopes are similar to low-luminosity early-type galaxies (see also Martini & Ho, 2004; Rejkuba et al., 2007).
Mieske et al. (2006) performed a spectroscopic study of compact stellar systems in the Fornax Cluster to investigate possible formation scenarios for this particular type of compact stellar object. A clear break in the metallicity distribution was found at masses of , and mag such that for mag, the mean metallicity is dex higher than for mag. A change in the size-luminosity relation for compact objects, in that scales with luminosity for mag and becomes virtually independent of luminosity for mag, was also reported to accompany the break in metallicity distribution, suggesting the possibility of distinct formation scenarios (Mieske et al., 2006). Mieske et al. (2008) recently revised this break-point to mag and , in agreement with the previously reported mass break of Haşegan et al. (2005), and found that systems with had values roughly twice as large as GCs of mass . This is in good agreement with our results.
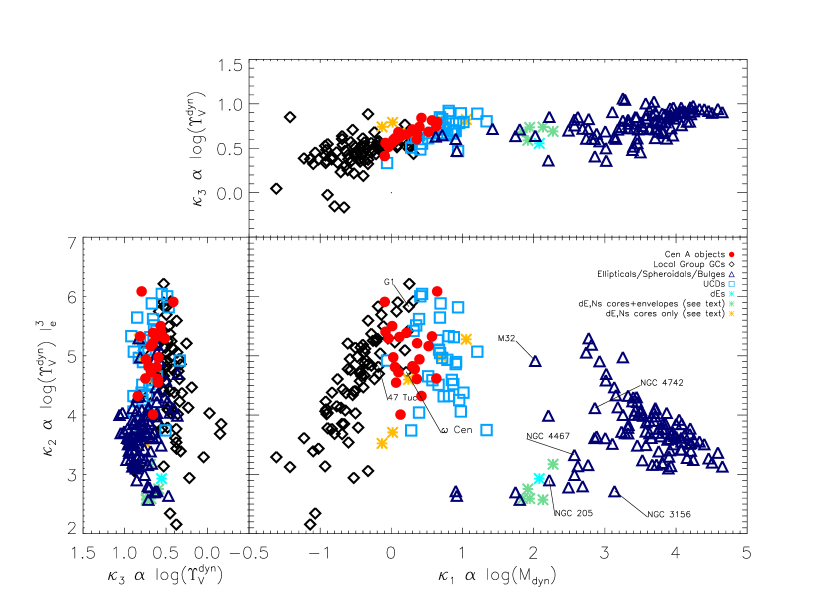
4.3. -space
A common method of investigating the connection between globular clusters and other spheroidal systems is through the adoption of -space parameters. Bender et al. (1992) found that GCs and early-type galaxies fall on two distinct planes in a three-dimensional space defined by the parameters:
| (7) |
| (8) |
| (9) |
where and is the projected half-light radius. As can be seen above, the parameters are defined by luminosity surface density. However, to compare GCs to younger clusters and galaxies, it is more useful to define -space using mass surface density (see McLaughlin et al., 2007b) and to convert to kpc (see Bender et al., 1992). To compute this we use , so that the new -space is defined by:
| (10) |
| (11) |
| (12) |
Figure 7 shows the -space with the above mass surface density formalism. The data used for this plot are identical to those used for Figs. 5 and 6 (see §§ 3.3-3.5). In order to ensure that all of the combined data are as consistent as possible, only the most central measurements were taken from the respective papers. It was found that by simply culling , and absolute magnitude, from the sources enabled to be calculated in a consistent manner. Using Equation 3 to calculate combined with gives , which with provides , yielding all of the parameters necessary to construct the -space. The fundamental plane for GCs is typically analyzed using population synthesis models, which provide that is combined with other structural parameters to construct the fundamental plane. However, in the conversion from luminosity to mass surface density for , we use rather than for the reasons discussed in §4.1.
In the space, there is a clear separation between the Local Group GCs and the elliptical galaxies (see also Martini & Ho, 2004). Figure 7 shows the two distinct planes corresponding to ‘classical’ GCs and galaxies ranging in mass from dE and dSph to giant ellipticals. Our NGC 5128 clusters appear systematically more massive than the Local Group GCs, with many encroaching upon the region of -space inhabited by the UCDs, and even sharing the space containing the nuclei of dE,Ns studied by Geha et al. (2003). The UCDs, being typically more massive than the NGC 5128 objects, fall clearly within the gap, suggesting a common formation mechanism between the most massive GCs and other compact stellar systems. The possibility that some massive GCs really are the remnants of dE,Ns that have been tidally stripped may have some support from the discrepancy between and , as some of these objects may be in the process of having their dark matter halos stripped.
4.4. Stellar Population Properties
In this section we investigate the chemical compositions of our sample of NGC 5128 systems by comparing absorption line strengths of several age and metallicity indicators to those of ‘classical’ GCs, UCDs and various early-type galaxies. The objects analyzed in this section are a sub-sample of those used in the above dynamical analysis and include all of the same objects for which both chemical enrichment and dynamical data are available. We point out that we compare here dynamical properties with the chemical makeup of our target clusters that were obtained with two different instruments. It is, therefore, likely that these measurements sample different physical regions. Hence, our subsequent analysis may be prone to dynamical and stellar-population gradients in the clusters. However, for most Local Group GCs this will not affect the results as dynamical relaxation will wipe out any radial gradient within a few Gyr. Nevertheless, we keep in mind that for more massive and extended systems (, see e.g. Binney & Tremaine, 2008) this may introduce biases if radial stellar-population gradients exist.
4.4.1 The Absorption Line Index Data
In order to investigate the chemical compositions, we have chosen to adopt the Lick/IDS standard system. The Lick system was originally introduced by Burstein et al. (1984) to investigate elemental abundances when using intermediate-resolution integrated light spectra of massive, extra-galactic stellar systems.
The Lick data used for this analysis come from multiple sources and are as follows. Data for the NGC 5128 clusters were taken from Beasley et al. (2008) who provide measurements of 23 indices for a large sample of the NGC 5128 GC population all of which have had the relevant corrections applied and have been calibrated to the passband definitions of Worthey et al. (1994) and Worthey & Ottaviani (1997).
Data for a total of 39 LG GCs were gathered from many different sources. Measurements of 16 indices were taken from Puzia et al. (2002), Beasley et al. (2002), and Schiavon et al. (2005) for the 23 MW GCs, while values for 20 indices are provided by Beasley et al. (2002) for six GCs associated with the LMC. Ten additional GCs, eight of which are associated with M31 were added to the LG sample from Beasley et al. (2004) and Trager et al. (1998); however, it should be noted that the values for the four indices H and CN1,2 were not always available for these ten clusters. In all cases except for data from Schiavon et al. (2005), the data were fully corrected and calibrated to the passband system of Worthey et al. (1994) and Worthey & Ottaviani (1997). Due to the complicated nature of measuring the Lick indices of extra-galactic objects, it is not always possible to obtain reliable measurements of all 25 line indices for every object in any given study as evidenced by the combined data set described above. In the case of the Schiavon et al. (2005) data, measurements were available for only 16 indices; however Puzia et al. (2002) and Beasley et al. (2002) provide some of the missing measurements for five overlapping clusters, and so those values are used where necessary.
With the Local Group GCs populating the lower end of the mass range for a comparative sample, Lick data for early-type galaxies were taken from Trager et al. (1998), Ogando et al. (2008) and Kuntschner (2000). A total of 76 objects from the Trager et al. (1998) dataset was found to overlap with objects for which we have dynamical data derived in this study, and another eight objects were provided by Ogando et al. (2008). Trager et al. (1998) provide measurements for 19 indices with seven objects missing H, Fe, and Mg index measurements in varying combinations. The data provided by Ogando et al. (2008) include 11 index measurements, with only the H, three Mg, six Fe, and the NaD indices available. Neither Trager et al. (1998) nor Ogando et al. (2008) provide measurements of the H and H indices, although it was found that they were measured by Kuntschner (2000) for four of the Trager et al. (1998) galaxies. We therefore include those data in any relevant plots.
Analogous to the previous dynamical comparisons, data for objects that bridge the mass-gap between GCs and early-type galaxies were culled from Evstigneeva et al. (2007) and Geha et al. (2003). Specifically, measurements of the H, Mgb, Fe5270, Fe5335 indices as well as the [MgFe]′ and Fe indicators for seven UCDs and five dE,Ns in the Virgo cluster are taken from those two papers respectively. For both sets of objects, the line widths were calculated using the passband definitions of Worthey 94/97 with the spectra degraded to the Lick resolution and all corrections applied according to the prescription given in that paper. The data for the dE,Ns were not corrected for internal velocity dispersions; however the corrections themselves were significantly smaller than the broadening function used (Geha et al., 2003).
4.4.2 Chemical Composition of Stellar Systems
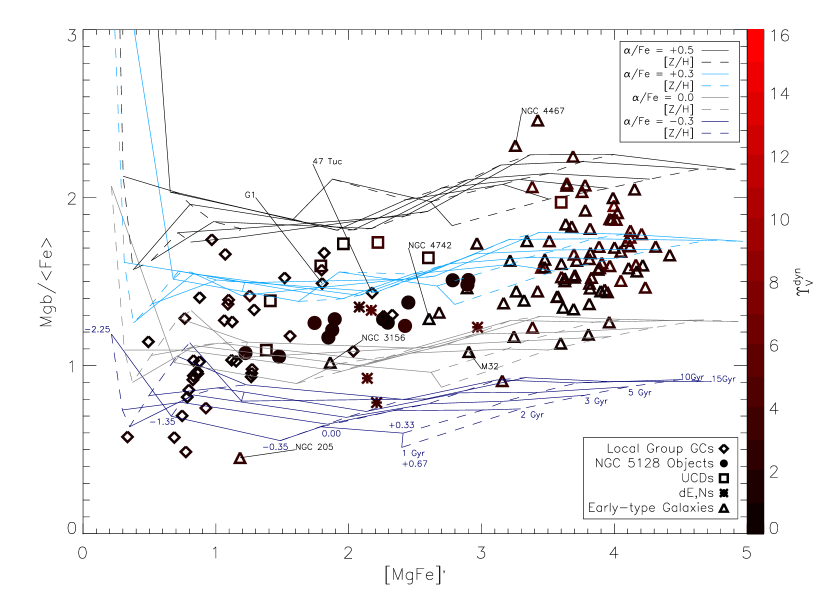
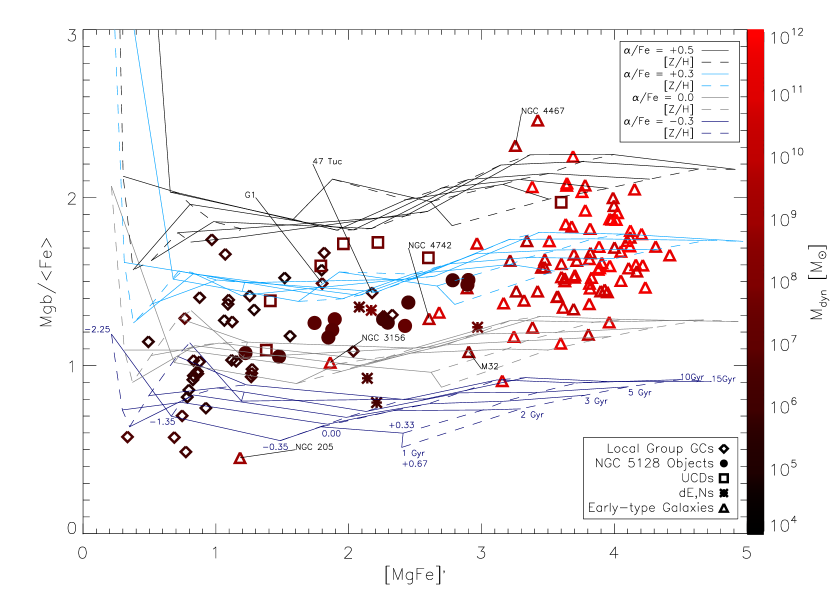
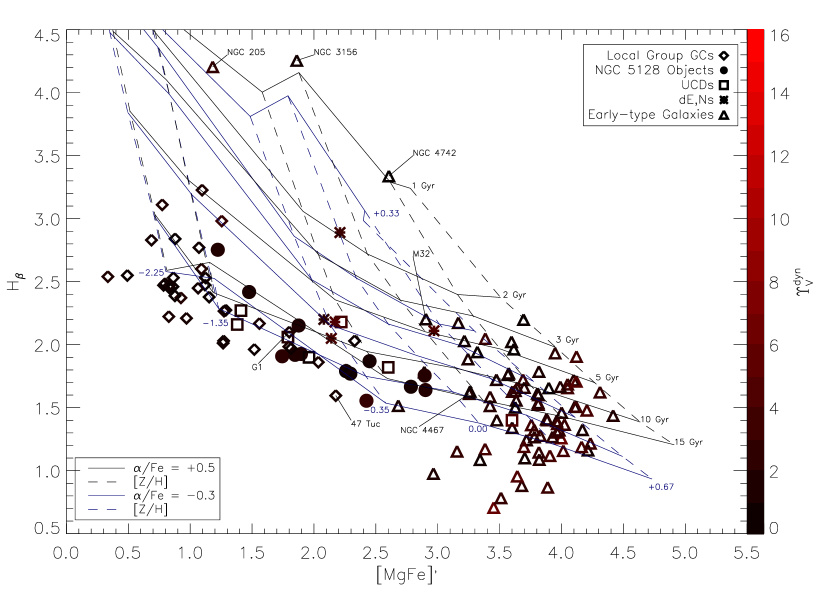
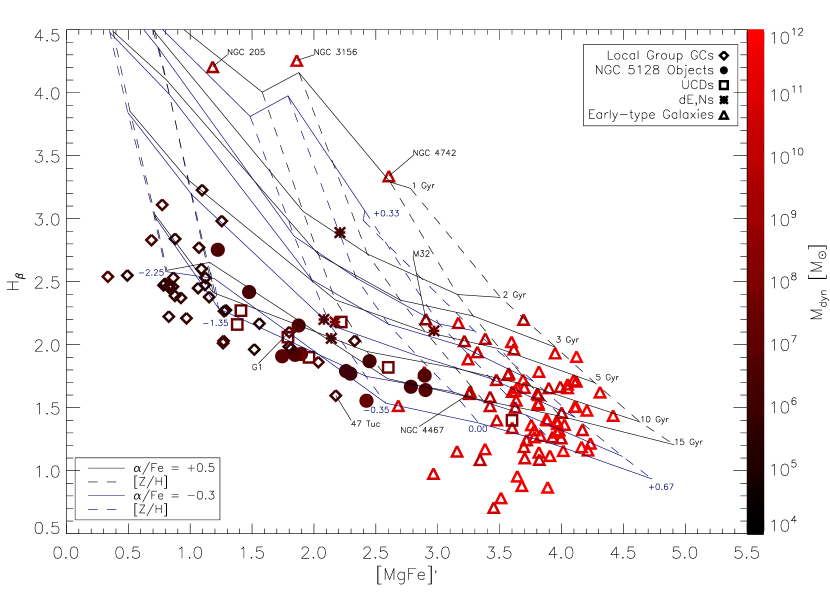
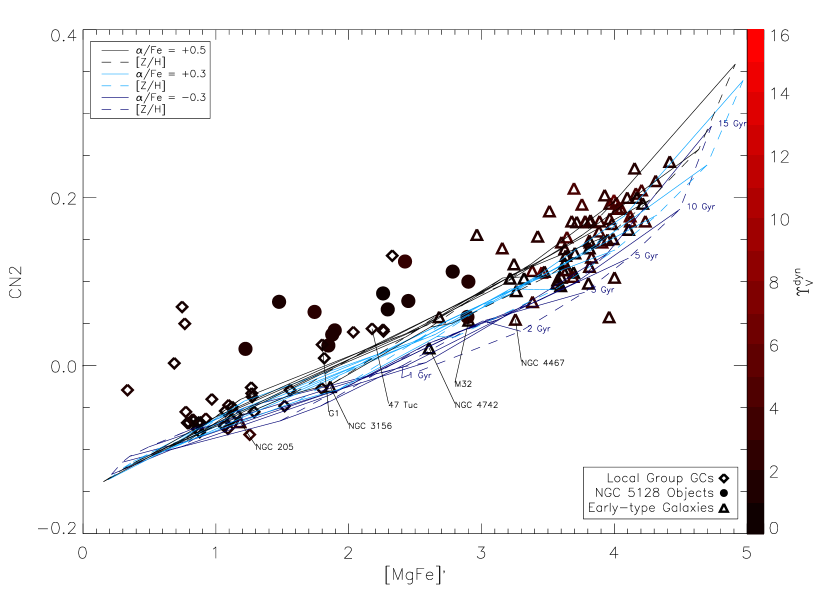
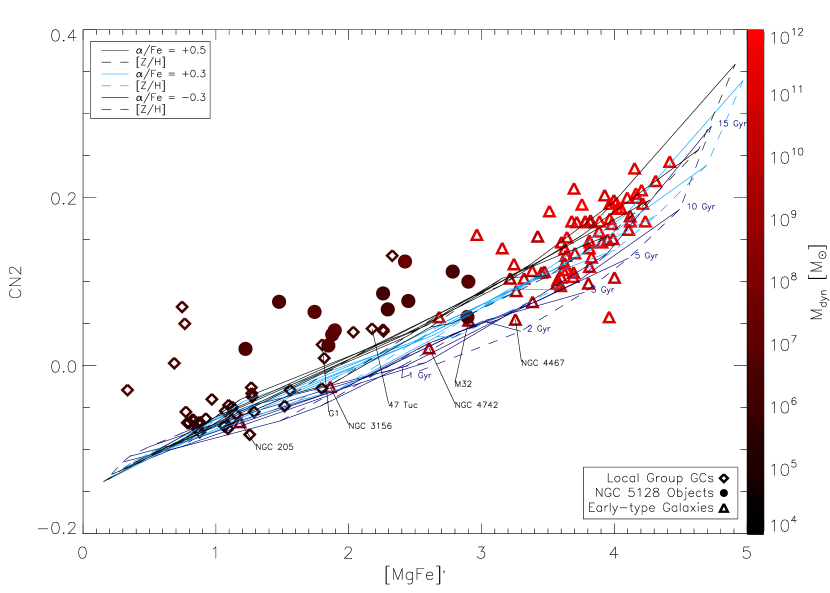
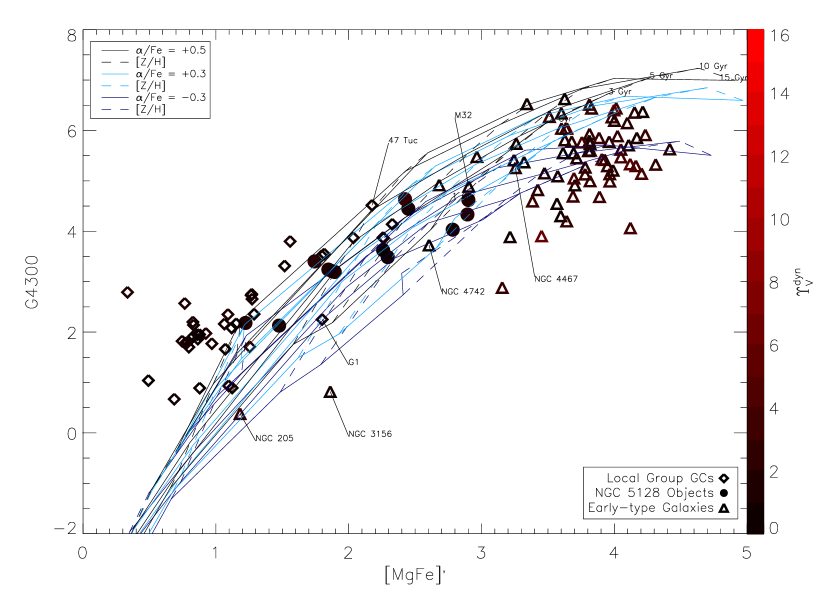
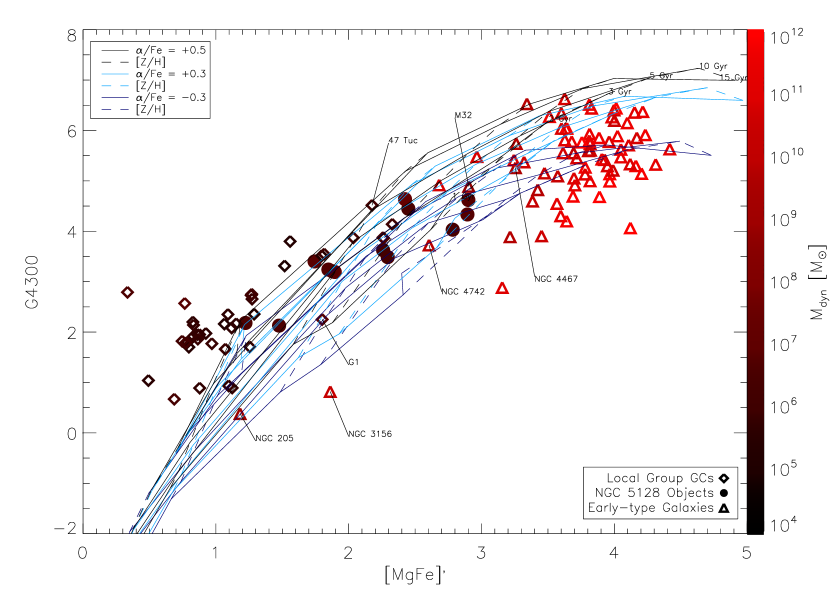
Figures 8-11 show various diagnostic diagrams for the sample described above, with the colour gradients parameterized by (top panels) and (bottom panels). In all cases, the plots are shown with the SSP model tracks of Thomas et al. (2003a) for different ages, [Z/H] and [/Fe] ratios. SSP isochrones are shown for ages of 1, 2, 3, 5, 10 and 15 Gyrs and for [/Fe] values of and 0.5 dex. For each isochrone and iso-[/Fe] track, dashed lines of iso-metallicity are shown for [Z/H] = 0.00, 0.33, and 0.67 dex.
Balmer lines are often used as age indicators in this kind of diagnostic because of the assistance they provide in breaking the age-metallicity degeneracy of SSP models (e.g. Puzia, 2003; Schiavon et al., 2005). The Lick system provides definitions for five Balmer lines (H, H, H, H, H), out of which we use H as the best age indicator due to both the sparse availability of H and H measurements for early-type galaxies and the relative insensitivity to [/Fe] that it shows compared to the other Balmer lines (Thomas et al., 2004).
The star formation histories of stellar populations are often inferred through [/Fe] estimates. -elements are produced predominantly by type-II supernovae early in the star formation history of the population, while Fe-peak elements have a more drawn out enrichment history due to the longer lifetimes of type-Ia SN progenitors (e.g. Greggio et al., 2008). Thus, super-solar abundance ratios should be expected of populations that have experienced a brief history of star formation and are typical of early-type galaxies (Trager et al., 2000; Thomas et al., 2005), while solar and sub-solar abundance ratios indicate more prolonged chemical enrichment processes.
Figure 8 shows a plot of the index ratio MgFe, where Fe, against the [/Fe]-insensitive metallicity indicator [MgFe]′ (Thomas et al., 2003a). It can be seen that the UCDs (open squares) almost exclusively have super-solar [/Fe] ratios between +0.3 and +0.5 dex, with only one indicating a solar abundance ratio, while the majority of the NGC 5128 objects (filled circles) and dE,Ns (asterisks) indicate significantly less -enhanced stellar populations with some of the dE,Ns even indicating sub-solar ratios. The discrepancy between these populations is most likely due to different star formation histories. However, it has also been suggested that a combination of changing IMF slope and binary fraction could have a significant effect on [/Fe] ratios (e.g. Trager et al., 1998; Puzia, 2003).
In Figure 9 we show the age-sensitive Balmer index H plotted against [MgFe]′. Local Group GCs, UCDs and NGC 5128 objects all appear to share similarly old ages ( 8 Gyrs). More interesting are the metallicities of the UCDs and NGC 5128 objects which are significantly lower than those of the ellipticals, yet similar to the most metal-rich Local Group GCs. If these objects represent the stripped remains of dE,Ns, then they should show metallicities similar to their progenitor dE galaxies, unless the objects were stripped of their gas before their initial star formation was complete (i.e. Mieske et al., 2006). In this case, there would be no opportunity for self-enrichment, and their metallicities would tend toward lower values in the present day unless the protocluster environments were such that the objects were pre-enriched to higher metallicities before the onset of star formation processes that created the star cluster (Bailin & Harris, 2009).
Figures 10 and 11 show plots of CN2 and G4300 as functions of [MgFe]′. There are two CN indices, CN1 and CN2, defined by the Lick system and together they trace the strength of the CN absorption band at 4150Å (Puzia, 2003). While both CN indices give similar results, CN2 avoids the H line which leads to a more accurate prediction of the CN index strength, especially for 1 Mg 2 Å (Thomas et al., 2003a). For this reason we choose to use CN2 for the diagnostic plots. The G4300 index mainly traces the abundance of carbon in the G band, but also serves to trace oxygen at of the carbon sensitivity for giant ellipticals. When shown together with the model tracks in Figure 10, it can be seen that the NGC 5128 objects appear to have CN abundances consistent with, if not slightly higher than, the Local Group GCs. On average they lie above the model tracks when compared to early-type galaxies at the same metallicities, which can be interpreted as an over-abundance of CN. It is interesting to note that a large population of CN-enriched stars has been observed in Cen (Hilker & Richtler, 2000, for example), hinting that it may be related to other, more massive, compact objects. However, while the CN over-abundances could be due to an over-abundance of carbon, when the C-tracing G4300 index is plotted against [MgFe]′in Figure 11, the NGC 5128 objects fall closer to the model predictions, suggesting that the offset may in fact be due to a difference in N abundance.
4.5. Formation of Massive Compact Star Clusters
Since UCDs were first discovered in the Virgo and Fornax clusters in the past decade, studies of these compact stellar systems, in particular those undertaken by Mieske et al. (2006) and Haşegan et al. (2005), have come a long way in classifying them consistently in terms of structural parameters. Recent studies have garnered empirical evidence for a ‘break-point’ between UCDs and more classical GCs at and absolute magnitude mag in that, above this mass limit, increases and there are changes in both the metallicity distributions and the size-luminosity relations (Haşegan et al., 2005; Kissler-Patig et al., 2006; Mieske et al., 2006, 2008). Various formation scenarios have been proposed for these objects, the most popular being that they are either the remnant cores of tidally stripped dE,Ns or the end results of merged massive young clusters. Both scenarios have been supported by studies of Virgo and Fornax cluster UCDs respectively (e.g. Fellhauer & Kroupa, 2002; Haşegan et al., 2005; Jones et al., 2006; Mieske et al., 2006), although the idea that UCDs are simply the brightest, most massive GCs remains the most straight-forward explanation (e.g. Mieske et al., 2004; Martini & Ho, 2004).
Hilker (2009) discusses the implications of the various formation scenarios. He suggests that a general formation scheme can be considered in light of a mass break-point of a few ; below this mass limit clusters can be considered to be “single-collapse” globular clusters (SCGCs), while above it the formation physics predict “multiple-collapse” globular clusters (MCGCs). In the case of SCGCs, the present day objects would be expected to host a SSP comprised of stars sharing both the same age and metallicity, i.e. ‘classical’ GCs, while for MCGCs, the timescales of formation can vary from Myr to Gyr, thus, allowing for chemically distinct multiple stellar generations with a range of ages.
If the most massive GCs form within the most massive giant molecular clouds (GMCs), and the most massive GMCs form in/around the most massive galaxies (from purely statistical arguments), then it naturally follows that the most massive clusters would be found preferentially near massive galaxies such as NGC 5128, or near the central galaxies in clusters like Fornax and Virgo. If multiple SCGCs are formed through the fragmentation of a massive GMC, then a MCGC would form through the merging of the SCGCs on a timescale of Myr. A MCGC formed through this channel would result in a single-aged stellar population, probably with similar metallicities (Hilker, 2009). On the other hand, if a timescale of Gyr is invoked, the idea of stripped dE,Ns could be explained if the nuclear clusters are formed through gradual merging of ‘classical’ GCs, or if there are periods of star formation triggered by gas being funneled to the centre of a gas-rich galaxy. Regardless of what mechanism allowed the massive clusters to grow, the evolution over a Hubble time in the tidal field of a potential well can result in objects with structural properties similar to UCDs.
The NGC 5128 clusters of this study show similarities to both Local Group GCs and to the structural definition of UCDs. However, since no single cluster shares all of the parameters that describe UCDs (according to Hilker, 2009) we hesitate to re-define any of them as such. Instead, these objects serve as a sample that falls in the ‘grayest area’ between the two populations and as such are perfect tools to probe any chemodynamical evolutionary connections between them.
The ages of the objects are indicated by Figure 9 to all be old ( Gyr, Fig. 9), while Figure 8 shows a range in [/Fe] ratios, consistent with super-solar to solar values. The more metal-rich NGC 5128 clusters have metallicities similar to those of the nuclear clusters of dE,Ns and for the most part share similar [/Fe] ratios. In contrast, the [/Fe] ratios of most UCDs are significantly higher and, therefore, exclude the possibility of dE,N cores as their progenitors. These chemical features make NGC 5128 GCs consistent with the idea that part of the sample may be stripped dE,Ns if the nuclear clusters have formed through one of the mechanisms described above. The generally older ages of the NGC 5128 objects compared to the dE,N cores also lend weight to this interpretation. Interestingly, the three most metal-rich clusters have super-solar [/Fe] and slightly younger ages than the others, suggestive of shorter SFHs. These features are consistent with a monolithic, fractional collapse and subsequent merging of massive GMCs. On all counts, the least massive clusters of our GC sample show similarities to the ‘classical’ GCs in the Local Group and should probably be considered as such.
5. Conclusions
In the past decade, massive compact objects with structural properties similar to both Local Group globular clusters and nuclear star clusters of dwarf galaxies have been found and studied extensively near the central regions of massive galaxy clusters. These objects show indications of evolutionary pasts similar to the other compact systems and much work has been done to investigate any connection between the various populations. The nearby massive elliptical galaxy NGC 5128 provides an interesting laboratory to look for and study objects like these, primarily because of its proximity ( Mpc, Harris et al., 2009), but also because it is the central massive galaxy in a group and has undergone (relatively) recent mergers. Consequently, it provides an environment that could form UCDs with both of the current popular formation mechanisms: stripping of galaxy cores and merging of star clusters.
In this work we study line of sight velocity dispersions for 23 massive stellar systems in NGC 5128, derived from high-resolution spectra from two observing programs on the 8.2 meter ESO/VLT telescope UT2 (Kueyen) with UVES using the penalized pixel-fitting code of Cappellari & Emsellem (2004). The aperture corrected central velocity dispersions for a subsample of 21 clusters are used to derive dynamical mass estimates and are combined with other structural parameters in order to compare them to Local Group GCs, UCDs, and early-type galaxies. The star formation histories of the objects are also investigated using chemical abundances derived from Lick/IDS indices.
The absence of dark matter in Local Group GCs is generally accepted (e.g. Moore, 1996). This paradigm is being challenged at the higher end of the mass distribution in that clusters of mass require either a top/bottom heavy IMF or dark matter components to explain their higher mass-to-light ratios. Our results support this finding in that, above this mass break, the begins to increase significantly , see Sect. 4.2) and approaches those derived for UCDs found in the Fornax and Virgo galaxy clusters. If one requires that UCDs share all of the structural parameters described by Hilker (2009), then no GCs of our sample can be defined as such. However all but the lowest masses in the sample are clearly transitional objects between the GC and UCD populations, while UCDs themselves have been described as transitional objects between GCs and early-type galaxies if an evolutionary connection truly exists.
Hilker (2009) refers to UCDs as a “mixed bag of objects”, but in light of this study the expression may be even better suited to our sample of objects. The lowest-mass clusters in our sample represent the ‘classical’ GCs of the Local Group in every aspect, without requiring dark matter or any combination of strange IMF, composite stellar populations or galactic interaction to explain their observed parameters. Thus, we consider them to be typical single-collapse GCs. The objects falling above confirm the mass break reported by Haşegan et al. (2005) in that their high mass-to-light ratios begin to require non-baryonic components. Most of these objects share metallicities similar to those of the dE,N cores; combined with the ages and [/Fe] ratios, these objects support the notion that they are the present-day remnants of dE,Ns that have been stripped of their envelopes. Three of our NGC 5128 objects indicate short SFHs by having super-solar [/Fe] ratios; combined with slightly lower ages compared to the other objects, thus is suggestive of the merging of single-collapse GCs, that possibly formed from a fragmented massive GMC. Altogether, our results are consistent with the interpretation of Hilker (2009) – single vs. multiple-collapse formation – as well as formation by the tidal stripping of dE,Ns in massive potential wells (Zinnecker et al., 1988; Hilker & Richtler, 2000; Meylan et al., 2001; Gnedin et al., 2002; Bekki & Freeman, 2003; Drinkwater et al., 2003; Haşegan, 2007). More observations of transitional objects such as these in galaxy clusters and massive galaxies like NGC 5128 will hopefully serve to further constrain the formation mechanisms, and advance our understanding of the evolutionary processes of massive, compact spheroidal systems.
6. Acknowledgments
We thank Patrick Côté for providing measurements for some of the UCD data prior to publication and for helpful discussions. Many thanks go out to Michele Cappellari for providing his pPXF code and valuable advice on its usage. We thank the anonymous referee for a constructive report that helped to improve the paper. MAT acknowledges support through the Co-Op program at the Herzberg Institute of Astrophysics. THP acknowledges support in form of a Plaskett Research Fellowship at the Herzberg Institute of Astrophysics. WEH and GLHH acknowledge support from the Natural Sciences and Engineering Research Council of Canada.
References
- Bailin & Harris (2009) Bailin, J., Harris, W. E. 2009, ApJ, 695, 1082
- Barmby, Holland, Huchra (2002) Barmby, P., Holland, S. T., & Huchra, J. P. 2002, AJ, 123, 1937
- Barmby et al. (2007) Barmby, P., McLaughlin, D. E., Harris, W. E., Harris, G. L., & Forbes, D. A 2007, AJ, 133, 2764
- Beasley et al. (2002) Beasley, M. A., Hoyle, F., & Sharples, R. 2002, MNRAS, 336, 168
- Beasley et al. (2004) Beasley, M. A., Brodie, J. P., Strader, J., Forbes, D. A., Proctor, R. N., Barmby, P., & Huchra, J. P., 2004, AJ, 128, 1623
- Beasley et al. (2008) Beasley, M. A., Bridges, T., Peng, E., Harris, W. E., Harris, G. L. H., Forbes, D. A., & Mackie, G. 2008, MNRAS, 386, 1443
- Bedin et al. (2004) Bedin, L. R., Piotto, G., Anderson, J., Cassisi, S., King, I. R., Momany, Y., & Carraro, G. 2004, ApJ, 605, 125
- Bekki & Freeman (2003) Bekki, K., & Freeman, K. C. 2003, MNRAS, 346, L11
- Bender et al. (1992) Bender, R., Burstein, D., & Faber, S. M. 1992, ApJ, 399, 462
- Binney & Tremaine (2008) Binney, J., & Tremaine, S. 2008, Galactic Dynamics: Second Edition
- Bruzual & Charlot (2003) Bruzual, G., & Charlot, S. 2003, MNRAS, 344, 1000
- Burstein & Heiles (1982) Burstein D., Heiles C. 1982, AJ109,543
- Burstein et al. (1984) Burstein, D., Faber, S. M., Gaskell, C. M., & Krumm, NM. 1984, ApJ, 287, 586
- Cappellari & Emsellem (2004) Cappellari, M., & Emsellem, E. 2004, PASP, 116, 138
- Cappellari et al. (2006) Cappellari, M., et al. 2006, MNRAS, 366, 1126
- Chabrier (2003) Chabrier, G. 2003, PASP, 115, 763
- Côté et al. (2002) Côté, P., West, M. J., & Marzke, R. O., 2002, ApJ, 567, 853
- Côté et al. (2006) Côté, P., Piatek, S., Ferrarese, L., Jordán, A., Merritt, D., Peng, E. W., Haşegan, M., Blakeslee, J. P., Mei, S., West, M. J., Milosavljević, M., & Tonry, J. L., 2006, ApJS, 165, 57
- Dabringhausen et al. (2008) Dabringhausen, J., Hilker, M., & Kroupa, P., 2008, MNRAS, 386, 864
- Dabringhausen et al. (2009) Dabringhausen, J., Kroupa, P., & Baumgardt, H. 2009, MNRAS, 394, 1529
- D’Antona et al. (1983) D’Antona, F., Gratton, R., & Chieffi, A. 1983, Mem. Soc. Astron. Italiana, 54, 173
- Decressin et al. (2007a) Decressin, T., Meynet, G., Charbonnel, C., Prantzos, N., & Ekström, S. 2007a, A&A, 464, 1029
- Decressin et al. (2007b) Decressin, T., Charbonnel, C., & Meynet, G. 2007b, A&A, 475, 859
- Dekker et al. (2000) Dekker, H. et al. 2000, SPIE, 4008, 534
- Dieball et al. (2002) Dieball, A., Muller, H., & Grebel, E. K. 2002, A&A391, 547
- Djorgovski (1995) Djorgovski, S. 1995, ApJ, 438, L29
- Djorgovski et al. (1997) Djorgovski, S. G., Gal, R. R., McCarthy, J. K., et al. 1997, ApJ, 474, L19
- Drinkwater et al. (2000) Drinkwater, M. J., Jones, J. B., Gregg, M. D., & Phillips, S. 2000, PASA, 17, 227
- Drinkwater et al. (2003) Drinkwater, M. J., Gregg, M. D., Hilker, M., Bekki, K., Couch, W. J., Ferguson, H. C., Jones, J. B., & Phillips, S. 2003, Nature, 423, 519
- Evstigneeva et al. (2007) Evstigneeva, E. A., Gregg, M. D., Drinkwater, M. J., Hilker, M. 2007, AJ, 133, 1722
- Evstigneeva et al. (2008) Evstigneeva, E. A., Drinkwater, M. J., Peng, C. Y., Hilker, M., Propis R. De, Jones, J.B., Phillipps, S., Gregg, M. D., & Karick, M. 2008, AJ, 136, 461
- Fellhauer & Kroupa (2002) Fellhauer, M., Kroupa, P., 2002, ”AstroPhysics and Space Science”, 281, 355
- Fenner et al. (2004) Fenner, Y., Campbell, S., Karakas, A. I., Lattanzio, J. C., & Gibson, B. K. 2004, MNRAS, 353, 789
- Fusi Pecci et al. (1994) Fusi Pecci, F., et al. 1994, A&A, 284, 349
- Geha et al. (2002) Geha, M., Guhathakurta, P., & van der Marel, R. P. 2002, AJ, 124, 3073
- Geha et al. (2003) Geha, M., Guhathakurta, P., & van der Marel, R. P. 2003, AJ, 126, 1794
- Gnedin et al. (2002) Gnedin, O. Y., Zhao, H., Pringle, J. E., Fall, S. M., Livio, M., & Meylan, G. 2002, ApJ, 568, L23
- Goerdt et al. (2008) Goerdt, T., Moore, B., Kazantzidis, S., Kaufmann, T., Macció, A. V., & Stadel, J. 2008, MNRAS, 385, 2136
- González (1993) González, J. J. 1993, PhD Thesis, 172
- Greggio et al. (2008) Greggio, L., Renzini, A., & Daddi, E. 2008, MNRAS, 388, 829
- Harris et al. (1984) Harris, G. L. H., Hesser, J. E., Harris, H. C., & Curry, P. J. 1984, ApJ, 287, 175
- Harris et al. (2002) Harris, W. E., Harris, G. L. H., Holland, S. T., & McLauglin, D. E. 2002, AJ, 124, 1435
- Harris et al. (2009) Harris, G. L. H., Rejkuba, M., & Harris, W. E. 2010, PASA in press (arXiv:0911.3180)
- Haşegan et al. (2005) Haşegan, M., et al. 2005, ApJ, 627, 203
- Haşegan (2007) Haşegan, I. M. 2007, PhD Thesis
- Henderson et al. (2007) Henderson, S., Miller, B. W., Harris, W., & Lotz, J. M. 2007, Bulletin of the American Astronomical Society, 38, 897
- Hilker et al. (1999) Hilker, M., Infante, L., Vieira, G., Kissler-Patig, M., & Richtler, T. 1999, A&AS, 134, 75
- Hilker & Richtler (2000) Hilker, M., Richtler, T. 2000, A&A, 362, 895
- Hilker et al. (2007) Hilker, M., Baumgardt, H., Infante, L., Drinkwater, M., Evstigneeva, E., & Gregg, M. 2007, A&A, 463, 119
- Hilker (2009) Hilker, M. 2009, in ”Globular Clusters - Guides to Galaxies”, eds. T. Richtler & S. Larsen, ESO Astrophysics Symposia (Springer), p. 51
- Holland, Fahlman, Richer (1997) Holland, S., Fahlman, G. G., & Richer, H. B. 1997, AJ, 114, 1488
- Holland et al. (1999) Holland, S., Coté, P., & Hesser, J. E. 1999, A&A, 348, 418
- Illingworth (1976) Illingworth, G. 1976, ApJ, 204, 73
- Jones et al. (2006) Jones, J. B., et al. 2006, AJ, 131, 312
- Karakas et al. (2006) Karakas, A. I., Fenner, Y., Sills, A., Campbell, S. W., & Lattanzio, J. C. 2006, ApJ, 652, 1240
- Karakas & Lattanzio (2007) Karakas, A., & Lattanzio, J. C. 2007, Publications of the Astronomical Society of Australia, 24, 103
- King (1966) King, I. R. 1966, AJ, 71, 64
- Kissler-Patig et al. (2006) Kissler-Patig, M., Jordán, A., & Bastian, N., 2006, A&A, 448, 1031
- Kuntschner (2000) Kuntschner, H. 2000, MNRAS, 315, 184
- Malin (1978) Malin, D. R. 1978, Nature, 276, 591
- Martini & Ho (2004) Martini, P., & Ho, L. C. 2004, ApJ, 610, 233
- Mashchenko & Sills (2005) Mashchenko, S., Sills, A. 2005, ApJ, 619, 243
- McLaughlin (2000) McLaughlin, D. E. 2000, ApJ, 539, 618
- McLaughlin & van der Marel (2005) McLaughlin, D. E., & van der Marel, R. P. 2005, ApJ, 161, 304
- McLaughlin et al. (2007b) McLaughlin, D. E., Harris, W. E., Barmby, P., Forbes, D. A., & Harris, G. L. H. 2007b, MNRAS, submitted
- McLaughlin et al. (2008) McLaughlin, D. E., Barmby, P., Harris, W. E., Forbes, D. A., & Harris, G. L. H. 2008, MNRAS, 384, 563
- Meylan et al. (1995) Meylan, G., Mayor, M., Duquennoy, A., & Dubath, P. 1995, A&A, 303, 761
- Meylan et al. (2001) Meylan, G., Sarajedini, A., Jablonka, P., et al. 2001, AJ, 131, 830
- Mieske et al. (2002) Mieske, S., Hilker, M., & Infante, L. 2002, A&A, 383, 823
- Mieske et al. (2004) Mieske, S., Hilker, M., & Infante, L. 2004, A&A, 418, 445
- Mieske et al. (2006) Mieske, S., Hilker, M., Infante, L., & Jordán, A. 2006, AJ, 131, 2442
- Mieske et al. (2008) Mieske, S., Hilker, M., Jordán, A., Infante, L., Kissler-Patig, M., Rejkuba, M., Richtler, T., Côté, P., Baumgardt, H., West, M. J., Ferrarese, L., & Peng, E. W. 2008, A&A, 487, 921
- Mieske & Kroupa (2008) Mieske, S., & Kroupa, P. 2008, ApJ, 677, 276
- Miller et al. (2008) Miller, B. W., Lotz, J., Hilker, M., Kissler-Patig, M., & Puzia, T. 2008, IAU Symposium, 246, 429
- Moore (1996) Moore, B. 1996, ApJ, 461, L13
- Norris & Da Costa (1995) Norris, J. E. & Da Costa, G. S. 1995, A&A, 447, 680
- Ogando et al. (2008) Ogando, R. L. C., Maia, M. A. G., Pellegrini, P. S., & Da Costa, L. N. 2008, AJ, 135, 2424
- Origlia et al. (2002) Origlia, L., Rich, M. R., & Castro, S. 2002, AJ, 123, 1559
- Pancino et al. (2002) Pancino, E., Pasquini, L., Hill, V., Ferraro, F. R., & Bellazzini, M. 2002, ApJ, 568, L101
- Phillips et al. (2001) Phillips, S., Drinkwater, M. J., Gregg, M. D., Jones, J. 2001, ApJ, 560, 201
- Piotto (2008) Piotto, G. 2008 Mem. S.A.It. in press, arXiv:0801.3175
- Peng et al. (2002) Peng, E. W., Ford, H. C., Freeman, K. C., & White, R. L. 2002, AJ, 124, 3144
- Peng et al. (2004a) Peng, E. W., Ford, H. C., & Freeman, K. C. 2004a, ApJS, 150, 367
- Pumo et al. (2009) Pumo, M. L., Ventura, P., D’Antona, F., & Zappala’, R. A. 2009, arXiv:0902.0913
- Puzia et al. (2002) Puzia, T. H., Saglia, R. P, Kissler-Patig, M., Maraston, C., Greggio, L., Renzini, A., & Ortolani, S. 2002, A&A, 395, 45
- Puzia (2003) Puzia, T. H. 2003, PhD Thesis
- Rejkuba et al. (2007) Rejkuba, M., Dubath, P., Minniti D., & Meylan, G. 2007, A&A, 469, 147
- Renzini & Voli (1981) Renzini, A., & Voli, M. 1981, A&A, 94, 175
- Renzini (1983) Renzini, A. 1983, Mem. Soc. Astron. Italiana, 54, 335
- Salpeter (1955) Salpeter, E. E., 1955, ApJ, 121, 161
- Schiavon et al. (2005) Schiavon, R. P., Rose, J. A., Courteau, S., & MacArthur, L. A. 2005, ApJS, 160, 163
- Sollima et al. (2009) Sollima, A., Bellazzini, M., Smart, R. L., Correnti, M., Pancino, E., Ferraro, F. R., & Romano, D. 2009, arXiv:0904.0571
- Spitzer (1987) Spitzer, L. 1987, Dynamical evolution of globular clusters (Princeton, NJ: Princeton University Press), 191
- Strader et al. (2009) Strader, J., Smith, G. H., Larsen, S., Brodie, J. P., Huchra, J.P. 2009, AJ, 138, 547
- Thomas et al. (2003a) Thomas, D., Maraston, C., & Bender, R. 2003a, MNRAS, 339, 897
- Thomas et al. (2004) Thomas, D., Maraston, C., & Korn, A. 2004, MNRAS, 315, L19
- Thomas et al. (2005) Thomas, D., Maraston, C., Bender, R., & Mendes de Oliveira, C. 2005, ApJ, 621, 673
- Trager et al. (1998) Trager, S. C., Worthey, G., Faber, S. M., Burstein, D., & González, J. J. 1998, ApJS, 116, 1
- Trager et al. (2000) Trager, S. C., Faber, S. M., Worthey, G., & González, J. J. 2000, AJ, 119, 1645
- White & Shawl (1987) White, R. E., & Shawl, S. J. 1987, ApJ, 317, 246
- Wilson (1975) Wilson, C. P. 1975,AJ, 80, 752
- Woodley et al. (2007) Woodley, K., Harris, W. E., Beasley, M. A., Peng, E. W., Bridges, T. J., Forbes, D. A. & Harris, G. L. H. 2007, AJ, 134, 494
- Woodley et al. (2010) Woodley, K. A., Harris, W. E., Puzia, T. H., Gómez, M., Harris, G. L. H., & Geisler, D. 2010, ApJ, 708, 1335
- Worthey et al. (1994) Worthey, G., Faber, S. M., González, J. J., & Burstein, D. 1994, ApJS, 94, 687
- Worthey & Ottaviani (1997) Worthey, G., & Ottaviani, D. L. 1997, ApJS, 111, 377
- Worthey (1999) Worthey, G. 1999, Spectrophotometric Dating of Stars and Galaxies, 192, 283
- Zinnecker et al. (1988) Zinnecker, H., Keable, C. J., Dunlop, J. S., Cannon, R. D., & Griffiths, W. K. 1988, The Harlow-Shapley Symposium on Globular Cluster Systems in Galaxies, 126, 603


| Cluster ID | Cluster ID | Exp. Time | Prog. ID | RA | DEC | V | S/N | S/N |
|---|---|---|---|---|---|---|---|---|
| [old] | [new] | [sec] | [J2000] | [J2000] | [mag] | [REDL] | [REDU] | |
| f1.GC13 | GC0372 | 1800 | 69.D-0196 | 13 26 07.8 | 51 59.7 | 18.35 | 4 | 4 |
| f1.GC16 | GC0378 | 1800 | 69.D-0196 | 13 26 10.6 | 53 43.0 | 18.43 | 4 | 4 |
| f1.GC22 | GC0382 | 1800 | 69.D-0196 | 13 26 15.8 | 55 01.0 | 18.09 | 5 | 5 |
| f1.GC23 | GC0397 | 1800 | 69.D-0196 | 13 26 23.8 | 54 01.6 | 18.41 | 4 | 4 |
| f2.GC23 | GC0232 | 1800 | 69.D-0196 | 13 25 32.7 | 07 02.1 | 18.77 | 3 | 4 |
| f2.GC26 | GC0218 | 1800 | 69.D-0196 | 13 25 30.5 | 11 49.8 | 18.56 | 3 | 4 |
| f2.GC61 | GC0150 | 1800 | 69.D-0196 | 13 25 13.0 | 07 59.9 | 18.20 | 3 | 4 |
| f2.GC81 | GC0123 | 1800 | 69.D-0196 | 13 25 05.8 | 10 30.4 | 17.74 | 3 | 4 |
| HCH99-C2 | GC0171 | 1200 | 69.D-0196 | 13 25 16.4 | 02 06.7 | 18.21 | 3 | 3 |
| HCH99-C15 | GC0213 | 1200 | 69.D-0196 | 13 25 29.9 | 00 03.9 | 17.56 | 3 | 4 |
| HCH99-C16 | GC0217 | 1800 | 69.D-0196 | 13 25 30.1 | 59 35.4 | 18.45 | 2 | 2 |
| HCH99-C18 | GC0225 | 1200 | 69.D-0196 | 13 25 31.6 | 00 01.8 | 17.07 | 5 | 6 |
| HCH99-C21 | GC0242 | 1200 | 69.D-0196 | 13 25 34.4 | 03 26.5 | 18.41 | 2 | 2 |
| HGHH92-C1 | GC0005 | 2400 | 69.D-0196 | 13 23 44.0 | 11 13.5 | 17.42 | 3 | 3 |
| HGHH92-C7 | GC0365 | 18000 | 69.D-0094 | 13 26 05.2 | 56 32.9 | 17.17 | 8 | 12 |
| HGHH92-C11 | GC0077 | 2400 | 69.D-0196 | 13 24 54.6 | 01 22.8 | 17.91 | 2 | 3 |
| HGHH92-C17 | GC0265 | 23400 | 69.D-0094 | 13 25 39.6 | 55 58.2 | 17.63 | 11 | 11 |
| HGHH92-C21 | GC0320 | 1200 | 69.D-0196 | 13 25 52.7 | 05 46.6 | 17.87 | 3 | 3 |
| HGHH92-C22 | GC0326 | 1800 | 69.D-0196 | 13 25 53.3 | 59 07.6 | 18.15 | 4 | 5 |
| HGHH92-C23 | GC0330 | 23400 | 69.D-0094 | 13 25 54.3 | 59 25.4 | 17.22 | 10 | 11 |
| HGHH92-C29 | GC0041 | 1200 | 69.D-0196 | 13 24 40.4 | 18 03.9 | 18.15 | 3 | 4 |
| HGHH92-C41 | GC0040 | 1800 | 69.D-0196 | 13 24 38.9 | 20 05.6 | 18.59 | 3 | 5 |
| HGHH92-C44 | GC0227 | 3600 | 69.D-0196 | 13 25 31.8 | 19 23.6 | 18.69 | 3 | 4 |
Note. — The listed targets are globular clusters in NGC 5128 that are part of our sample. Col. (1) lists the cluster ID according to the literature sources, col. (2) lists the new, homogeneous IDs of Woodley et al. (2007), col. (3) lists the total integration time in seconds, col. (4) lists the program IDs for the original spectra and cols. (5) and (6) list the right ascension and declination in J2000 coordinates. Cols. (7) shows the apparent cluster V magnitudes not corrected for foreground reddening, while cols. (8) and (9) show the average S/N per pixel over the spectral regions used.
| Star | Spec. Type | Exp. Time | Prog. ID | RA | DEC | S/N | S/N |
|---|---|---|---|---|---|---|---|
| [sec] | [J2000] | [J2000] | [REDL] | [REDU] | |||
| HD33771 | G0 | 165 | 69.D-0196 | 05 10 49.7 | 37 49 04.1 | 10 | 19 |
| HD66141 | K2III | 10 | 69.D-0196 | 08 02 16.0 | +02 20 07.1 | 4 | 7 |
| HD81797 | K3II-III | 5 | 69.D-0196 | 09 27 35.2 | 08 39 29.2 | 3 | 5 |
| HD93529 | G7w | 120 | 69.D-0196 | 10 47 29.1 | 25 26 13.4 | 8 | 15 |
| HD103295 | G5/6III | 75 | 69.D-0196 | 11 53 26.9 | 28 38 12.0 | 8 | 15 |
| HD146051 | M0.5III | 2 | 69.D-0196 | 16 14 20.6 | +03 54 32.0 | 3 | 5 |
| HD150798 | K2II-III | 1 | 69.D-0196 | 16 48 39.6 | 69 01 40.8 | 3 | 5 |
| HD161096 | K2III | 1 | 69.D-0196 | 17 43 28.4 | +04 34 03.1 | 3 | 6 |
| HD165195 | K3p | 25 | 69.D-0196 | 18 04 39.9 | +03 46 47.2 | 7 | 14 |
| HD168454 | K3IIIa | 1 | 69.D-0196 | 18 20 59.7 | 29 49 40.2 | 3 | 6 |
| HD171391 | G8III | 10 | 69.D-0196 | 18 35 02.2 | 10 58 39.3 | 5 | 9 |
| HD196983 | K2III | 100 | 69.D-0196 | 20 41 50.6 | 33 53 18.4 | 4 | 6 |
| HD203638 | K0III | 30 | 69.D-0196 | 21 24 09.4 | 20 51 07.8 | 4 | 6 |
| HR4614 | G3Ib | 2 | 69.D-0094 | 12 06 20.5 | 68 39 07.8 | 4 | 7 |
| HR5293 | K4II | 4 | 69.D-0094 | 14 10 31.1 | 70 18 18.5 | 3 | 5 |
| HR5461 | K0.5II | 2 | 69.D-0094 | 14 40 33.1 | 56 26 28.5 | 4 | 8 |
| HR5547 | G8II | 2 | 69.D-0094 | 15 00 11.0 | 77 09 40.7 | 5 | 9 |
| HR5891 | G5IIa | 1 | 69.D-0094 | 15 55 29.9 | 68 36 09.9 | 4 | 7 |
| HR6856 | K2II | 2 | 69.D-0094 | 18 20 55.2 | 37 29 17.4 | 3 | 6 |
| HR7277 | K0Iab | 2 | 69.D-0094 | 19 13 13.6 | 25 54 23.0 | 3 | 6 |
| HR7586 | K4II | 3 | 69.D-0094 | 19 56 57.6 | 57 55 33.3 | 3 | 5 |
Note. — Template stars used in the velocity dispersion measurements. Col. (1) lists the star IDs and col. (2) lists the spectral type. Cols. (3-6) lists the exposure times, program ID, right ascensions and declinations while cols. (7) and (8) give the average S/N per pixel over the spectral regions used.
| Object | |||||
|---|---|---|---|---|---|
| [km s-1] | [kms-1] | [kms-1] | [kms-1] | [kms-1] | |
| GC0372 | 69910 | 16.51.8 | 16.6 | 15.4 | 20.2 |
| GC0378 | 60810 | 14.21.3 | 14.2 | 12.8 | 16.4 |
| GC0382 | 58210 | 14.33.2 | 14.3 | 14.0 | 17.5 |
| GC0397 | 40210 | 15.61.4 | 15.8 | 14.6 | 19.5 |
| GC0232 | 77610 | 14.12.1 | 14.0 | 13.1 | 17.2 |
| GC0218 | 64010 | 12.71.6 | 12.7 | 11.4 | 15.0 |
| GC0150 | 61210 | 15.91.2 | 16.1 | 15.2 | 19.6 |
| GC0123 | 43610 | 14.91.4 | 14.9 | 12.4 | 17.4 |
| GC0171 | 29610 | 16.31.8 | 16.1 | 14.1 | 18.8 |
| GC0213 | 51910 | 27.53.2 | 27.6 | 26.4 | 33.4 |
| GC0217 | 45911 | 10.96.3 | 10.9 | 9.3 | 11.3 |
| GC0225 | 45210 | 22.01.2 | 21.7 | 19.1 | 24.1 |
| GC0242 | 66110 | 12.11.4 | 12.1 | 11.2 | 13.3 |
| GC0005 | 64510 | 15.91.6 | |||
| GC0365 | 59411 | 23.72.4 | 23.8 | 21.6 | 27.3 |
| GC0077 | 74910 | 16.71.5 | 16.7 | 14.7 | 19.5 |
| GC0265 | 78710 | 20.82.9 | 20.9 | 19.8 | 24.1 |
| GC0320 | 45510 | 20.01.4 | 19.9 | 17.7 | 23.0 |
| GC0326 | 57510 | 19.41.8 | 19.4 | 18.4 | 23.1 |
| GC0330 | 66910 | 41.53.7 | 41.6 | 39.8 | 50.0 |
| GC0041 | 72410 | 17.61.8 | 17.6 | 15.4 | 19.7 |
| GC0040 | 36110 | 13.71.3 | 13.7 | 12.4 | 15.7 |
| GC0227 | 49611 | 13.61.2 | 13.5 | 12.5 | 15.7 |
Note. — Radial velocities measured with fxcor with ’s measured by pPXF and modeled by the aperture correction code of Hilker et al. (2007). Col. (2) lists , while col. (3) shows the observed measured with pPXF and col. (4) shows the observed predicted by the code for comparison. The other two columns show the global and central ’s predicted by the aperture correction code.
| Cluster ID | ||||||
|---|---|---|---|---|---|---|
| [new] | [mag] | [mag] | [mag] | [mag] | [mag] | |
| GC0372 | 18.04 | 0.070.04 | 0.730.01 | 0.850.03 | 9.70 | 0.0012 |
| GC0378 | 18.09 | 0.300.04 | 0.840.01 | 0.990.03 | 9.62 | 0.0062 |
| GC0382 | 9.96 | |||||
| GC0397 | 18.10 | 0.210.04 | 0.780.01 | 0.910.03 | 9.64 | |
| GC0232 | 18.43 | 0.230.07 | 0.800.02 | 0.950.03 | 9.28 | 0.0034 |
| GC0218 | 18.19 | 0.350.06 | 0.890.02 | 1.030.03 | 9.49 | 0.0065 |
| GC0150 | 17.83 | 0.310.05 | 0.830.01 | 0.990.03 | 9.85 | 0.0058 |
| GC0123 | 17.40 | 10.31 | ||||
| GC0171 | 17.87 | 0.221.01 | 0.740.27 | 0.840.09 | 10.12 | |
| GC0213 | 17.42 | 1.060.08 | 10.61 | |||
| GC0217 | 18.13 | 0.790.08 | 9.87 | 0.0006 | ||
| GC0225 | 16.83 | 0.112.54 | 0.890.78 | 0.890.22 | 11.17 | |
| GC0242 | 17.91 | 0.780.08 | 10.07 | 0.0060 | ||
| GC0005 | 0.0008 | |||||
| GC0365 | 16.83 | 0.170.03 | 0.750.01 | 0.910.03 | 10.88 | 0.0025 |
| GC0077 | 17.54 | 0.390.05 | 0.940.01 | 1.120.03 | 10.14 | 0.0088 |
| GC0265 | 17.29 | 0.140.04 | 0.770.01 | 0.880.03 | 10.42 | 0.0030 |
| GC0320 | 17.53 | 0.220.04 | 0.780.01 | 0.920.03 | 10.18 | 0.0025 |
| GC0326 | 17.81 | 0.160.05 | 0.790.02 | 0.910.03 | 9.90 | 0.0020 |
| GC0330 | 16.88 | 0.450.04 | 0.960.01 | 1.100.03 | 11.45 | 0.0079 |
| GC0041 | 17.75 | 0.410.04 | 0.890.01 | 1.080.03 | 9.90 | 0.0092 |
| GC0040 | 18.19 | 0.400.06 | 0.890.02 | 1.090.03 | 9.46 | 0.0077 |
| GC0227 | 18.32 | 0.060.04 | 0.690.01 | 0.850.03 | 9.36 | 0.0009 |
Note. — The stellar clusters observed. Col. (1) lists the cluster ID, while the de-reddened apparent magnitudes are listed in col. (2) based on =3.1, using quoted from Peng et al. (2004a). Values for GCs 0171, 0213, 0217, 0225 and 0242 were quoted from Holland et al. (1999). Cols. (3-5) show the de-reddened , , and color indices (where available) and col. (6) are the absolute -band magnitudes, while col. (7) shows the values from Beasley et al. (2008). The uncertainty of is 0.05 mag based on =27.880.05 (see § 3.3).
| ID | ||||
|---|---|---|---|---|
| [Gyr] | [Gyr] | |||
| GC0372 | 9.9 | 2.7 | 9.9 | 1.4 |
| GC0378 | 9.7 | 2.5 | 9.7 | 2.2 |
| GC0232 | 9.9 | 2.9 | 9.9 | 1.9 |
| GC0218 | 9.9 | 3.7 | 10.0 | 2.3 |
| GC0150 | 9.7 | 2.5 | 9.8 | 1.5 |
| GC0123 | 3.0 | |||
| GC0217 | 9.3∗ | 0.8∗ | 9.4∗ | 0.6∗ |
| GC0242 | 9.1∗ | 0.6∗ | 9.1∗ | 0.4∗ |
| GC0365 | 9.8 | 2.2 | 9.9 | 1.6 |
| GC0077 | 10.1 | 4.7 | 10.0 | 2.7 |
| GC0265 | 9.5 | 1.5 | 9.6 | 1.0 |
| GC0320 | 10.0 | 3.1 | 10.0 | 2.1 |
| GC0326 | 9.9 | 2.8 | 10.0 | 1.7 |
| GC0330 | 10.0 | 4.7 | 10.1 | 2.9 |
| GC0041 | 10.0 | 4.3 | 9.9 | 2.2 |
| GC0040 | 9.9 | 3.8 | 10.0 | 2.4 |
| GC0227 | 9.9 | 2.3 | 10.0 | 1.5 |
Note. — Clusters marked with ∗ only had data available, and so the age and are expected to be uncertain. Cluster GC0123 had a photometric listed in McLaughlin et al. (2008) who used a Wilson model fit with a Chabrier (2003) disk-IMF.
| ID | rc | c | |||||||
|---|---|---|---|---|---|---|---|---|---|
| [km s-1] | [km s-1] | [km s-1] | [ ] | [/] | [/] | [pc] | [pc] | ||
| GC0372 | 16.51.8 | 15.71.9 | 20.2 | 2.5 | 3.3 | 1.4 | 3.540.348 | 0.680.297 | 2.00 |
| GC0378 | 14.21.3 | 12.60.8 | 16.4 | 1.5 | 2.2 | 2.2 | 3.260.131 | 0.580.109 | 1.87 |
| GC0382 | 14.33.2 | 4.91.1 | 17.5 | 1.1 | 2.140.315 | 0.580.297 | 1.70 | ||
| GC0397 | 15.61.4 | 14.21.1 | 19.5 | 1.8 | 2.6 | 2.730.263 | 0.500.198 | 2.20 | |
| GC0232 | 14.12.1 | 14.41.5 | 17.2 | 1.3 | 2.6 | 1.9 | 2.580.324 | 0.500.394 | 2.00 |
| GC0218 | 12.71.6 | 11.10.7 | 15.0 | 2.1 | 3.2 | 2.3 | 5.230.718 | 1.180.206 | 1.90 |
| GC0150 | 15.91.2 | 14.60.7 | 19.6 | 1.3 | 3.2 | 1.5 | 1.920.383 | 0.400.197 | 2.00 |
| GC0123 | 14.91.4 | 13.10.5 | 17.4 | 5.6 | 3.0 | 3.0 | 10.601.51 | 1.180.206 | 2.40 |
| GC0171 | 16.31.8 | 14.10.5 | 18.8 | 6.9 | 8.0 | 11.191.05 | 0.970.105 | 1.50 | |
| GC0213 | 27.53.2 | 21.31.7 | 33.4 | 11.2 | 7.1 | 5.740.170 | 1.530.104 | 1.00 | |
| GC0217 | 10.96.3 | 9.51.4 | 11.3 | 2.6 | 3.8 | 0.6 | 11.890.520 | 0.800.159 | 1.60 |
| GC0225 | 22.01.2 | 21.21.1 | 24.1 | 13.6 | 5.5 | 13.460.162 | 1.140.014 | 1.50 | |
| GC0242 | 12.11.4 | 10.62.3 | 13.3 | 2.2 | 3.0 | 0.4 | 7.002.52 | 2.521.02 | 0.80 |
| GC0005 | 15.91.6 | 12.90.8 | |||||||
| GC0365 | 23.72.4 | 21.10.1 | 27.3 | 9.6 | 4.3 | 1.6 | 7.360.098 | 1.390.108 | 1.83 |
| GC0077 | 16.71.5 | 19.20.4 | 19.5 | 5.1 | 4.3 | 2.7 | 7.660.095 | 1.280.108 | 1.88 |
| GC0265 | 20.82.9 | 20.91.6 | 24.1 | 5.7 | 3.9 | 1.0 | 5.590.117 | 2.230.106 | 1.43 |
| GC0320 | 20.01.4 | 19.00.1 | 23.0 | 6.3 | 5.3 | 2.1 | 6.830.105 | 1.190.109 | 1.86 |
| GC0326 | 19.41.8 | 17.90.1 | 23.1 | 3.5 | 3.8 | 1.7 | 3.730.128 | 1.080.109 | 1.62 |
| GC0330 | 41.53.7 | 30.50.2 | 50.0 | 14.2 | 6.6 | 2.9 | 3.250.131 | 0.860.109 | 1.67 |
| GC0041 | 17.61.8 | 16.10.8 | 19.7 | 4.6 | 4.7 | 2.2 | 6.750.106 | 1.170.109 | 1.87 |
| GC0040 | 13.71.3 | 11.51.3 | 15.7 | 1.9 | 3.0 | 2.4 | 4.420.131 | 0.770.109 | 1.87 |
| GC0227 | 13.61.2 | 13.11.0 | 15.7 | 2.4 | 4.2 | 1.5 | 5.590.117 | 1.220.108 | 1.70 |
Note. — Structural Parameters for the observed stellar clusters. Cluster IDs are shown in col. (1), col. (2) lists measured by pPXF, col. (3) lists the values recorded by Rejkuba et al. (2007) for comparison, while col. (4) shows which was used for all relevant calculations. The virial masses and dynamical/photometric are listed in cols. (5-7). Cols. (8), (9) and (10) list the projected half-light radii, , core radii, , and concentration parameters, , respectively and were taken from Harris et al. (2002) with having an uncertainty of .
| Object | |||
|---|---|---|---|
| GC0372 | 0.113 | 5.32 | 0.624 |
| GC0378 | -0.040 | 5.29 | 0.515 |
| GC0397 | 0.011 | 5.50 | 0.565 |
| GC0232 | -0.083 | 5.41 | 0.559 |
| GC0218 | 0.050 | 4.81 | 0.612 |
| GC0150 | -0.093 | 5.91 | 0.412 |
| GC0123 | 0.358 | 4.61 | 0.600 |
| GC0171 | 0.422 | 4.32 | 0.841 |
| GC0213 | 0.570 | 5.33 | 0.813 |
| GC0217 | 0.128 | 4.01 | 0.657 |
| GC0225 | 0.632 | 4.62 | 0.749 |
| GC0242 | 0.066 | 4.55 | 0.597 |
| GC0365 | 0.523 | 5.16 | 0.684 |
| GC0077 | 0.328 | 4.78 | 0.689 |
| GC0265 | 0.362 | 5.21 | 0.659 |
| GC0320 | 0.394 | 4.94 | 0.741 |
| GC0326 | 0.211 | 5.39 | 0.656 |
| GC0330 | 0.643 | 6.09 | 0.794 |
| GC0041 | 0.296 | 4.82 | 0.711 |
| GC0040 | 0.026 | 4.97 | 0.593 |
| GC0227 | 0.098 | 4.72 | 0.682 |
Note. — -space parameters as derived from Eqs. (9), (10) and (11).