A microscopic view of accelerated dynamics in deformed polymer glasses
Abstract
A molecular level analysis of segmental trajectories obtained from molecular dynamics simulations is used to obtain the full relaxation time spectrum in aging polymer glasses subject to three different deformation protocols. As in experiments, dynamics can be accelerated by several orders of magnitude, and a narrowing of the distribution of relaxation times during creep is directly observed. Additionally, the acceleration factor describing the transformation of the relaxation time distributions is computed and found to obey a universal dependence on the global strain, independent of age and deformation protocol.
pacs:
81.05.Kf,81.05.Lg,83.60.LaWhen amorphous polymers are being deformed, the slow glassy dynamics resulting from broad distributions of relaxation times becomes accelerated and permits plastic flow Loo et al. (2000); Yee et al. (1988). Recent experimental advances have made it possible to directly measure segmental relaxation dynamics in poly(methyl methacrylate) through an optical photobleaching technique that probes the reorientation of small dye molecules Lee et al. (2008, 2009). During deformation under applied load, molecular mobility increases by up to three orders of magnitude with a concomitant narrowing of the relaxation time spectrum Lee et al. (2008, 2009). Additionally, shifts in mobility relative to the undeformed glass strongly correlate with the instantaneous strain rate. In order to explain plasticity in amorphous solids, the literature frequently invokes Eyring’s phenomenological picture of stress-biased activated processes, in which the viscosity and hence relaxation times decrease with applied stress as Eyring (1936). It has been demonstrated multiple times, however, that this simple model fails to predict the yield behavior of polymer glasses consistently over a range of stresses, strain rates and temperatures Chen and Schweizer (2007). For instance, relaxation times change even when the applied stress is constant Lee et al. (2009).
Enhanced mobility in deformed polymer glasses has also been observed in both atomistic and coarse grained computer simulations. Chain dynamics was probed by measuring the monomer mean-squared displacement Lyulin et al. (2005), the dihedral transition rate between trans/gauche states Capaldi et al. (2002), and the decay rate of covalent bond autocorrelations and intermediate scattering functions Riggleman et al. (2007, 2008). These very different observables all report increased local mobility on the intra- and interchain level both in the sub-yield Capaldi et al. (2002) and post-yield Lyulin et al. (2005) regime and confirm the experimentally observed strong correlation between relaxation time and strain rate Riggleman et al. (2007, 2008). A limitation of these studies is, however, that they only report spatially averaged quantities and do not reveal the full spectrum of relaxation times. Furthermore, since even undeformed glasses are not in equilibrium, it is important to consider the interaction between deformation and physical aging. Aging increases the stiffness of glassy polymers by increasing structural relaxation times; however, deformation alters the intrinsic aging dynamics, and plastic flow can erase the history of the glass, an effect known as “mechanical rejuvenation” Struik (1978); Lyulin and Michels (2007).
In the present Letter, we use molecular simulations as a computational microscope to obtain detailed insight into the dynamics of polymer glasses under deformation, and its consequences for physical aging. From an analysis of individual particle trajectories, we identify relaxation events and hence obtain the full probability distribution of relaxation times. We consider three different deformation protocols: a step stress (creep), a constant strain rate deformation, and a step strain (stress relaxation). The relaxation time distributions are changed in complex ways which depend on the wait time and the deformation protocol, however we find that these changes can all be accounted for using a universal acceleration factor which depends only on the global strain.
Our study employs a well-known coarse-grained bead-spring polymer system, which has been used extensively to model glassy dynamics Baschnagel and Varnik (2005) and polymer deformation Hoy and Robbins (2006). The beads are bonded via a finite extensible non-linear elastic (FENE) spring and interact via a truncated 6-12 Lennard Jones (LJ) potential for , where and set the reference energy and length scale. Results will be given in LJ units, where the reference time scale is . Individual samples consist of 20,000 monomers forming short chains of length 10 in a cubic box subject to periodic boundary conditions. After equilibrating at a melt temperature , the glass is prepared through a rapid quench at constant volume to a glassy temperature of , where the hydrostatic pressure is close to zero. The glass is then aged at zero pressure for a waiting time before a uniaxial deformation is applied in the form of (i) a step stress of magnitude , (ii) a constant strain rate , and (iii) a step strain of magnitude . In all three protocols the stress components perpendicular to the deformation axis are kept at zero, while stress/strain/strain rate are maintained at the indicated amplitudes.
In amorphous solids, the motion of individual particles is not smooth, but highly intermittent. Atoms spend long times in caged environments before undergoing a rapid structural relaxation to a new position. These relaxations correspond to hops on a segmental trajectory. We have developed an algorithm that reliably identifies such hops through peaks in the standard deviation of the particle position (see ref. Warren and Rottler (2009) for details). The analysis yields the full temporal sequence of relaxation events for a subset of 5000 polymer beads chosen randomly from the full simulation volume, from which relaxation time distributions are readily constructed.
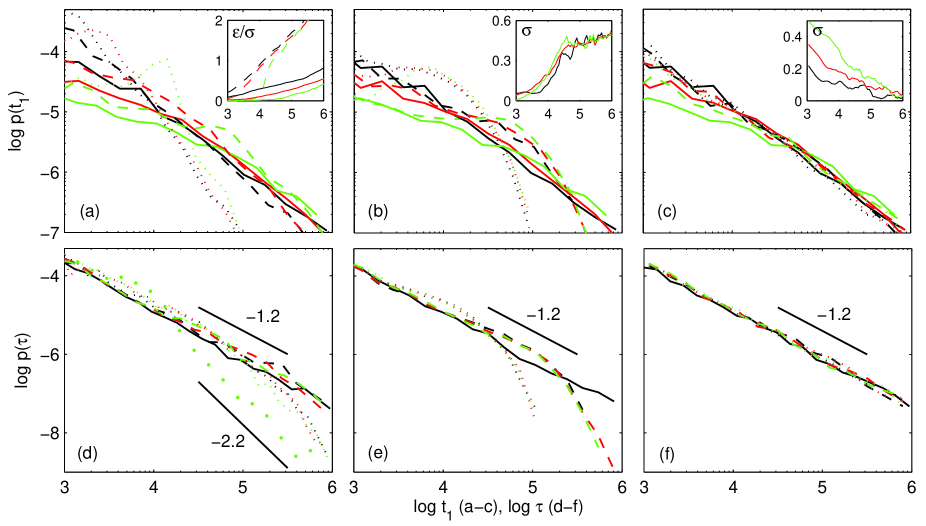
In Fig. 1 we show the observed distributions of hop times for the three deformation protocols defined above and the undeformed glass. We separately present the distribution of first hop times since the onset of deformation (panels (a)-(c)) and the distribution of times in between all subsequent hops (panels (d)-(f)). measures the lifetime of an individual caged configuration, which we call the persistence time. The mechanical response of each protocol is shown as an inset in panels (a)-(c). In ref. Warren and Rottler (2009), we showed that for simple aging with no deformation, the first hop times increase with a power law in the wait time, , where is the aging exponent. The persistence time distribution, however, is age independent and takes the form of a power law . Since the mean hop time of such a distribution is infinite, the dynamics is non-stationary and ages. Studying the changes to these distributions under deformation provides rich insight into the origin of deformation-accelerated dynamics.
First, we consider the effects of a constant stress deformation. The inset of Fig. 1(a) shows that the strain increases with a characteristic timescale , which grows with wait time as . In the sub-yield regime, the response remains shifted in time for different wait times, whereas above yield, the glass eventually begins to flow and all aging is erased (mechanical rejuvenation). The first hop time distribution (Fig. 1(a)) is significantly narrowed for increasing stress. Not only is the probability to observe short first hop times increased relative to the undeformed sample, but the power law tail decays more rapidly. In this way, our analysis permits direct observation of the narrowing of the relaxation time spectrum during creep deformation, which previously was inferred only indirectly from stretched exponential fits to correlation functions Lee et al. (2009).
Fig. 1(d) shows the persistence time distributions, which for a constant stress deformation depend explicitly on both wait time and the time since the deformation began (measurement time ). Lines in Fig. 1(d) show for cages that come into being after the alpha relaxation time , when the strain is increasing slowly. Similar to the first hop time distribution, is narrowed and decreases faster for large . This effect is even more pronounced when is calculated from particles whose cages were created at (dots). The narrowing of the persistence time distributions provides an interesting explanation for mechanical rejuvenation. Our results show that at , where significant plastic flow occurs, the tails of decay with an exponent of . For such a distribution, the mean persistence time becomes finite and a steady state is reached which does not depend on the history of the sample.
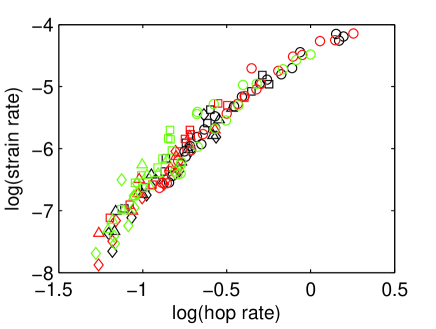
Understanding the dynamics during creep has been the focus of several recent investigations Lee et al. (2008, 2009); Riggleman et al. (2008). In these works, the mobility is defined as the inverse of the average relaxation time, computed through repeated measurements of an autocorrelation function during the course of the experiment. Results show that the mobility increases almost linearly with the strain rate, independent of stress and temperature. The mobility as defined in these experiments is conceptually similar to the total hop rate, accessible through our technique. In Fig. 2, the strain rate is plotted versus the hop rate during the step stress experiment. Results for all stresses and wait times fall on the same, universal curve. The curve is not exactly linear due to the presence of a finite hop rate even in the undeformed, aging samples, and an increase of the mean (non-affine) displacement per hop with strain rate.
A constant strain rate deformation produces a very different effect on the hop times than the creep experiment. Now the system is undergoing plastic flow at an externally imposed rate, and this timescale is reflected in the relaxation time distributions. One can see in Fig. 1(b) that the tails of the -distributions steepen considerably at times of order . At short times, however, the distributions are unmodified relative to the unperturbed glass. Similarly, the persistence time distributions (Fig. 1(e)) are not modified at short times, but decrease rapidly over the same timescale as . remains independent of the wait time and the measurement time. Aging is also erased in this protocol, but now due to truncation of the power law distribution rather than a change in exponent as was observed for constant stress. These results are completely consistent with the effect of aging on the macroscopic mechanical behavior (inset): stress-strain curves display an initial overshoot stress that increases with age, followed by an age independent flow or hardening regime.
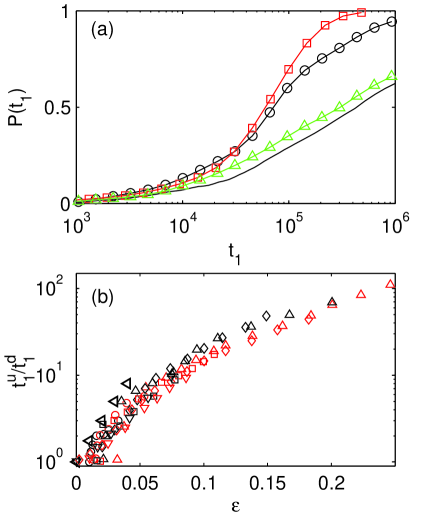
Finally, we analyze the hop statistics for the step strain experiment. Fig. 1(c) shows that increasing the amplitude of the strain step primarily modifies the short time part of . Alternatively, the persistence times (Fig. 1(f)) are completely unchanged relative to the undeformed glass. The effects of a strain step on the first hop time can more easily be appreciated through the cumulative distributions . is the probability that a particle has not yet hopped at time , and its decay closely resembles the autocorrelation functions more typically used to measure particle relaxations such as the intermediate scattering factor Warren and Rottler . Figure 3(a) shows that the cumulative distribution in the step strain protocol is simply shifted in time by a constant factor with respect to the undeformed glass: all relaxation times are rescaled identically.
The cumulatives for the step stress and the constant strain rate protocol are also shown in Figure 3(a). Unlike the simple time shift seen in the step strain experiment, undeformed and deformed curves continue to diverge with time. To make the transformation of the relaxation time distributions more quantitative, we define an acceleration ratio as the ratio of times when the undeformed and deformed cumulative distributions are equal: , where and are defined by the relationship . The acceleration ratio captures changes to the full distribution of relaxation times and is therefore distinct from the average mobility defined in earlier works. Remarkably, the variation in acceleration ratio for the different deformation protocols can be reduced to the effect of their global strain. A parametric plot of the ratios versus the total strain experienced by the sample is shown in Fig. 3(b) for all three protocols and two different waiting times not . Despite the dramatically different mechanical response, all data sets collapse reasonably well on a common curve of the form , where is a universal function of strain. We were unable to achieve a similar collapse using any other deformation variable. For sub-yield strains, we observe a close to exponential rise in the acceleration ratio as a function of global strain. The acceleration increases more slowly after strains of approximately five percent.
This result also explains the observed changes to the persistence time distributions. In this case, the relevant parameter is the accumulated strain in between subsequent hops. For instance, a strain step causes no change to since, after the first hop, there is no further strain. In the constant strain rate experiment, the acceleration factor can be defined in the same way as before, using instead the cumulatives of . Plotted versus the strain, this gives the same universal curve as in Fig. 3(b) demonstrating that the second hops are accelerated in exactly the same way as the first hops. Although it is more difficult to quantify, the dependence of on the wait time and the measurement time in the step stress experiment can be explained by the fact that the strain explicitly depends on these same variables.
The universal collapse observed in Fig. 3(b) strongly suggests that the global strain is a good variable to describe the influence of deformation on structural relaxations, rather than the stress as postulated by the Eyring model. It is interesting to note that the strain was chosen as control variable in the Soft Glassy Rheology (SGR) model Sollich et al. (1997). Here the acceleration factor for barrier crossings increases proportional to , where measures the local strain on a mesoscopic element. In this model, the local strains increase in tandem with the global strain in between barrier crossings. Although the measured acceleration factor differs from that of the SGR model, inspection of our particle trajectories shows that this may be a good picture of local strain in our system: individual particles exhibit very little non-affine displacement except during a hop.
We have presented the first investigation of the full relaxation time distribution of aging, deformed polymer glasses. As reported previously, all three deformation modes accelerate the segmental dynamics. Although the exact transformation of the relaxation time distributions is specific to the mode of deformation, we suggest that the acceleration can be described by a universal function of the global strain. Control simulations with longer chains containing 100 monomers indicate that this conclusion holds independent of chain length Warren and Rottler . We also provide a possible explanation for the phenomenon of mechanical rejuvenation, whereby aging is arrested by deformation. The persistence time distribution causes aging in glasses because of the weak power law decay. Ergodicity is restored during flow under both a step stress and constant strain rate deformation because this distribution is narrowed and the mean persistence time becomes finite.
This work was supported by the Natural Sciences and Engineering Research Council of Canada (NSERC).
References
- Loo et al. (2000) L. S. Loo, R. E. Cohen, and K. K. Gleason, Science 288, 116 (2000).
- Yee et al. (1988) A. F. Yee, R. J. Bankert, K. L. Ngai, and R. W. Rendell, J. Polym. Sci. Part Polym. Phys. 26, 2463 (1988).
- Lee et al. (2008) H.-N. Lee, K. Paeng, S. F. Swallen, and M. D. Ediger, J. Chem. Phys. 128, 134902 (2008).
- Lee et al. (2009) H.-N. Lee, K. Paeng, S. F. Swallen, and M. D. Ediger, Science 323, 231 (2009).
- Eyring (1936) H. Eyring, J. Chem. Phys. 4, 283 (1936).
- Chen and Schweizer (2007) K. Chen and K. S. Schweizer, Europhys. Lett. 79, 26006 (2007).
- Lyulin et al. (2005) A. V. Lyulin, B. Vorselaars, M. A. Mazo, N. K. Balabaev, and M. A. J. Michels, Europhys. Lett. 71, 618 (2005).
- Capaldi et al. (2002) F. M. Capaldi, M. C. Boyce, and G. C. Rutledge, Phys. Rev. Lett. 89, 175505 (2002).
- Riggleman et al. (2007) R. A. Riggleman, H.-N. Lee, M. D. Ediger, and J. J. de Pablo, Phys. Rev. Lett. 99, 215501 (2007).
- Riggleman et al. (2008) R. A. Riggleman, K. S. Schweizer, and J. J. de Pablo, Macromolecules 41, 4969 (2008).
- Struik (1978) L. C. E. Struik, Physical aging in amorphous polymers and other materials (Elsevier/North Holland, 1978).
- Lyulin and Michels (2007) A. V. Lyulin and M. A. J. Michels, Phys. Rev. Lett. 99, 085504 (2007).
- Lee (2009) H.-N. Lee, PhD thesis, University of Wisconsin (2009).
- Baschnagel and Varnik (2005) J. Baschnagel and F. Varnik, J. Phys.: Condens. Matter 17, R851 (2005).
- Hoy and Robbins (2006) R. S. Hoy and M. O. Robbins, J. Polym. Sci. Part B: Polymer Physics 44, 3487 (2006).
- Warren and Rottler (2009) M. Warren and J. Rottler, EPL 88, 58005 (2009).
- (17) M. Warren and J. Rottler, (to be published).
- (18) The acceleration factor can be accurately determined only when hop data is well resolved at times well below the cage escape time. For this reason, acceleration factors for only the longest are shown.
- Sollich et al. (1997) P. Sollich, F. Lequeux, P. Hebraud, and M. E. Cates, Phys. Rev. Lett. 78, 2020 (1997).