Conformational phase diagram for polymers adsorbed at ultrathin nanowires
Abstract
We study the conformational behavior of a polymer adsorbed at an attractive nanostring and construct the complete structural phase diagram in dependence of the binding strength and effective thickness of the string. For this purpose, Monte Carlo optimization techniques are employed to identify lowest-energy structures for a coarse-grained hybrid polymer–wire model. Among the representative conformations in the different phases are, for example, compact droplets attached to the string and also nanotube-like monolayer films wrapping the string in a very ordered way. We here systematically analyze low-energy shapes and structural order parameters to elucidate the transitions between the structural phases.
pacs:
82.35.Gh,05.10.Ln,61.48.DeThe interaction of polymers with substrates is relevant in nanoscale applications like molecular nanoelectronic circuits and in biological processes such as receptor–ligand binding. Thus, scrutinizing basic structural mechanisms of molecular binding at interfaces is crucial for a large field of interdisciplinary research and for potential applications.
In recent years, there has been substantial progress in understanding general properties of polymer adhesion at solid substrates. This includes, for example, the identification of generic structural phases and the transitions between these vrbova1 ; milchev01jcp ; singh1 ; bj4 ; prellberg1 ; bj6 ; linse1 ; paul1 ; mbj1 , as well as specific binding affinities of proteins regarding the type of the substrate and the amino acid sequence bj6 ; whaley1 ; sarikaya1 ; goede1 . In most of these studies, the substrate is considered as being planar. The influence of curved substrates on the formation of structural phases has been subject of works on droplet and helix formation at cylinders milchev02jcp ; srebnik07cpl .
In this Letter, we systematically study conformational phases induced by an attractive nanowire, i.e., a substrate with one-dimensional topology. A nanowire could be, for example, a stretched polymer with the ends attached to dielectrical beads fixed by optical tweezers. It is one of the most striking results of our study that under certain parametrizations of the polymer–nanowire interaction, i.e., in the corresponding region of the conformational phase diagram, the polymer crystallizes in stable cylindrical shapes with monomer alignments which resemble atomic arrangements known from single-walled carbon nanotubes. In this conformational phase, the cylindrical hull surrounds the thin wire such that the interior is free of particles. In a hydrodynamic application, for example, molecules can still flow through it. Since the axis of a polymeric tube is always oriented parallel to the direction of the wire, the growth direction of the tube can be controlled. This would enable the construction of complex tube systems and, therefore, allows for applications beyond those known for conventional nanotubes. Another conceivable application of this structural coincidence is the systematic stabilization or functionalization of nanotubes by polymer coating hasan09am ; valentini02japs ; joan08prb .
In our study, we investigate a coarse-grained model for the polymer and a linelike substrate representing the nanowire. For the polymer, we employ a linear bead-stick model, i.e., covalent bonds between the monomers are stiff. The chain is not grafted to this string and may move freely. The total energy of the system includes three contributions, . The interaction between nonadjacent monomers is governed by the standard Lennard-Jones (LJ) potential,
| (1) |
with the distance between nonbonded monomers and . The monomer–monomer interaction parameters and are set to unity in the following. The weak bending energy is a remnant of the protein-like origin of the model stilli93pre and reads with the bending stiffness set to . The bending angle is defined by the covalent bonds connected to the th monomer. The monomer–string energy is obtained by continuously integrating a standard LJ potential over the infinitely long string vogel10xxx . We find
| (2) |
where and are the monomer–string interaction parameters. The distance of the th monomer perpendicular to the string is denoted by . For convenience, we scale the potential such that its minimum is at for and , in which case vogel10xxx . The effective thickness of the string, , is related to the minimum distance of the monomer–string potential via . Alternatively, the monomer–string energy can be considered as the limiting case of the interaction of a monomer with a cylinder (cp. Ref. milchev02jcp ) of radius , keeping the overall LJ “charge” fixed vogel10xxx .
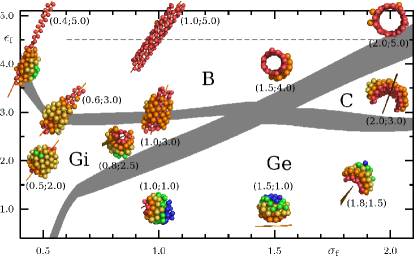
We now systematically analyze the conformational phases of a polymer with monomers for different values of effective thickness and attraction strength of the string, and , respectively. By “phase” we denote a domain in the parameter space, where the representative conformations share qualitatively the same morphology. We have convinced ourselves in exemplified simulations that the results we discuss in the following for the 100mer are also qualitatively correct for longer chains. In Fig. 1, the conformational phase-diagram is shown and representative adsorbed polymer structures are depicted. This phase diagram is a result of extensive analyses of structural properties for more than low-energy conformations with different parametrizations. For the identification of lowest-energy conformations, stochastic generalized-ensemble Monte Carlo methods bergneuh91plb and deterministic conjugate-gradient optimization were used. Conformational changes were performed by applying a variety of update moves, including local crankshaft, slithering-snake, global spherical-cap, and translation moves vogel10xxx .
In the phase diagram, four major structural phases can be identified. For weak attraction (), two types of crystalline droplets svbj1 adhered to the string (regions Ge, Gi) can clearly be distinguished. Either the string axis is inclosed inside the droplet (Gi) or passes by externally (Ge). If the adhesion strength of the string increases, compact droplets in Gi melt near and phase B is entered, where polymer conformations extend along the string axis. Near , a crossover (dashed line in Fig. 1) from the multilayer barrel structures to monolayer conformations with strong similarities to single-walled nanotubes occur. According to former studies of polymer adsorption at planar substrates bj4 ; mbj1 , this crossover corresponds to a topological transition between three-dimensional compact crystalline and two-dimensional filmlike structures. For sufficiently large values of the effective string thickness , the polymer layers do not completely wrap the tube and stable crescent-shaped “clamshell-like” milchev01jcp structures dominate in the region denoted by C.
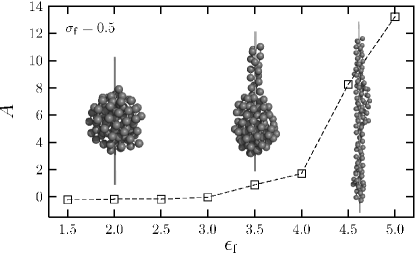
Let us now have a closer look at the different conformational transitions. In region Gi, compact crystalline conformations with spherical symmetry dominate. Increasing in this regime the attraction strength while keeping the effective thickness fixed, this symmetry breaks at and the cylindrical phase B is entered. This transition can be best characterized by introducing an asymmetry parameter based on the gyration tensor components parallel and perpendicular to the string, . This order parameter is shown as a function of in Fig. 2, exemplified for . In the spherical regime Gi, . As expected, increases for and the structures become asymmetric. At this point, it is equally favorable for a monomer to stick to the string, or to form contacts to neighboring monomer layers. The conformations stretch along the string until they form a maximally compact monolayer tube surrounding the string for .
Increasing, on the other hand, the effective thickness for values of the attraction strength , the transition from Gi to Ge is characterized by the different locations of the string relative to the droplet: it is inclosed (Gi) or excluded (Ge). For small values of , the transition point can be estimated as a first approximation by assuming a tetrahedral monomer-packing in the crystalline droplet. Then, the circumsphere radius of a tetrahedron is which corresponds to a limiting effective string thickness . Thus, inserting a string with does not break intra-monomer contacts within a compact structure. Above this limiting value, however, the string would cause an energetically disfavored replacement of monomers inside the conformation and is hence “pushed” out of the droplet.
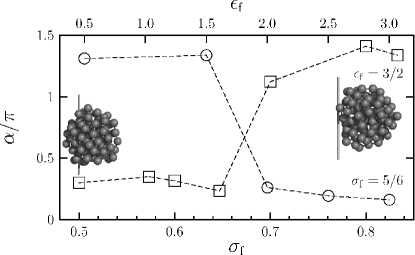
Quantitatively, this transition can be identified by measuring the opening angle of a given conformation. Projecting the positions of monomers in contact with the string onto a plane perpendicular to the string, is defined as the angle between the string and two monomers that spans the largest region of the plane with no monomers residing in. Thus, roughly, conformations with correspond to conformations inclosing the string (Gi), whereas , if the string is located outside the droplet (Ge). Figure 3 shows how changes when crossing the transition line GiGe horizontally or vertically. Fixing the attraction strength at , increases rapidly from (squares, lower scale), which is close to the estimate given above. For larger values of the effective thickness the string is shifted outwards to retain optimal monomer packing. The inset pictures show lowest-energy conformations at and (representative for phase Gi) and (Ge), respectively. Increasing, on the other hand, the string attraction strength while is fixed (circles, upper scale), the inclusion of the string, accompanied by a rapid decrease of , occurs at .
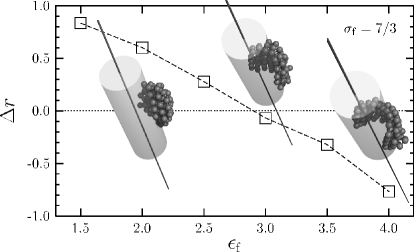
Starting in Ge and increasing and above certain threshold values results in the transition towards adsorbed curved conformations (C) in the sense that the polymer begins to wrap the string. Different monomer layers form. We quantitatively define this transition to occur at the point, where the distance of the center of mass of the polymer from the string, , equals the monomer–string potential minimum distance , i.e., at . Qualitatively, the center of mass intrudes into the virtual cylinder with radius , defined by the inner layer of monomers. In Fig. 4, is plotted as a function of at . The transition point is marked by the dotted line which is here intersected at , in correspondence to the GeC transition line in the phase diagram in Fig. 1. The shown inset pictures represent conformations with at .
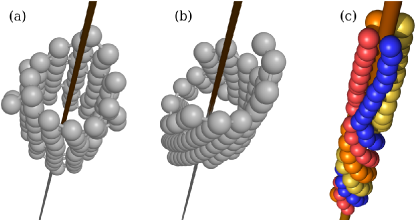
Finally, increasing further, region B is entered, i.e., ground-state polymer conformations wrap the string completely. If the attraction between a monomer and the string becomes stronger than the interaction between stacked, neighboring monomer layers, regular monolayer films surrounding the string are formed, i.e., single-walled tubes with an ordered arrangement of monomers. It is noticeable that there is a competition between different chiral orientations of the wrapping in dependence of the monomer–string interaction length scale vogel10xxx . This behavior is in a similar manner known from carbon nanotubes dekker98nat . Defining the wrapping vector , with and being the unit vectors of the structure, we even find the limiting “armchair” and “zigzag” structures, corresponding to and . Examples of nanotube-like polymer conformations with different chiralities are shown for in Figs. 5(a) and 5(b), respectively, and for in Fig. 5(c) (all at ). The alignment of monomers in Fig. 5(a) is almost parallel to the string, whereas the conformation in Fig. 5(b) exhibits a noticeable chiral winding. If the radius of the monolayer polymer tube does not allow for a perfect monomer alignment, defects occur and cause the formation of structural domains with different chiralities within the same conformation vogel10xxx , as in the example shown in Fig. 5(c).
To summarize, we have constructed the entire conformational phase diagram of a hybrid system consisting of a flexible polymer and an ultrathin attractive nanowire in dependence of the energy scales and length scales associated to the polymer–nanowire interaction. We identified conformational phases of compact spherical polymer droplets inclosing or excluding the string, and a phase of compact but curved shapes (crescent-shaped structures). For sufficiently large string attraction strengths, we observe the formation of cylindrical conformations which in the extreme case of monolayer structures possess strong similarities to nanotubes. This is particularly interesting as it shows that polymers can form tubelike structures in a controlled way. Since the polymer tube can adapt any orientation of the guiding nanowire, also the formation of complex, nonlinear tube systems with bends is conceivable. This would enable a wide range of potential applications which are hard to construct by atomic nanotubes.
The authors would like to thank J. Adler and T. Mutat from the Technion Haifa, for valuable discussions on nanotubes. This project is supported by the Jülich/Aachen/Haifa Umbrella program under Grant No. SIM6. Supercomputer time is provided by the Forschungszentrum Jülich under Project No. jiff39.
References
- (1) T. Vrbová and S. G. Whittington, J. Phys. A 29, 6253 (1996); J. Phys. A 31, 3989 (1998).
- (2) A. Milchev and K. Binder, J. Chem. Phys. 114, 8610 (2001).
- (3) R. Rajesh, D. Dhar, D. Giri, S. Kumar, and Y. Singh, Phys. Rev. E 65, 056124 (2002).
- (4) M. Bachmann and W. Janke, Phys. Rev. Lett. 95, 058102 (2005); Phys. Rev. E 73, 041802 (2006).
- (5) J. Krawczyk, T. Prellberg, A. L. Owczarek, and A. Rechnitzer, Europhys. Lett. 70, 726 (2005).
- (6) M. Bachmann and W. Janke, Phys. Rev. E 73, 020901(R) (2006).
- (7) N. Källrot and P. Linse, Macromolecules 40, 4669 (2007).
- (8) J. Luettmer-Strathmann, F. Rampf, W. Paul, and K. Binder, J. Chem. Phys. 128, 064903 (2008).
- (9) M. Möddel, M. Bachmann, and W. Janke, J. Phys. Chem. B 113, 3314 (2009).
- (10) S. R. Whaley, D. S. English, E. L. Hu, P. F. Barbara, A. M. Belcher, Nature 405, 665 (2000).
- (11) M. Sarikaya, C. Tamerler, A. K.-Y. Jen, K. Schulten, and F. Baneyx, Nat. Mat. 2, 577 (2003).
- (12) K. Goede, P. Busch, and M. Grundmann, Nano Lett. 4, 2115 (2004); K. Goede, M. Grundmann, K. Holland-Nell, and A. G. Beck-Sickinger, Langmuir 22, 8104 (2006).
- (13) A. Milchev and K. Binder, J. Chem. Phys. 117, 6852 (2002).
- (14) I. Gurevitch and S. Srebnik, Chem. Phys. Lett. 444, 96 (2007); J. Chem. Phys. 128, 144901 (2008); S. Srebnik, J. Polym. Sci. B: Polym. Phys. 46, 2711 (2008).
- (15) M. Gao, L. Dai, and G. G. Wallace, Electroanalysis 15, 1089 (2003); T. Hasan, Z. Sun, F. Wang, F. Bonaccorso, P. H. Tan, A. G. Rozhin, and A. C. Ferrari, Adv. Mater. 21, 3874 (2009).
- (16) L. Valentini, J. Biagiotti, J. M. Kenny, and S. Santucci, J. Appl. Polym. Sci. 87, 708 (2002); L. Valentini, J. Biagiotti, M. A. López-Manchado, S. Santucci, and J. M. Kenny, Polym. Eng. Sci. 44, 303 (2004).
- (17) A. Sorkin, J. Adler, and R. Kalish, Phys. Rev. B 78, 155435 (2008).
- (18) T. Vogel and M. Bachmann, preprint (2010).
- (19) F. H. Stillinger, T. Head-Gordon, and C. L. Hirshfeld, Phys. Rev. E 48, 1469 (1993).
- (20) B. A. Berg and T. Neuhaus, Phys. Lett. B 267, 249 (1991); Phys. Rev. Lett. 68, 9 (1992); F. Wang and D. P. Landau, Phys. Rev. Lett. 86, 2050 (2001); U. H. E. Hansmann and L. T. Wille, Phys. Rev. Lett. 88, 068105 (2002).
- (21) T. Vogel, M. Bachmann, and W. Janke, Phys. Rev. E 76, 061803 (2007); S. Schnabel, T. Vogel, M. Bachmann, and W. Janke, Chem. Phys. Lett. 476, 201 (2009).
- (22) J. W. G. Wilder, L. C. Venema, A. G. Rinzler, R. E. Smalley, and C. Dekker, Nature 39, 59 (1998); T. W. Odom, J.-L. Huang, P. Kim, and C. M. Lieber, ibid. 39, 62 (1998).