Radio Polarization Observations of G319.9–0.7: A Bow-shock Nebula with an Azimuthal Magnetic Field Powered by Pulsar J1509–5850
Abstract
We report radio polarization observations of G319.9–0.7 (MSC 319.9–0.7) at 3 and 6 cm obtained with the Australia Telescope Compact Array. The source shows a highly elongated morphology with the energetic pulsar J1509–5850 located at the tip. We found a flat radio spectrum of index and a high degree of linear polarization. These results confirm G319.9–0.7 as a bow-shock pulsar wind nebula. The polarization maps suggest a helical magnetic field trailing the pulsar, with the symmetry axis parallel to the system’s inferred direction of motion. This is the first time such a field geometry has been seen in a bow-shock nebula, and it may be the result of an alignment between the pulsar spin axis and its space velocity. Compared to other bow-shock examples, G319.9–0.7 exhibits very different properties in the field structure and surface brightness distribution, illustrating the large diversity of the population.
Subject headings:
pulsars: individual (PSR J1509–5850) — stars: neutron — stars: winds, outflows — radio continuum: ISM — ISM: individual objects (MSC 319.9–0.7)1. INTRODUCTION
Pulsars lose a significant fraction of their rotational energy through their relativistic winds. The consequent interactions with the ambient medium result in broadband synchrotron emission. These structures are collectively referred to as pulsar wind nebulae (PWNe). The properties of a PWN depend strongly on its evolutionary state and environment. Since a pulsar typically has a space velocity of a few hundred kilometers per second, it will eventually escape its natal supernova remnant (SNR) and travel supersonically in the interstellar medium (ISM). In such cases, the pulsar outflow can be confined by ram pressure, resulting in a bow-shock nebula. Multiwavelength observations have identified several bow-shock PWN systems (see review by Gaensler & Slane, 2006). The best-studied example is ‘the Mouse’ (G359.23–0.82), in which the X-ray and radio emissions can be well-modeled by a bright head coincident with the pulsar, a ‘tongue’ region corresponding to the wind termination shock, and an elongated tail associated with the post shock flow material (Gaensler et al., 2004).
Studies of the Mouse and other bow-shock PWNe have set the stage for subsequent theoretical and numerical modeling efforts. Romanova et al. (2005) considered an axisymmetric case of a pulsar traveling along its spin axis direction. They proposed an azimuthal -field geometry for bow-shocks, and derived the analytical shape of a pulsar tail. With a similar aligned configuration, Bucciantini et al. (2005) carried out the first relativistic magnetohydrydynamic (MHD) simulations of bow-shocks to study the effects of different wind magnetization. Vigelius et al. (2007) relaxed the assumption of alignment and presented three-dimensional non-relativistic hydrodynamic simulations to illustrate the dependence of bow-shock morphology on pulsar orientation and ISM gradient.
Observationally, PWNe at radio frequencies are characterized by flat spectra with spectral index111The spectral index is related to the flux density and frequency by . to 0.0 and high degrees of linear polarization (Kaspi et al., 2006). Due to the long synchrotron cooling time of the radio-emitting particles, a radio PWN can act as a direct calorimeter to reflect the system’s integrated history over a long period of time. More importantly, radio polarimetry provides a powerful probe of the magnetic field geometry of a PWN, which is relatively less studied. High resolution polarization measurements have only been carried out on a handful of bow-shock systems, e.g. IC 443 and the Mouse (Olbert et al., 2001; Yusef-Zadeh & Gaensler, 2005). In particular, VLA observations of the Mouse revealed a highly ordered field wrapping around the bow shock at the apex and extending parallel to the nebular axis downstream (Yusef-Zadeh & Gaensler, 2005), in contrast to the theoretical prediction by Romanova et al. (2005).
To generalize our understanding of PWNe, we need to study more examples. In this paper, we report radio observations of a bow-shock nebula powered by the energetic pulsar J1509–5850 (catalog ). This pulsar was discovered in the Parkes Multibeam Pulsar Survey (Kramer et al., 2003). It has a spin period ms, a high spin-down luminosity ergs s-1 and a relatively young characteristic age yr. As with other energetic pulsars, it has recently been detected in -rays by the Fermi Gamma-ray Space Telescope (Weltevrede, 2010). The pulsar dispersion measure (DM) of 137.7 pc cm-3 suggests a distance ranging from 2.6 to 3.8 kpc according to different Galactic free electron models (Taylor & Cordes, 1993; Cordes & Lazio, 2002). Throughout this work, we will adopt a pulsar distance kpc. Some southwest of the pulsar, there is an elongated radio source MSC 319.9–0.7 (catalog ) (hereafter G319.9–0.7) which was identified by Whiteoak & Green (1996) as a candidate SNR based on observations with the Molonglo Observatory Synthesis Telescope (MOST). The radio source has a size of , and consists of a bright central bulge and a clump in the south.
Hui & Becker (2007) reported an observation of the field of PSR J1509–5850 with the Chandra X-ray Observatory. The X-ray image revealed a tail-like PWN extending from the pulsar in the same orientation as G319.9–0.7, suggesting that it is a bow-shock nebula. At 3 kpc, the tail has a physical scale pc, one of the longest X-ray tails ever observed. The PWN has an X-ray luminosity ergs s-1 between 0.5 and 8 keV, corresponding to a high efficiency . Hui & Becker (2007) argued that G319.9–0.7 is too small to be a SNR associated with the pulsar, and concluded that it is most likely a background object. On the other hand, Kargaltsev et al. (2008, hereafter K08) presented a detailed study using the same Chandra data set, and suggested that G319.9–0.7 could be the radio counterpart of the X-ray PWN. They found an average flow speed km s-1 and an equipartition field of a few times G in the X-ray–emitting region.
Motivated by these previous studies, we have carried out high resolution radio imaging using the Australia Telescope Compact Array (ATCA) to investigate the nature of G319.9–0.7. Observations and data reduction are described in §2. We present the results in §3 and discuss the physical implications in §4. Finally, we summarize our findings in §5.
2. OBSERVATIONS AND DATA REDUCTION
ATCA imaging of G319.9–0.7 was carried out in two 12 hr observations with the EW 367 and 750C array configurations on 2007 Nov 16 and Dec 1, respectively. To obtain a uniform - sampling and to boost the signal-to noise ratio, the longest baselines were excluded in our analysis, giving array spacings from 46 m to 750 m. The observations were made at 3 and 6 cm (center frequencies at 8.64 and 4.8 GHz, respectively) simultaneously with all Stokes parameters recorded. At each wavelength, the total bandwidth of 128 MHz was divided into MHz overlapping spectral channels. After discarding the edge channels and channels affected by self-interference, and merging the overlapping adjacent channels, a usable bandwidth of 104 MHz is left, which is split into MHz channels. The entire field was covered by a 9-pointing mosaic patten with pointings spaced by 3′, smaller than the FWHM of the primary beam even at 3 cm.
The flux density scale is set by observations of the primary calibrator, PKS B1934–638. In addition, a secondary calibrator, PKS B1511–55, was observed every 30 minutes to determine the antenna gains. All our data reduction was performed with standard techniques using the MIRIAD package (Sault et al., 1995). We first examined the data carefully to reject outlier visibility data points and scans during poor atmospheric phase stability. We then determined gain, bandpass, flux and polarization calibrations for the observations, and applied these to the source visibilities. Mosaiced images in each polarization were formed using the multifrequency synthesis technique (Sault & Wieringa, 1994) to improve the - coverage and with uniform weighting to minimize the sidelobes. Images in Stokes I, Q and U were deconvolved simultaneously using a maximum entropy algorithm (PMOSMEM; Sault et al., 1999), and restored with a Gaussian beam of FWHM , corresponding to the diffraction limit at 6 cm with the 750 m baseline. Finally, we convolved the 3 cm map to identical spatial resolution as the 6 cm one. Our final maps in Stokes I, Q and U at 3 cm have rms noise of 0.2 mJy beam-1, very close to the theoretical level of 0.18 mJy beam-1. At 6 cm, the noise level is 0.15 mJy beam-1 in the Stokes I map, and 0.1 mJy beam-1 in the Stokes Q and U images, again consistent with the theoretical value of 0.1 mJy beam-1.
Using the Stokes Q and U images, we generated maps of the polarized intensity and position angle (PA) with the task IMPOL, which includes corrections for Ricean bias (Wardle & Kronberg, 1974). To obtain the intrinsic PAs of the polarization vectors, we reprocessed the 20 cm ATCA data from the Southern Galactic Plane Survey (SGPS; Haverkorn et al., 2006) on a channel-by-channel basis, applied the rotation measure (RM) synthesis technique (Brentjens & de Bruyn, 2005) to map the foreground Faraday rotation, and then derotated the 3 and 6 cm polarization vectors accordingly.
In addition to the radio data, we have also processed the 40 ks Chandra X-ray observation (ObsID 3513 (catalog ADS/Sa.CXO#obs/03513)) reported by Hui & Becker (2007) and K08 for a multi-wavelength comparison. After the standard pipeline processing, we generated an exposure-corrected image in the 0.5-7 keV energy range and applied a smoothing to 6″ resolution to maximize the signal-to-noise ratio.
3. RESULTS
3.1. Nebular Morphology
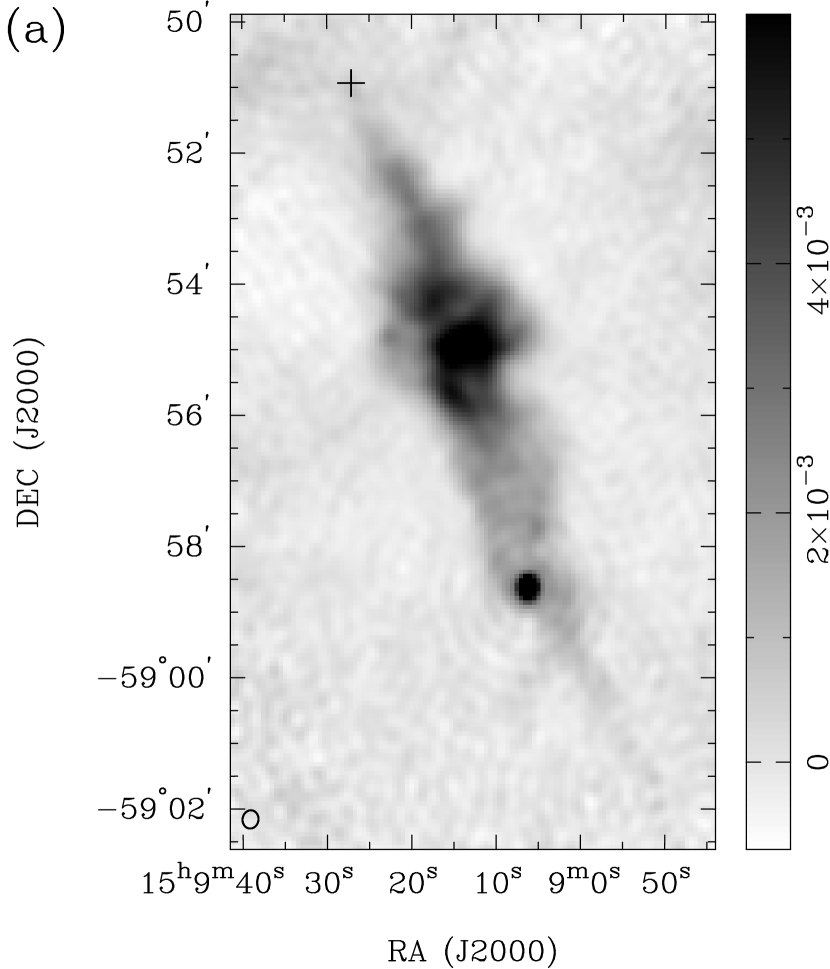
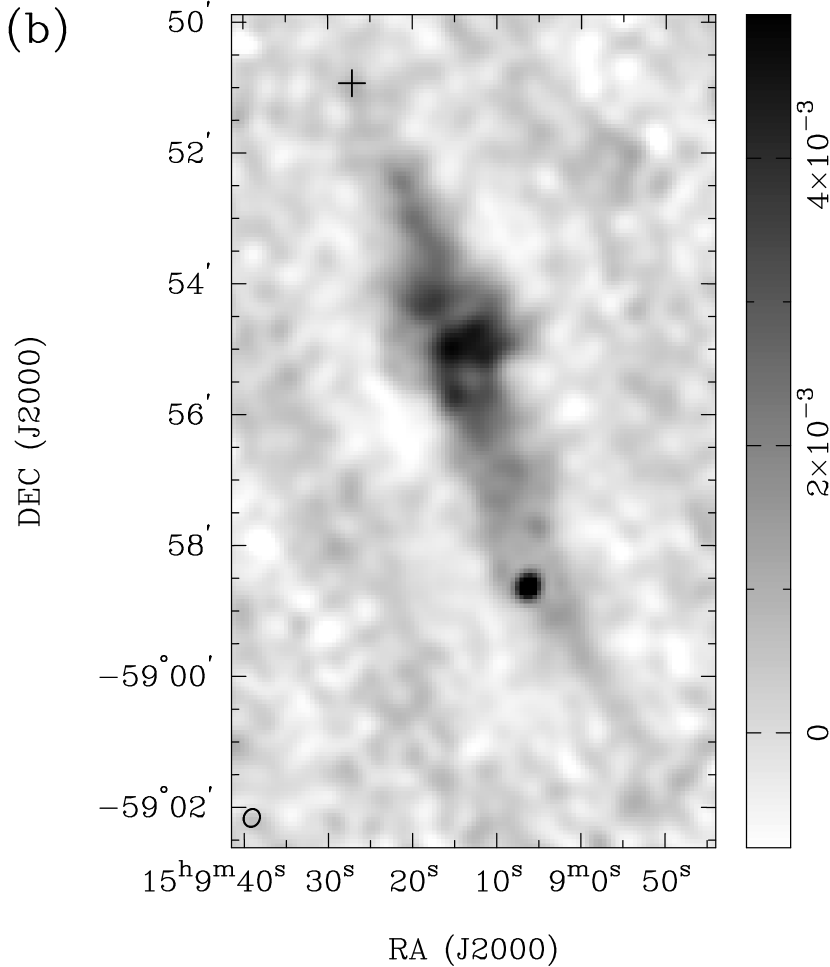
Radio continuum images of G319.9–0.7 at 3 and 6 cm are presented in Figure 1. The source exhibits a very similar morphology at both wavelengths; it is highly elongated and extends over 11′ with a clear symmetry axis along the PA 200° (measured from north through east). We note that since the shortest array spacing in the data is only 46 m, the sensitivity of the 3 cm intensity map is expected to drop for angular scale beyond , resulting in obvious sidelobes in Figure 1(b). PSR J1509–5850 was not detected in our observations, but its position, which is marked by the cross in the figure, coincides with the tip of the nebula. At the pulsar location, the radio emission is very faint. It gradually brightens towards the south and shows a cone-like morphology with an opening angle . The emission peaks at a central bulge 45 from the pulsar and attains a maximum width of 3′. Beyond that, the nebula fades and narrows. At 8′ southwest of the pulsar, there is a bright, unresolved radio source with a faint X-ray counterpart reported by K08, which could possibly be a background radio galaxy. Further south, the nebula changes slightly in orientation () and narrows to a collimated faint tail. Finally, beyond from the pulsar, the nebular surface brightness drops to near the noise level of the radio maps, although there is some hint of extension for another 1–2 arcminutes.
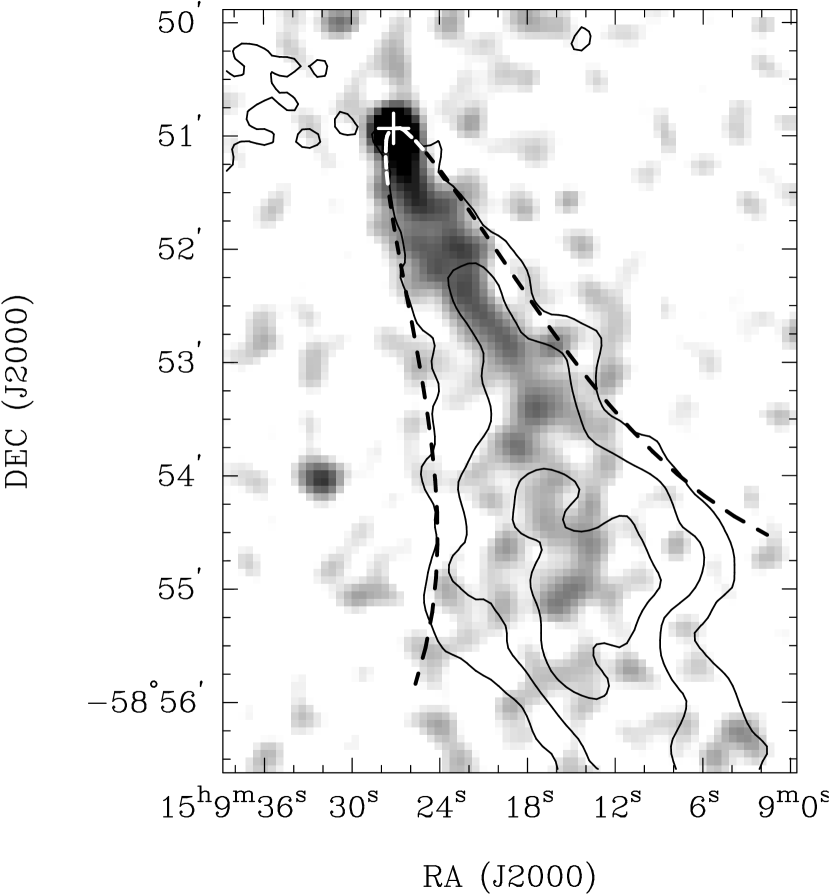
Figure 2 shows the exposure-corrected Chandra X-ray image, overlaid with radio contours from the 6 cm radio intensity map in Figure 1(a). The X-ray and radio emissions near the pulsar are well-aligned and are bounded by a common envelope. We followed K08 by modeling the envelope with a parabola and obtained , where and are the angular distance (in arcseconds) from the pulsar, measured perpendicular and parallel to the nebular symmetry axis, respectively. As a comparison, our result is slightly wider than the one reported by K08, which may due to the lower resolution of the radio map than the X-ray image. Figure 2 also indicates an anti-correlation between the radio and X-ray surface brightness. While the former increases with distance from the pulsar, the latter peaks at the pulsar position and fades to the south. At 15 downstream from the pulsar, the X-ray tail suddenly narrows by a factor of 2. We found some hint of a radio ridge, as indicated by the middle contour in Figure 2, which may correspond to the narrowed X-ray tail. Further south, the X-ray emission becomes more diffuse and seems to extend to the radio peak. Deeper observations are needed to confirm this. Figure 3 shows the surface brightness profiles of the radio and X-ray emissions, illustrating the features described above.
3.2. Polarization Properties
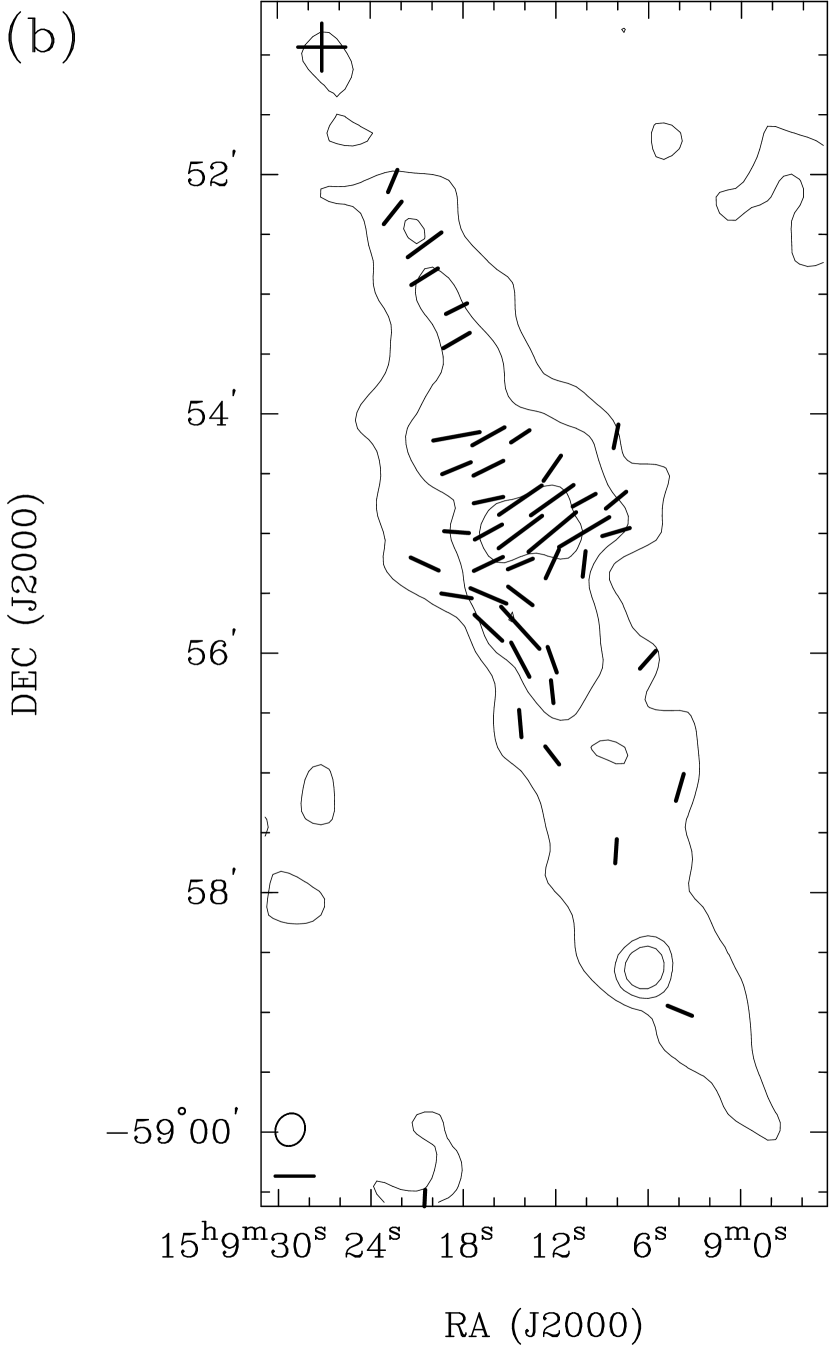
After correction for the foreground Faraday rotation (see below), the strength and intrinsic projected orientation of the polarization -vectors of G319.9–0.7 are plotted in Figure 4, revealing a highly ordered magnetic field structure. The -vectors in the north runs along the northwest-southeast direction with a PA of 120°, nearly perpendicular to the symmetry axis of the nebula. South of the bulge, the vectors switch direction abruptly, and show a good alignment with the nebular axis.
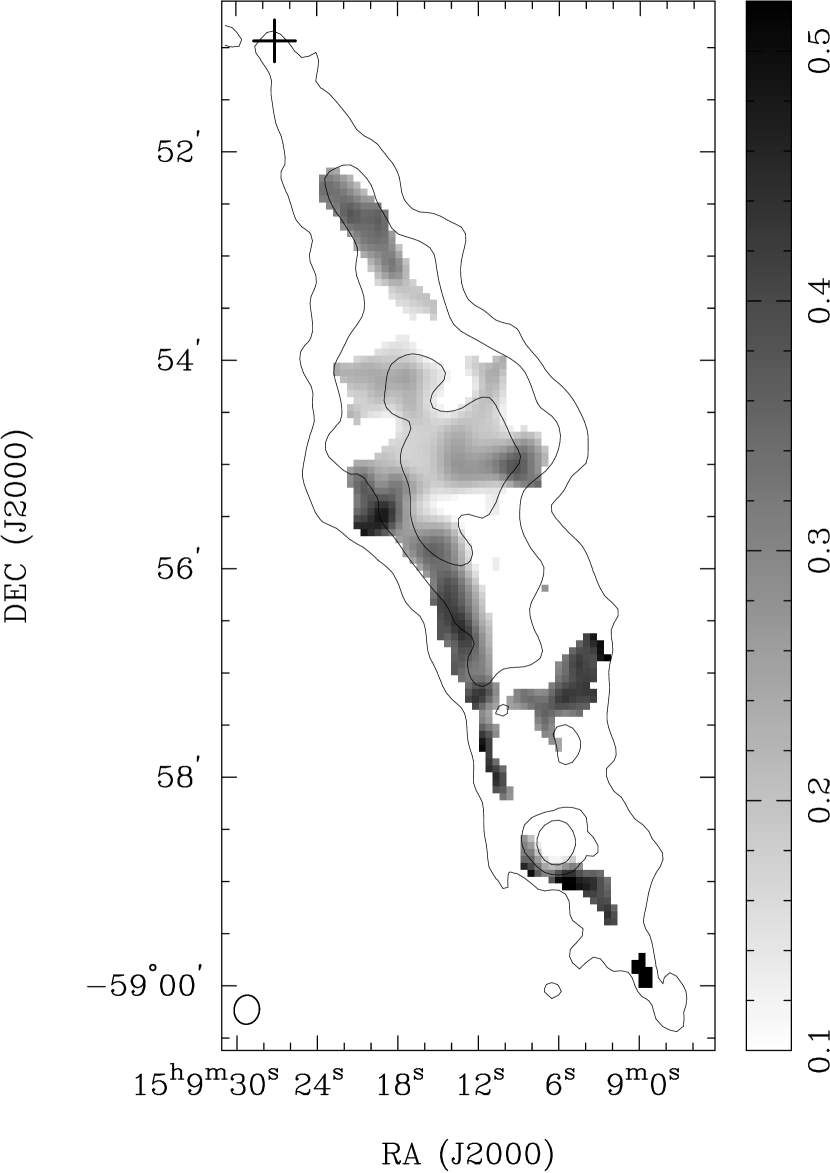
The fractional linear polarization map of G319.9–0.7 at 6 cm is shown in Figure 5. The source is highly linearly polarized and the degree of polarization appears to be systematically higher around the edges than in the interior. For instance, it is over 40% polarized along the southern edge and in the north, but only at the central bulge. The map at 3 cm, which is not shown here due to low signal-to-noise ratio, suggests a very similar pattern.
Figure 6 presents the results from RM synthesis of the 20 cm data, indicating a small magnitude of RM for most regions. The central bulge has rad m-2, and the RM slightly increases to +50 rad m-2 towards the tip in the north. The measurement uncertainties in the map are of a similar order ( rad m-2). Since the compact source in the south is very weakly polarized, we cannot determine if it has a different RM than the rest of the nebula. Using this RM map, we derotated the 3 and 6 cm polarization vectors to their intrinsic orientation, which are plotted in Figure 4. Due to the small RM values, the corrections at both wavelengths are generally small, e.g. a RM of 50 rad m-2 would correspond to a derotation of 3° at 3 cm and 11° at 6 cm. As a note, the measurement errors in the PA of the 3 and 6 cm vectors are about 8° and 4°, respectively.
3.3. Radio Spectrum
After subtracting the unresolved source in the south, G319.9–0.7 has flux densities of , , and Jy at 3, 6, 20 and 36 cm, respectively, as obtained from our data (3 and 6 cm), SGPS (20 cm; Haverkorn et al., 2006) and MOST (36 cm; Whiteoak & Green, 1996). The resulting radio spectrum is plotted in Figure 7(a). With the shortest array spacing of 46 m, the 3 cm intensity map is only sensitive to angular scales smaller than 26. Therefore, the flux measurement at 3 cm is likely underestimated and excluded this data point to deduce a spectral index from 3 other bands. The compact source has a substantially steeper radio spectrum of , suggesting that it could be an unrelated background source. Following Gaensler & Wallace (2003), we resampled the 6 cm data and compared to the 3 cm map through spectral tomography (Katz-Stone & Rudnick, 1997). The result indicates no significant spatial variation in the spectral index along the nebula. Finally, a comparison to the X-ray spectrum reported by K08 is plotted in Figure 7(b). The broadband spectrum suggests a break near Hz with a change in spectral index . Integrating the radio spectrum below the break frequency gives a radio luminosity ergs s-1, nearly an order higher than the X-ray luminosity.
4. DISCUSSION
4.1. Nature of G319.9–0.7
Our results clearly show that G319.9–0.7 is a non-thermal radio source with a flat spectrum () and a high degree of linear polarization (30–40%), thereby establishing the PWN nature of the source. Moreover, the location of G319.9–0.7 respect to PSR J1509–5850 and its alignment with the X-ray tail strongly suggest that it is a radio counterpart of the bow-shock nebula. Previous Chandra X-ray observation indicates a projected bow-shock standoff distance (K08), which is too small to be resolved by our radio maps. Using this value, the theoretical shape of a bow-shock (e.g. Wilkin, 1996) is about 5 times narrower than the parabola we obtained. This is likely the result of deceleration in the flow downstream (see §4.2 below).
Due to long synchrotron cooling timescale, the radio emission of a PWN traces the pulsar motion over a large distance, reflecting the path of the system. Therefore, in the following discussion, we call G319.9–0.7 a radio ‘trail’ rather than a ‘tail’, and its orientation implies a pulsar proper motion direction towards the northeast at PA °. At the pulsar distance kpc, the radio trail has a physical extent over pc. For a space velocity km s-1 (K08), if the pulsar is nearly as old as its spin-down age yr, then it would have traveled a distance 8 times longer than the radio trail. Even accounted for the projection, we think it is unlikely that the radio PWN reflects the entire history of the system, and the pulsar birth site could be much further south. At 4° southwest of the pulsar, there is an open cluster Ruprecht 112 (C1453–623; Alter et al., 1970) lining up exactly with the nebular axis. However, this cluster is poorly studied and the distance is unknown. If this is the birth site of the pulsar, the large angular separation would require a high pulsar velocity of 1400 km s-1, an older age, or a closer source distance. A direct measurement of the pulsar proper motion could provide more insights into the birth site.
The small RM towards the source is not unexpected, since the line of sight to the source is near the interarm region between the Crux and Norma Galactic spiral arms, where the RM contributed by the ISM is small (Han et al., 2006). As their work suggests, our result is consistent with a source distance below 4 kpc. The ratio between the PWN RM ( rad m-2) and the pulsar DM (137.7 pc cm-3; Kramer et al., 2003) indicates a small mean field along the line of sight
| (1) |
Finally, we note that the compact source in the south has a flux density of 0.1 Jy at 20 cm. Hopkins et al. (2003) found that radio sources with at least this flux level have a number density of 2.0 per square degree in the sky. Therefore, within the PWN area deg2, the chance probability of having such a background source is about 2%, not completely negligible.
4.2. Magnetic Field Strength and Flow Structure of G319.9–0.7
Figure 7(b) shows that the X-ray synchrotron radiation of the PWN could extend down to Hz without a spectral break. According to K08, this value implies an equipartition field strength G near the pulsar and a projected flow speed km s-1. To estimate the magnetic field downstream beyond the X-ray tail, we consider the radio emission in the southern half of the nebula beyond 45 from the pulsar. We integrate the spectrum in the range Hz to obtain a luminosity ergs s-1 (after excluding the background source), with the corresponding emission volume cm3. This gives an equipartition field
| (2) |
where is the ion to electron energy ratio, is the volume filling factor, and is a constant weakly depends on the spectral index (Pacholczyk, 1970).222Although there is recent revision to this formula, e.g. Beck & Krause (2005), we note that the revised version does not work for flat spectrum objects in which . Assuming and , we obtained G, a few times lower than that of X-ray–emitting region. We note that this result is independent of the lower frequency limit, and insensitive to the upper limit, e.g. the range Hz yields G.
While the flow speed in the radio PWN cannot be determined precisely without knowing the maximum energy of the synchrotron radiation, the absence of X-ray emission can still provide some rough estimates. From the point where the X-ray tail vanishes, the radio nebula extends 7′ further downstream, corresponding to a physical length pc. Assuming most photons in the region have frequencies Hz ( keV, nearly the detection threshold of Chandra), the synchrotron cooling time scale
| (3) |
suggests a flow speed
| (4) |
Here we ignored adiabatic cooling, since the nebula cross-section shows no widening beyond the central bulge. Moreover, if the majority of particles radiate below the break frequency of Hz, the flow speed will then be as low as km s-1. We emphasize that these estimates are highly uncertain because the exact spectrum is unknown. Nonetheless, a comparison to the X-ray results suggests a significant deceleration of the flow when moving downstream, with the speed dropping by 1–2 orders of magnitude.
4.3. Magnetic Field Geometry and Physical Interpretation
The most remarkable feature of G319.9–0.7 is the distribution of the polarization vectors. Since synchrotron emission of a PWN is optically thin and Faraday thin (i.e. depth depolarization is negligible) at our observed wavelengths, the polarization maps in Figure 4 represent the magnetic field of the nebula projected on the sky plane. This implies a helical field structure in the north, with the axis of symmetry parallel to the nebular axis, and hence to the pulsar’s inferred direction of motion. This is the first time an azimuthal field geometry has been seen in a bow-shock nebula. Axisymmetric toroidal fields about pulsar rotation axes have been observed in young PWNe within SNRs (e.g. Dodson et al., 2003; Hester, 2008), and have been successfully reproduced by MHD simulations (see, Volpi et al., 2008, and references therein). As an analogy to these systems, the field configuration of G319.9–0.7 could be understood if the pulsar motion aligns with its spin axis. Such an alignment is not uncommon (Johnston et al., 2005), and could be the result of a momentum kick at the birth of a neutron star (see, Spruit & Phinney, 1998; Ng & Romani, 2007). If this is the case for PSR J1509–5850, the jet-like polar outflow would contribute to the X-ray tail. The MHD instabilities (e.g. kink and sausage instabilities) in the flow could then help explain the nonuniform surface brightness in the tail downstream (Kargaltsev & Pavlov, 2008). Future polarization measurements of the pulsar profile may reveal the projected orientation of its spin axis, directly confirming the above picture. However, since PSR J1509–5850 has a relatively low degree of polarization (Weltevrede & Johnston, 2008), this may require the next generation of radio telescopes.
Further support for the spin-velocity alignment is given by analytic studies of pulsar wind bow-shocks. Romanova et al. (2005) showed that an aligned pulsar can wind up its magnetic field to form an azimuthal field in the magnetotail behind, possibly resembling what we found in G319.9–0.7. Assuming energy equipartition between the field and the particles, these authors derived an analytic expression for the magnetotail radius in terms of the distance from the star (Eq. 34–35 in Romanova et al., 2005). Using the bow-shock standoff distance of 05 (K08), their model predicts a too narrow nebular morphology. If the model parameters are allowed to vary, we are able to obtain a better fit, which is overplotted in Figure 2, although it requires a very large standoff distance cm corresponding to 4″, even at the lower limit 5000 km s-1 of the flow speed (K08). The fit also suggests a large deceleration in the flow of length scale pc, much shorter than the total distance traveled by the pulsar, as proposed in their model. This could explain why the observed nebular morphology is much wider than the theoretical predictions.
Beyond the central bulge, the magnetic field of G319.9–0.7 switches direction abruptly and runs parallel to the nebular axis, similar to that of the Mouse PWN reported by Yusef-Zadeh & Gaensler (2005). The change in field geometry seems difficult to understand. One possible scenario could be a two-component field structure consisting of a poloidal core surrounded by a toroidal field, such as the one suggested by Kothes et al. (2008) for DA 495333We should note that the field structure of DA 495 is inferred from the RM distribution of the PWN. However, internal Faraday rotation is generally not expected for non-thermal plasmas such as pulsar winds.. If the toroidal field decays faster downstream, this would leave the poloidal core component, resulting in a switch in the overall field orientation. In this picture, the projection of the two field components leads to a lower degree of polarization in the PWN interior than around the edge as observed. Near the transition region where the two field strengths are comparable, we expect the total polarization to cancel out. However, such a complete depolarizing region is not observed in Figure 5. Indeed, Figure 4 shows that the polarization vectors near the bulge have intermediate orientation, suggesting physical change of the field direction rather than projection effect. Therefore, we conclude that this scenario is less likely.
Hinted by the flow deceleration and the relatively lower degree of polarization at the bulge, an alternative physical scenario is that the plasma flow might become unstable downstream, then drives an expanding bubble into the ISM, similar to the model suggested by van Kerkwijk & Ingle (2008) to explain the H observations of the Guitar Nebula, the bow-shock PWN powered by PSR B2224+65 (Cordes et al., 1993). If we decompose the magnetic field into random and ordered components, then the relative strength between the random field and the ordered field perpendicular to the line of sight can be estimated from the degree of polarization . For the case of energy equipartition,
| (5) |
where is the intrinsic degree of polarization (Beck & Krause, 2005). As indicated in Figure 5, the nebular emission is polarized around the edge, implying a highly ordered field of . On the other hand, the lower degree of polarization in the interior gives . This indicates a substantial random field, suggesting some hints of turbulence, which could be due to flow instability. If this is the case, then the actual value of would be even higher due to the intrinsic anisotropy of MHD turbulence (Beck et al., 2003).
Assuming continuous energy injection and adiabatic expansion, van Kerkwijk & Ingle (2008) give the angular radius of the bulge in terms of the instability angular scale using the Sedov-Taylor solution:
| (6) |
where is a function of order unity, is the pulsar velocity, is the angular separation between the bubble center and the pulsar, and is the angular size of the bow-shock standoff distance (see Eq. 4 in van Kerkwijk & Ingle, 2008). Our radio maps in Figure 1 indicate and , together with and km s-1 from K08; these suggest , implying a relatively slow growth rate of the instability. The ratio is higher than the value 80 inferred from the Guitar Nebula, but still within a few times of the instability growth length scale as discussed by van Kerkwijk & Ingle (2008). A more realistic estimate with the magnetic field taken into account could lead to a lower expansion rate, and hence a slightly smaller . The estimate above predicts an expansion rate
| (7) |
for the bulge, too small to be detected by the ATCA over a reasonable time span, and the emission is too faint for VLBI measurements.
For the orientation switch of the polarization vectors downstream, we speculate that the expanding bubble may channel particles into the low-pressure cavity evacuated by the pulsar wind along the path, thus changing the field configuration. Finally, we should point out that this picture fails to explain how the polarization structure is preserved during the bubble expansion. Further simulation work is thus necessary to complete the study.
4.4. Multiwavelength Comparison
Figure 3 show that the X-ray tail is brightest near the pulsar while the radio emission is extremely faint in the same region. K08 extracted the X-ray counts from a ellipse at the head of the PWN (excluding the pulsar), and obtained an X-ray power-law spectrum with index . If the absorption column density is allowed to vary, they found , identical to the radio spectral index of the overall PWN. Using the same extraction region, we obtained flux densities of mJy and mJy at 3 and 6 cm, respectively, from the radio intensity maps in Figure 1. Given the X-ray spectrum, the faintness in radio emission is not unexpected. If we extrapolate the two different X-ray power-laws to radio wavelengths without any spectral breaks, we expect flux densities of 0.5 Jy–14 mJy at 3 cm and 0.6 Jy–20 mJy at 6 cm, consistent with the observed values, albeit not very constraining. To determine if there is any intrinsic break in the injection spectrum, further studies will require deeper radio and X-ray observations, as well as flux measurements at wavelengths in between (e.g. infrared).
Moving downstream from the pulsar, while the X-ray tail fades due to synchrotron burn-off, the radio emissivity gradually increases. As K08 point out, this could be caused by the deceleration of the flow, and similar spatial radio–X-ray anti-correlations have been observed in other PWNe with mildly relativistic jet-like polar outflows, e.g. the ones powered by PSRs B1509–58, B1706–44 and Vela (Gaensler et al., 2002; Romani et al., 2005; Kargaltsev & Pavlov, 2004). For the case of G319.9–0.7, the bulge is times brighter than the tip from the 6 cm linear profile (Figure 3) and 10 times wider (Figure 1). Therefore, the volume emissivity at the bulge is 15% of that at the tip. As discussed above, the flow speed drops by 10–100 times between the two regions. After accounted for the geometry, this corresponds to a factor of 1–10 decrease in particle number density downstream. Due to the strong dependence of synchrotron emissivity on the field strength ( for energy equipartition, or if the particle distribution remains unchanged), our results indicate a minimal field decay between the tip and the bulge, at most by a factor of 2. While this seems incompatible with the field strengths estimated in §4.2, it argues that energy equipartition is not achieved near the pulsar and the actual magnetic field could be close to G at the tip of the PWN.
4.5. Comparison with Other Radio Bow-shock PWNe
For a handful of bow-shocks with detailed radio studies, their radio emissions generally peak at the pulsar position and show good spatial correlations with the X-ray counterparts, e.g. the Duck, the Mouse and IC 443 (Kaspi et al., 2001; Gaensler et al., 2004, 2006). The clear radio–X-ray anti-correlation of G319.9–0.7 likely reflects a different flow condition for the source compared to these other systems. Additionally, an azimuthal -field geometry has never previously been found in bow-shocks. In the following discussion we will focus on the Mouse PWN, since it has high resolution polarimetric observations that allows a direct comparison with our study.
The magnetic field of the Mouse wraps around the bow-shock at the apex, it then switches orientation abruptly behind the pulsar and runs parallel to the nebular axis downstream (Yusef-Zadeh & Gaensler, 2005). Since the radio emission is very faint at the tip of G319.9–0.7, it is unclear if a similar field direction switch may exist near the pulsar. The azimuthal field geometry in G319.9–0.7 is not found in the Mouse. This could reflect different spin-velocity alignments of the central pulsars in the two systems. While we suggested that G319.9–0.7 could be an aligned case, we may expect a completely different field geometry if the misalignment angle is large. Future MHD simulations with anisotropic winds and pulsar orientations taken into consideration could help verify this picture.
More intriguing is the field structure at large distances from both pulsars. Figure 4 shows that the field orientation of G319.9–0.7 exhibits a 90° switch near the central bulge, at pc from the pulsar. Similar behavior is also found in the Mouse: the polarization vectors change direction abruptly at several places along the nebular axis, with the most prominent one at pc downstream from the pulsar, and the behavior appears to be quasi-periodic (Yusef-Zadeh & Bally, 1987). This could be due to MHD instabilities in the flows, but the detailed mechanism is not well understood. More examples are necessary to determine whether this is a common feature among bow-shocks with long trails.
5. CONCLUSIONS
We have presented a detailed radio polarization study of G319.9–0.7 at 3 and 6 cm. Our results confirm that this source is a bow-shock PWN associated with PSR J1509–5850, and reveal its central bulge morphology, which could represent an adiabatically expanding bubble drove by the flow instability. We found an equipartition field strength of G and a flow speed km s-1 in the radio nebula, indicating a substantial deceleration of the flow as compared to the X-ray–emitting region near the pulsar. The polarization measurements reveal a remarkable azimuthal field geometry in the northern half of the PWN, which qualitatively agrees with the theoretical prediction for an axisymmetric bow-shock. As compared to the well-studied case of the Mouse PWN, G319.9–0.7 shows very different field structure and surface brightness distribution, illustrating the diversity in the physical properties of bow shocks.
To conclude, our study demonstrates that high resolution radio polarimetry can provide a powerful diagnostic tool for probing the physical conditions of a PWN. Future works on expanding the sample of polarimetric observations on bow-shock nebulae are essential to understand the general properties of the population.
References
- Alter et al. (1970) Alter, G., Balazs, B., Ruprecht, J., & Vanysek, J. 1970, Catalogue of star clusters and associations, 2nd edn. (Budapest: Akadémiai Kiado)
- Beck & Krause (2005) Beck, R., & Krause, M. 2005, Astronomische Nachrichten, 326, 414
- Beck et al. (2003) Beck, R., Shukurov, A., Sokoloff, D., & Wielebinski, R. 2003, A&A, 411, 99
- Brentjens & de Bruyn (2005) Brentjens, M. A., & de Bruyn, A. G. 2005, A&A, 441, 1217
- Bucciantini et al. (2005) Bucciantini, N., Amato, E., & Del Zanna, L. 2005, A&A, 434, 189
- Cordes & Lazio (2002) Cordes, J. M., & Lazio, T. J. W. 2002, preprint, astro-ph/0207156
- Cordes et al. (1993) Cordes, J. M., Romani, R. W., & Lundgren, S. C. 1993, Nature, 362, 133
- Dodson et al. (2003) Dodson, R., Lewis, D., McConnell, D., & Deshpande, A. A. 2003, MNRAS, 343, 116
- Gaensler et al. (2002) Gaensler, B. M., Arons, J., Kaspi, V. M., Pivovaroff, M. J., Kawai, N., & Tamura, K. 2002, ApJ, 569, 878
- Gaensler et al. (2006) Gaensler, B. M., Chatterjee, S., Slane, P. O., van der Swaluw, E., Camilo, F., & Hughes, J. P. 2006, ApJ, 648, 1037
- Gaensler & Slane (2006) Gaensler, B. M., & Slane, P. O. 2006, ARA&A, 44, 17
- Gaensler et al. (2004) Gaensler, B. M., van der Swaluw, E., Camilo, F., Kaspi, V. M., Baganoff, F. K., Yusef-Zadeh, F., & Manchester, R. N. 2004, ApJ, 616, 383
- Gaensler & Wallace (2003) Gaensler, B. M., & Wallace, B. J. 2003, ApJ, 594, 326
- Han et al. (2006) Han, J. L., Manchester, R. N., Lyne, A. G., Qiao, G. J., & van Straten, W. 2006, ApJ, 642, 868
- Haverkorn et al. (2006) Haverkorn, M., Gaensler, B. M., McClure-Griffiths, N. M., Dickey, J. M., & Green, A. J. 2006, ApJS, 167, 230
- Hester (2008) Hester, J. J. 2008, ARA&A, 46, 127
- Hopkins et al. (2003) Hopkins, A. M., Afonso, J., Chan, B., Cram, L. E., Georgakakis, A., & Mobasher, B. 2003, AJ, 125, 465
- Hui & Becker (2007) Hui, C. Y., & Becker, W. 2007, A&A, 470, 965
- Johnston et al. (2005) Johnston, S., Hobbs, G., Vigeland, S., Kramer, M., Weisberg, J. M., & Lyne, A. G. 2005, MNRAS, 364, 1397
- Kargaltsev et al. (2008) Kargaltsev, O., Misanovic, Z., Pavlov, G. G., Wong, J. A., & Garmire, G. P. 2008, ApJ, 684, 542
- Kargaltsev & Pavlov (2004) Kargaltsev, O., & Pavlov, G. 2004, in IAU Symposium, Vol. 218, Young Neutron Stars and Their Environments, ed. F. Camilo & B. M. Gaensler (San Francisco: ASP), 195
- Kargaltsev & Pavlov (2008) Kargaltsev, O., & Pavlov, G. G. 2008, in AIP Conf. Proc., Vol. 983, 40 Years of Pulsars: Millisecond Pulsars, Magnetars and More, ed. C. Bassa, Z. Wang, A. Cumming, & V. M. Kaspi (Melville, NY: AIP), 171
- Kaspi et al. (2001) Kaspi, V. M., Gotthelf, E. V., Gaensler, B. M., & Lyutikov, M. 2001, ApJ, 562, L163
- Kaspi et al. (2006) Kaspi, V. M., Roberts, M. S. E., & Harding, A. K. 2006, in Compact stellar X-ray sources, ed. W. H. G. Lewin & M. van der Klis (Cambridge: Cambridge University Press), 279
- Katz-Stone & Rudnick (1997) Katz-Stone, D. M., & Rudnick, L. 1997, ApJ, 488, 146
- Kothes et al. (2008) Kothes, R., Landecker, T. L., Reich, W., Safi-Harb, S., & Arzoumanian, Z. 2008, ApJ, 687, 516
- Kramer et al. (2003) Kramer, M., et al. 2003, MNRAS, 342, 1299
- Ng & Romani (2007) Ng, C.-Y., & Romani, R. W. 2007, ApJ, 660, 1357
- Olbert et al. (2001) Olbert, C. M., Clearfield, C. R., Williams, N. E., Keohane, J. W., & Frail, D. A. 2001, ApJ, 554, L205
- Pacholczyk (1970) Pacholczyk, A. G. 1970, Radio Astrophysics. Nonthermal Processes in Galactic and Extragalactic Sources (San Francisco: Freeman)
- Romani et al. (2005) Romani, R. W., Ng, C.-Y., Dodson, R., & Brisken, W. 2005, ApJ, 631, 480
- Romanova et al. (2005) Romanova, M. M., Chulsky, G. A., & Lovelace, R. V. E. 2005, ApJ, 630, 1020
- Sault et al. (1999) Sault, R. J., Bock, D. C.-J., & Duncan, A. R. 1999, A&AS, 139, 387
- Sault et al. (1995) Sault, R. J., Teuben, P. J., & Wright, M. C. H. 1995, in ASP Conf. Ser., Vol. 77, Astronomical Data Analysis Software and Systems IV, ed. R. A. Shaw, H. E. Payne, & J. J. E. Hayes (San Francisco: ASP), 433
- Sault & Wieringa (1994) Sault, R. J., & Wieringa, M. H. 1994, A&AS, 108, 585
- Spruit & Phinney (1998) Spruit, H., & Phinney, E. S. 1998, Nature, 393, 139
- Taylor & Cordes (1993) Taylor, J. H., & Cordes, J. M. 1993, ApJ, 411, 674
- van Kerkwijk & Ingle (2008) van Kerkwijk, M. H., & Ingle, A. 2008, ApJ, 683, L159
- Vigelius et al. (2007) Vigelius, M., Melatos, A., Chatterjee, S., Gaensler, B. M., & Ghavamian, P. 2007, MNRAS, 374, 793
- Volpi et al. (2008) Volpi, D., Del Zanna, L., Amato, E., & Bucciantini, N. 2008, A&A, 485, 337
- Wardle & Kronberg (1974) Wardle, J. F. C., & Kronberg, P. P. 1974, ApJ, 194, 249
- Weltevrede & Johnston (2008) Weltevrede, P., & Johnston, S. 2008, MNRAS, 391, 1210
- Weltevrede (2010) Weltevrede, P., et al. 2010, ApJ, 708, 1426
- Whiteoak & Green (1996) Whiteoak, J. B. Z., & Green, A. J. 1996, A&AS, 118, 329
- Wilkin (1996) Wilkin, F. P. 1996, ApJ, 459, L31
- Yusef-Zadeh & Bally (1987) Yusef-Zadeh, F., & Bally, J. 1987, Nature, 330, 455
- Yusef-Zadeh & Gaensler (2005) Yusef-Zadeh, F., & Gaensler, B. M. 2005, Advances in Space Research, 35, 1129