Author(s) in page-headRunning Head \Received2009 August 17\Accepted2009 November 5
galaxies: clusters: individual (Perseus Cluster) - X-rays: galaxies: clusters - X-rays: individual (Perseus Cluster) - X-rays: spectra
Study of the Large-scale Temperature Structure of the Perseus Cluster with Suzaku
Abstract
We report on a study of the large-scale temperature structure of the Perseus cluster with Suzaku, using the observational data of four pointings of 30’ offset regions, together with the data from the central region. Thanks to the Hard X-ray Detector (HXD-PIN: 10 - 60 keV), Suzaku can determine the temperature of hot galaxy clusters. We performed the spectral analysis, by considering the temperature structure and the collimator response of the PIN correctly. As a result, we found that the upper limit of the temperature in the outer region is 14 keV, and an extremely hot gas, which was reported for RXJ 1347.5-1145 and A 3667, was not found in the Perseus cluster. This indicates that the Perseus cluster has not recently experienced a major merger.
1 Introduction
Clusters of galaxies are widely believed to grow up with repetition of small-scale cluster merging. Gravitational energy released in the merger process heats up intracluster plasma, and accelerates particles up to higher energy. Actually, in many clusters, diffuse synchrotron radiation from high energy electrons is detected by radio observations (e.g., A2163: Feretti et al. 2001). In addition, a sign of the hard X-ray emission, that is thought to be Inverse Compton Scattering (ICS) of the Cosmic Microwave Background by accelerated electrons, has been reported for some clusters (e.g., Coma cluster: Fusco-Femiano et al. 1999). Moreover, large temperature fluctuations are often found in clusters which are candidates of non-thermal hard X-ray emitters. Recent X-ray studies have reported that very hot plasma, whose temperature exceeds keV, exists in some merging clusters, such as RX J1347.5-1145 (Ota et al, 2008) and A 3667 (Nakazawa et al, 2009). As above, plasma heating and particle acceleration in clusters are inseparably connected phenomena. Therefore, search for these phenomena is important to understand the history of cluster evolution, especially for the physical mechanisms of plasma heating and energy transportation.
In this paper, we report on a study of the large-scale temperature structure of the Perseus cluster (Abell 426). The Perseus cluster is a nearby (z = 0.0183), massive, largely extended cluster, and is the most luminous cluster in the X-ray band. An X-ray bright active galaxy NGC 1275, with a radio mini-halo, is located at the cluster center, and non-thermal power-law emission from NGC 1275 was confirmed by past observations (e.g., Sanders et al, 2005). ASCA found a large fluctuation of temperature in this cluster, and indicated that a very hot region with the temperature exceeding keV exists in the outer region. Information on cluster merging should remain in the low-density outer rather than the dense central region. Therefore, it is very valuable to investigate the temperature structure and non-thermal emission in the outer region of the cluster carefully.
Determination of the temperature of hot regions with keV is difficult for detectors, whose energy band is limited below 10 keV (e.g. ASCA and XMM-Newton). Therefore, we should observe clusters with a detector, that is sensitive above 10 keV, so as to determine the temperature by covering the spectral roll-off of thermal emission. Therefore, we observed 30’ offset regions from the Perseus cluster center, with the HXD-PIN/XIS onboard Suzaku. HXD-PIN is a non-imaging detector of 64 PIN diodes, covering the hard X-ray band of 10-60 keV, and able to perform observations with a low background level and a small field of view (FOV) of 34’34’ (FWHM). A narrow field of view has advantage of reducing the contribution of the bright central region to the observed spectra. The XIS is a focal plane CCD detector with an X-ray Telescope (XRT), covering the soft X-ray band of 0.2-10 keV with an FOV of 18’18’. Combination of the XIS and HXD-PIN gives a broad band X-ray spectrum and thus we can determine the temperature structure of hot clusters. Throughout this paper, we adopt a Hubble constant of H0 = 50 h50 km s-1 Mpc-1. All statistical errors are given at 90% confidence level.
2 Observation and Data Reduction
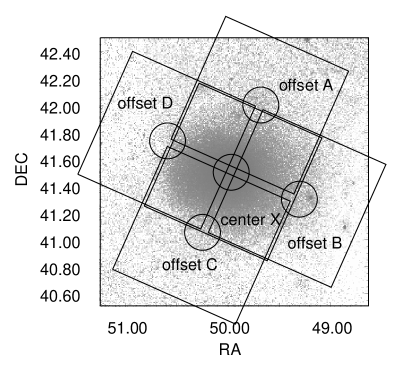
We observed the outer regions of the Perseus cluster on September 2-4, 2006, with Suzaku. Four pointing observations of 30’ offset regions from the cluster center were carried out. These observations make use of a narrow FOV of the PIN, by reducing the contribution of intense emission from the cluster center. Additionally, we also analyzed the Suzaku public data of observations of the Perseus cluster center, on February 1–2, 2006, August 29 – September 2, 2006, and February 5–6, 2007. Fig 1 and Table 1 summarize these observations.
| Position | Sequence No. | Date | RA, DEC | Exposure (HXD/XIS) |
|---|---|---|---|---|
| Center X | 800010010 | 2006/02/01-02 | 49∘.9504 / 41∘.5117 | 52ks/41ks |
| 101012010 | 2006/08/29-/09/02 | 49∘.9504 / 41∘.5117 | 129ks/- | |
| 101012020 | 2007/02/05-06 | 49∘.9504 / 41∘.5117 | 41ks/- | |
| Offset A | 801049010 | 2006/09/02-02 | 49∘.6833 / 42∘.0081 | 23ks/23ks |
| Offset B | 801049020 | 2006/09/02-03 | 49∘.3167 / 41∘.3131 | 24ks/24ks |
| Offset C | 801049030 | 2006/09/03-04 | 50∘.2625 / 41∘.0411 | 29ks/29ks |
| Offset D | 801049040 | 2006/09/04-04 | 50∘.6125 / 41∘.7464 | 6ks/6ks |
| Data of 101012010 and 101012020 were used only for the spectral analysis of the HXD-PIN. | ||||
We used the version 2.0 pipeline processing data, and data screening was performed with HEAsoft ver 6.2. HXD-PIN data were screened with a cut-off rigidity (COR) of 6 GV, elevation angle of 5o from the Earth rim, and good time intervals (GTI) during which the satellite is outside the South Atlantic Anomaly (SAA). We used ae_hxd_pinhxnome{1,2,3}_20080129.rsp for the HXD response matrix, and a ”tuned” background (bgd-d) for the non X-ray background (NXB) (Fukazawa et al. 2009) of the PIN detector. Both were supplied by the HXD team (Fukazawa et al. 2008). The cosmic X-ray background (CXB) contribution for the HXD data was estimated by using the CXB parameters of Kirsch et al.(2005) and considering the collimator response, and then subtracted from the observed spectra as well as the NXB.
Data screening of the XIS data was almost the same as for the HXD, except for applying the criteria of COR 8 GV and elevation angle of 20o from the Earth rim. Response matrix files (rmf) and auxiliary response files (arf) were generated by the FTOOL xisrmfgen and xissimarfgen (Ishisaki et al. 2007), respectively, and the NXB was estimated by the FTOOL xisntebgdgen (Tawa et al. 2008).
3 Analysis and Results
Observed PIN spectra contain photons coming from a large sky area of the cluster, due to its FOV of (FWHM). Therefore, we have to take into account this effect to determine the temperature structure of the cluster. On the other hand, the XIS can obtain the spectrum of small regions, while it cannot determine the temperature of hot gas above 10 keV accurately, because of the limitations of the energy band below 10 keV. In the following analysis, we applied the APEC model to represent thermal emission from the intracluster plasma. Furthermore, we multiplied the plasma model by the WABS model, to take account of the photoelectric absorption in the Galactic intersteller medium. Projection effects in the line of sight are not considered here.
3.1 Nuclear emission from NGC 1275
Nuclear X-ray emission from NGC 1275, which is located at the cluster center, has been reported by past studies, for example, XMM-Newton (Churazov et al. 2003), Chandra (Sanders et al. 2005) and Swift/BAT (Ajello et al. 2008). Eckert et al. (2009) showed that high-energy flux (30 keV) is variable over a time scale of several months with INTEGRAL data, and proved that the origin of the high-energy emission cannot be diffuse. Therefore, we have to estimate the X-ray flux of the nucleus as contamination, to obtain the accurate temperature structure.
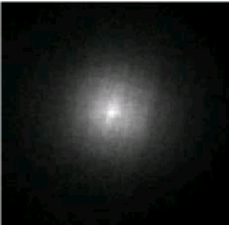
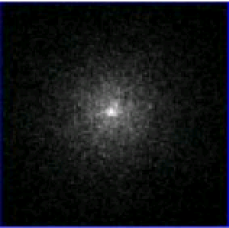


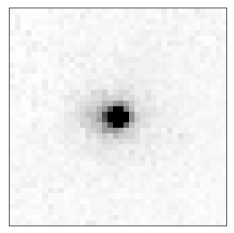
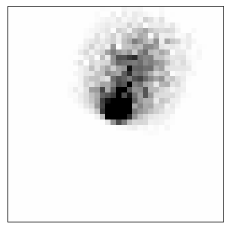
Fig 2 shows XIS images and radial surface brightness distributions in the 4-5 keV and 9-10 keV band. The central excess is clearly confirmed in the XIS image within 1’ radius, especially in the hard X-ray band. Taking into account the point spread function of the XRT/XIS, this central excess is consistent with a point source, that is, nuclear emission of NGC 1275. We performed spectral fitting for the region within 2’ radius, with a single temperature APEC plus POWERLAW model. We generated the arf with xissimarfgen by using the XIS image within 2 arcmin from the cluster center as a seed image. Here, the photon index of the POWERLAW model is a free parameter. We show the spectrum and best-fit parameters in Fig 3 and Table 2, respectively. The fit improves from /d.o.f = 2.38 to 1.31, when adding the POWERLAW model to the single temperature APEC model. The estimated power-law luminosity is erg s-1 (0.8-10 keV), in agreement with the value reported by Chandra (Sanders et al. 2005) of erg s-1 (within 3’ radius).

| kT | abundance | photon index | reduced | PL flux(0.8-10 keV) | total flux(0.8-10 keV) | |
|---|---|---|---|---|---|---|
| ( cm-2) | (keV) | (solar) | (-) | (/d.o.f) | (erg cm-2 s-1) | (erg cm-2 s-1) |
| 1.32 0.01 | 3.250.02 | 0.700.01 | 1.610.02 | 2048/1569 | 8.27 |
3.2 Overall Properties
In this section, as a preliminary step prior to the detailed analysis, we investigate the overall properties of the cluster temperature structure. At first, we analyzed the XIS data of the cluster center to obtain the temperature structure in the central region. We divided the XIS events into 4 annular regions of , , , in radius from the cluster center (Fig 4). The result of was given in the previous subsection. For the regions of , , , we performed spectral fitting with a single temperature APEC model. We generated the arf of each region with xissimarfgen by using the XIS image extracted in each spectral region as a seed image. Here, each region was assumed to be isothermal. Best-fit parameters for each region are summarized in Table 3. The total flux of the 4 annular regions is approximately erg cm-2 s-1 (0.8–10 keV), and consistent with the past results of ASCA (Fukazawa et al. 2004). The obtained temperature decrement and abundance increment toward the center are roughly consistent with the past results of XMM-Newton (Churazov et al. 2003) and ASCA (Ezawa et al. 2001).

| region | kT | abundance | reduced | flux(0.8-10 keV) | |
|---|---|---|---|---|---|
| (radius) | ( cm-2) | (keV) | (solar) | (/d.o.f) | (erg cm-2 s-1) |
| 2’ - 4’: | 1.070.01 | 4.600.01 | 0.550.01 | 3559/1696 | |
| 4’ - 6’: | 1.050.01 | 5.880.05 | 0.470.01 | 2018/1480 | |
| 6’ - 8’: | 1.050.01 | 6.450.08 | 0.420.01 | 1439/1158 |
Next, we derived the temperature by using the PIN data of the central observation. The PIN data of the three center observations were added so as to obtain enough data statistics. The arf was generated by the FTOOL hxdarfgen. The current version of hxdarfgen calculates the arf for a point source. Therefore, for this analysis, we divided a 2 deg 2 deg cluster image into 100100 regions, and calculate the arf for each region. These arf files are weight-averaged by intensity, based on the cluster image of the ROSAT-PSPC 111SkyView: http://skyview.gsfc.nasa.gov/. We tried to fit the PIN spectrum with a single temperature APEC model. Furthermore, in order to consider the emission from NGC 1275, we also tried to fit with a single temperature APEC plus POWERLAW model. Here, the photon index of the power law was fixed to 1.61, which is obtained by analysis of the XIS data in §3.1. The metal abundance of 0.4 solar is an average value in the center region, obtained from the XIS spectral analysis. To avoid the thermal noise of the PIN, we did not use the data below 15 keV for spectral fitting. The fitting results are shown in Table 4 and Fig 5. Without the POWERLAW model, the temperature is 7.2 keV. The estimated flux scaled to the total flux of the whole cluster region becomes 1.710-10 erg cm-2 s-1 (15-50 keV) or 1.8 10-9 erg cm-2 s-1 (0.8-10 keV), which is roughly consistent with the XIS results. With the POWERLAW, a temperature of 6.3 keV, and power-law luminosity of erg s-1 are obtained.
Next, we try to estimate the contribution of the central cool region to the PIN spectrum. We fitted the average XIS spectra within 8 arcmin with a single temperature APEC model, and obtained a temperature of 5.5 keV. Then, we fitted the PIN spectrum with a two-temperature APEC model plus powerlaw model. For one APEC model, the temperature and normalization are fixed to the values obtained from the above XIS analysis. Then, the temperature of the hot APEC component becomes 9.5 keV. Therefore, the XIS and PIN spectra do not need an extremely hot component.
| kT | abundance | photon index | reduced | PL flux(15-50 keV) | total flux(15-50 keV) |
|---|---|---|---|---|---|
| (keV) | (solar) | (-) | (/d.o.f) | (erg cm-2 s-1) | (erg cm-2 s-1) |
| 0.4 fixed | - | 54/39 | - | ||
| 0.4 fixed | 1.61 fixed | 42/38 |


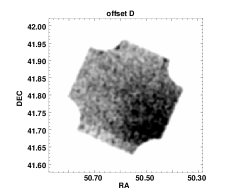
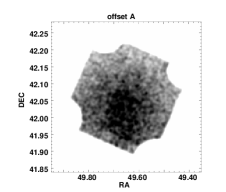
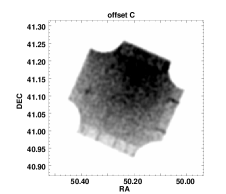
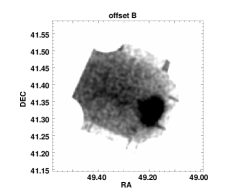
In the same way, we derived the temperature of each offset region, by using the offset XIS data (Fig 6), with a single temperature model. The absorption column density is fixed to 1.0 cm-2, which is the value obtained by the XIS analysis as shown in Table 3. Results are shown in Fig 5. The temperature is about 5 - 7 keV in any region, and a hot component with 10 keV is not required for XIS spectra. If we adopt a higher absorption column density as 1.2 or 1.4 cm-2, a slightly lower, by less than 0.5 keV, temperature is required. The iron abundance is about 0.2-0.3 solar. These results are roughly consistent with those reported by ASCA (Ezawa et al. 2001).
We used the ROSAT-PSPC image of the Perseus cluster as a seed image of xissimarfgen, that is, fluxes shown in Table 5 are scaled to the total cluster flux, taking account of the emission distribution of the cluster and the vignetting effect of the XRT. Then, the obtained flux of erg cm-2 s-1 (0.8-10 keV) is consistent with the XIS result of the center observation. This is also a consistency check that the XIS arf is correctly estimated.
| region | kT | abundance | reduced | flux(0.8-10 keV) | |
|---|---|---|---|---|---|
| (Area) | ( cm-2) | (keV) | (solar) | (/d.o.f) | (erg cm-2 s-1) |
| offsetA: | 1.0 fixed | 5.1 0.2 | 0.28 0.07 | 184/195 | 0.85 |
| offsetB: | 1.0 fixed | 5.3 0.1 | 0.17 0.03 | 435/440 | 1.47 |
| offsetC: | 1.0 fixed | 6.3 0.2 | 0.21 0.04 | 327/323 | 1.28 |
| offsetD: | 1.0 fixed | 5.8 0.5 | 0.32 0.15 | 46/50 | 1.03 |
For the PIN, the data are summed over four offset observations, because the emission from the offset regions is very faint for the PIN and sufficient statistics cannot be obtained from the individual observation. We performed spectral fitting by a single APEC model with metal abundance fixed to 0.25 solar. Best-fit result is shown in Fig 7 and Table 6. The temperature was obtained to be keV, somewhat higher than the XIS results.
Next, we performed a joint-fit of the XIS spectrum and the PIN spectrum. Here, we summed over the four offset spectra of XIS. We fitted spectra with a two-temperature APEC model. We fixed a lower temperature to 5.5 keV, which is the average temperature in the offset regions shown in Table 5. A higher temperature is set to be free. Then, a temperature of 8.7 keV is obtained for the higher temperature. Therefore, the XIS and PIN spectra do not need an extremely hot component in the offset region.
| kT | abundance | reduced | total flux(15-50 keV) |
| (keV) | (solar) | (/d.o.f) | (erg cm-2 s-1) |
| 0.25 fixed | 4.1/5 |

3.3 Consideration of the PIN collimator response
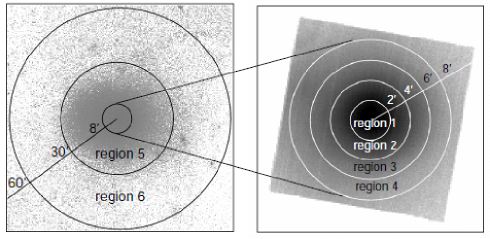
In the previous section, we roughly obtained the averaged temperatures in the FOV, and they are consistent with past observations. In this subsection, on the basis of above results, we investigate possible temperature structure by considering the collimator response of the PIN correctly. For that purpose, we implement the Monte-Carlo simulator that reproduces the PIN spectra of the Perseus cluster by considering the assumed temperature structure and the collimator angular response of the PIN. By comparing simulated spectra with actual observed spectra, we can find the temperature structure that reproduces the observed data the best. Here, we divide the cluster into six annular regions, 1 - 6, as shown in Fig 8. The definition of region 1–4 is the same as the previous XIS analysis of the center observation. As a first step, assuming the emission model parameters of region 1–4 to be those measured by XIS, we obtain the temperature of region 5 (8’ r 30’) by using the PIN data of the center observation. Next, assuming the temperature of region 5 to be the value obtained in the first step, as well as region 1-4 temperature, we obtain the temperature of region 6 (30’ r 60’) by using PIN data of the offset observations.
At first, we prepare the emission spectral model with an assumed temperature, for each region of region 1–6. The spectral model is created between 0.1 - 100 keV with 256 bins on a linear scale by the Xspec APEC model. In the simulator, we determine a random position of generated photons. We used a 2 deg 2 deg ROSAT-PSPC image of the Perseus cluster (Fig 9a) as a seed photon map. The image is divided into regions whose size is 3’ 3’. Then, we randomly determine an energy of generated photons, following the emission spectral model we assumed as above. Next, thus-generated photons are filtered by the angular response map, which is created by the FTOOL hxdarfgen for each observation. An example of the angular response map for 30 keV photons is shown in Fig 9b. The transmission efficiency of the collimator is almost constant below an energy of 50 keV. The number of simulated photons is for each observation. Output is a spectrum to which only the angular response of the PIN detector is applied. The simulated spectrum is read into Xspec as a model, and compared with the observed spectrum by spectral fitting, after the rmf is applied to the model. Here, only the normalization of the model is a free parameter.
(a)

(b)
(c)
First, we obtain the temperature of region 5, using the PIN data of the center observation. The emission models of region 1-4 are based on the XIS results in Tables 2 and 3. The temperature of region 5 is tested from 5 keV to 12 keV with a step of 0.5 keV, with metal abundance fixed to 0.35 solar. The emission model of region 6 is still unknown, and thus assumed to be the same as that of region 5. The fraction of incident photons from region 6 is approximately 1% of all photons, and thus their contribution is negligible. Moreover, the contamination of point sources in the FOV, for example IC 310 shown in the XIS image of offset B observation, is less than 1% of all photons, and thus their contribution is also negligible. We compare each simulated spectrum with the observed spectrum by adjusting the model normalization. The distribution for the temperature of region 5 is shown in Fig 10 (left). Here, the uncertainties of the XIS model parameters in region 1–4 are taken into account and error ranges are shown in the figure as dashed lines. The best-fit temperature of region 5 is 7 keV, and the error range is 6.6–7.4 keV at 90% confidence level. Fig 10 (right) shows the best-fit model and spectrum. The fraction of photon flux from region 1–6 in the best-fit simulated spectrum is 6.2%, 17.0%, 25.5%, 15.8%, 34.4%, 1.1%.


Next, to obtain the temperature of region 6 (30’ r 60’), we adopt the temperature of 7 keV for region 5, which is as obtained above, in addition to the emission model of region 1–4. The temperature of region 6 is tested from 5 keV to 15 keV with a step of 1 keV, with metal abundance fixed to 0.25 solar. We investigated the averaged-temperature of the four offset regions, by using the PIN spectrum summed over the four observations as in §3.1 and comparing it with the simulated spectrum. Results are shown in Fig 12. The best-fit temperature of region 6 is 9.0 keV. The upper limit is 14 keV at the 90% confidence level, while the lower limit is not well constrained. The fraction of photon flux from region 1–6 in the best-fit simulated spectrum is 2.9%, 7.8%, 14.3%, 11.0%, 40.2%, 23.8%. The number of photons from region 5 and 6 is more than 60 %, and the contribution from the central region is not so large in the offset observation. In fact, the temperature in region 6 does not depend so much on the power-law flux of NGC 1275. We considered the systematic errors due to the uncertainty of the NXB (Non X-ray Background) of HXD-PIN. The HXD-team announces that NXB models released by them have 3% uncertainty (Fukazawa et al. 2009). When we decreased the NXB by 3%, an upper limit of the temperature becomes 7.9 keV for region 5 and 19 keV for region 6.


3.4 Constraints to non-thermal emission from the cluster
Here, we constrain the non-thermal emission hidden by the thermal emission in the offset region of the Perseus cluster. First, we performed a naive spectral fitting for the offset PIN spectrum as §3.2 (without considering the PIN collimator response), with a model consisting of a single temperature APEC plus POWERLAW. Here, the metal abundance was fixed to 0.25 solar and the photon index of the POWERLAW model was fixed to 2.0. The best-fit spectrum is shown in Fig 12 (left). A POWERLAW component with a flux of 5.6 erg cm-2 s-1 (15 - 50 keV) was marginally required, but the significance is low.
Next, we performed the spectral fitting by considering the PIN collimator response as described in §3.3. We applied a simulated model where the temperature of region 6 is assumed to be 7 keV, the same as for region 5. In this case, a more realistic upper limit is obtained than the naive analysis because the temperature gradient at the center region and the hard emission from NGC 1275 are taken into account in this analysis. Actually, a tighter upper limit of 4.4 erg cm-2 s-1 is obtained as shown in Fig 12 (right) and Table 7 (bottom).


| photon index | reduced | PL flux(15-50 keV) | total flux(15-50 keV) |
|---|---|---|---|
| (-) | (/d.o.f) | (erg cm-2 s-1) | (erg cm-2 s-1) |
| 2.0 fixed | 4.7/5 | (upper limit) |
4 Discussion
4.1 Temperature structure

The radial temperature profile obtained in this work is shown in Fig 13. Error bars in the figure present the 90% confidence level, though systematic errors due to the NXB uncertainty of the HXD-PIN are not shown here. Distinct features of the temperature structure are a steep decline toward the center and a relatively flat profile in the outer region. XIS results in the offset regions give a lower temperature than the PIN analysis. This is possibly because the XIS is sensitive to a lower temperature component, if two different temperature (hot and cool) components exists at different regions along the same line of sight. Therefore, the results of the XIS and the PIN do not necessarily conflict with each other. Most importantly, we found that the upper limit of the temperature of the offset region, where hot components seem to exist, is at most 14 keV ( 19 keV within the systematic errors). Considering that the XIS spectra do not require the hot component, it seems that very hot gas as reported in RXJ 1347.5-1145 (Ota et al. 2008) or A 3667 (Nakazawa et al. 2009) does not exist in the Perseus cluster. In this analysis, we could not study temperature fluctuations due to the low data statistics of the offset observations. But the average temperature in each offset region is not inconsistent with the results of ASCA (Furusho et al. 2001).
Temperature structure with a negative gradient towards the center and a roughly flat external plateau is typical for cooling flow type clusters (Pointecouteau et al. 2005). These clusters, showing a strong cooling core, are thought to be gravitationally relaxed. Actually, most colliding-type clusters do not show such a cooling core. Therefore, we infer that the main body of the Perseus cluster has been already relaxed, and has not recently experienced a violent cluster merger, which greatly influences the temperature structure of the cluster. On the other hand, ROSAT and other X-ray observatories found an excess of the surface brightness at 20’ east from the cluster center (Ettori et al. 1998). Moreover, ASCA found a temperature drop at the corresponding region (Furusho et al. 2001). Therefore, it is implied that a small-scale substructure, such as a small galaxy cluster or group with cool gas, is currently colliding with the main body of the Perseus cluster.
We consider two reasons why extremely hot gas does not exist in the Perseus cluster, even though some evidences of the cluster merger were found as described above. The first reason is that the present merging is in the latest phase, that is, extremely hot gas heated in the long past has already cooled down. The second reason is that heating condition is not satisfied in the current merging. In the case of RXJ 1347.5-1145 (Ota et al. 2008), though it depends on various cluster parameters, extremely hot gas seems to take approximately 0.5 109 yrs to cool down by radiation. On the other hand, the cold substructure in the Perseus cluster must have been created in recent 109 yr, considering the diffusion time of the ICM (Furusho et al. 2001), and this is roughly comparable to the cooling time of extremely hot gas. Accordingly, the picture that only the extremely hot gas cooled down without diffusion of the cold gas is not natural. Therefore, the first reason, that a violent cluster merger occurred in the long past and extremely hot gas has already cooled down, is unlikely. Hence, the second reason is preferred. According to Kitayama et al. (2004) and Ota et al. (2008) with help of Takizawa (1999), a high velocity ( 4500 km s-1) collision of two massive (5 1014 M⊙) clusters is needed to heat the ICM up to 20 keV or higher for RXJ 1347.5-1145. In the case of the Perseus cluster, the total mass, including the cold substructure, is 1.2 1015M⊙, according to Ettori et al. (1998). However, the mass of the subcluster is much less than the total mass, probably by one or two orders of magnitude. Then, it may be difficult to heat up the ICM to a high temperature, if the mass difference of two merging clusters is very large. Actually, according to Takizawa et al. (1999), two-cluster merging, with a mass ratio of 4, could heat up the ICM to at most 13 keV. Therefore, it is inferred that the current Perseus cluster is already grown up enough, and not in a violent merger phase. Though it is just speculation, a history of the cluster formation may be divided into two phases. In the early phase, clusters or groups with almost the same mass repeat violent mergers and grow up. In the latest phase, a grown-up large cluster cannibalizes small-scale galaxies clusters or groups. Therefore, comparison between the spatial distribution of merging clusters and relaxed clusters is interesting to understand the evolution of the galaxy clusters and the large-scale structure of the universe.
4.2 Non-thermal emission from the Perseus cluster
In our analysis, we obtained the upper limit flux of the non-thermal
emission as 4.4 10-12 erg cm-2 s
-1 (15 - 50 keV) at the cluster offset region.
So far, the Perseus cluster has been often observed by X-ray
satellites, such as ASCA, XMM-Newton,
Chandra, Swift/BAT (Ajello et al. 2009) and so on.
However the non-thermal emission from the cluster itself has not been
discussed well, because the thermal emission from the
cluster core is very bright
and furthermore the AGN emission from NGC 1275 must be considered.
In this paper, we performed observations of cluster offset regions, by
reducing the bright emission from the cluster center.
In addition, we considered the contribution of the AGN emission from
NGC 1275.
Therefore, this may be the first robust result of an upper limit of
non-thermal emission from the Perseus cluster.
Assuming the distance to the Perseus cluster to be 75 Mpc, the corresponding
upper limit luminosity is 3.0 1042 erg s-1.
This limit is tighter than those of other clusters
observed with Suzaku HXD-PIN, such as A 3376 (Kawano et al. 2009) and
A3667 (Nakazawa et al. 2009), owing to the proximity of the Perseus
cluster. Considering no report of radio detection of the largely
extended synchrotron emission like Coma cluster, there is yet no
evidence of particle acceleration in the Perseus
cluster. This result also supports that the Perseus
cluster is not in a violent cluster merger phase, as inferred from
the ICM temperature studies.
The authors thank Dr. Jelle Kaastra for careful reading and many useful comments. The authors also thank the Suzaku team for development of hardware/software and operation. SN is supported by Research Fellowships of the Japan Society for the Promotion of Science for Young Scientists.
References
- [1] Ajello, M., Rebusco, P., Cappelluti, N., Reimer, O., Böhringer, H., Greiner, J., Gehrels, N., Tueller, J., Moretti, A., 2009, ApJ 690, 367
- [2] Churazov, E., Forman, W., Jones, C., Böhringer, H., 2003, ApJ 590, 225
- [3] Eckert, D., Paltani, S., 2009, A&A 495, 415
- [4] Ettori, S., Fabian A.C., White, D. A., 1998, MNRAS 300, 837
- [5] Ezawa, H., Yamasaki, N, Y., Ohashi, T., Fukazawa, Y., Hirayama, M., Honda, H., Kamae, T., Kikuchi, K., Shibata, R., 2001, PASJ 53, 595
- [6] Fabian, A.C., Sanders, J.S., Ettori, S., Taylor, G.B., Allen, S.W., Crawford, C.S., Iwasawa, K., Johnstone, R.M., Ogle, P.M., 2000, MNRAS, 318, L65
- [7] Feretti, L., Fusco-Femiano, R., Giovannini, G., Govoni, F., 2001, A&A 373, 106
- [8] Fukazawa, Y., Makishima, K., Ohashi, T., 2004, PASJ 56, 965
- [9] Fukazawa, Y., Mizuno, T., Watanabe, S., Kokubun, M., Takahashi, H., Kawano, N., Nishino, S., Sasada, M., Shirai, H., Takahashi, T., Umeki, Y., Yamasaki, T., Yasuda, T., Bamba, A., Ohno, M., Takahashi, T., Ushio, M., Enoto, T., Kitaguchi, T., Makishima, K., 2009, PASJ 61, S17-S33
- [10] Furusho, T., Yamasaki, N., Ohashi, T., Shibata, R., & Ezawa, H., Apj 561, L165, 2001
- [11] Fusco-Femiano,R., dal Fiume, D., Feretti, L., Giovannini, G., Grandi, P., Matt, G., Molendi, S., & Santangelo, A. 1999, ApJ, 513, 21
- [12] Ishisaki, Y. et al. 2007, PASJ 59, 113
- [13] Kawano, N., Fukazawa, Y., Nishino, S., Nakazawa, K., Kitaguchi, T., Makishima, K., Takahashi, T., Kokubun, M., Ota, N., Ohashi, T., Isobe, N., Henry, J. P., Hornschemeier, A., 2009, PASJ 61, 377
- [14] Kirsch, M. G. et al, 2005, Proc. SPIE 5898, 22
- [15] Kitayama, T., Komatsu, E., Ota, Naomi., Kuwabara, T., Suto, Y., Yoshikawa, K., Hattori, M., Matsuo, H., 2004, PASJ 56, 17
- [16] Kokubun, M. et al. 2007, PASJ 59, 53
- [17] Koyama, K. et al. 2007, PASJ 59, 23
- [18] Mitsuda, K. et al. 2007, PASJ 59, 1
- [19] Nakazawa, K., Sarazin, C. L., Kawaharada, M., Kitaguchi, T., Okuyama, S., Makishima, K., Kawano, N., Fukazawa, Y., Inoue, S., Takizawa, M., Wik, D. R., Finoguenov, A., Clarke, T. E., 2009, PASJ 61, 339
- [20] Ota, N., Murase, K., Kitayama, T., Komatsu, E., Hattori, M., Matsuo, H., Oshima, T., Suto, Y., Yoshikawa, K., 2008, A&A 491, 363
- [21] Pointecouteau, E., Arnaud, M., Pratt, G. W., 2005, A&A 435, 1
- [22] Sanders, J.S., Fabian, A.C. & Dunn, R.J.H., 2005, MNRAS, 360, 133
- [23] Takahashi, T. et al. 2007, PASJ 59, 35
- [24] Takizawa, M., 1999, ApJ 520, 514
- [25] Tawa, N. et al. 2008, PASJ 60, 11