The Westerbork SINGS survey III.
A sample of large northern Spitzer Infrared Nearby Galaxies Survey (SINGS) galaxies was observed with the Westerbork Synthesis Radio Telescope (WSRT) at 1300 – 1760 MHz. In Paper II of this series, we described sensitive observations of the linearly polarized radio continuum emission in this WSRT-SINGS galaxy sample. Large-scale magnetic field structures of two basic types are found: (a) disk fields with a spiral topology in all detected targets; and (b) circumnuclear, bipolar outflow fields in a subset. Here we explore the systematic patterns of azimuthal modulation of both the Faraday depth and the polarized intensity and their variation with galaxy inclination. A self-consistent and fully general model for both the locations of net polarized emissivity at 1 – 2 GHz frequencies and the global magnetic field topology of nearby galaxies emerges. Net polarized emissivity is concentrated into two zones located above and below the galaxy mid-plane, with the back-side zone suffering substantial depolarization (by a factor of 4 – 5) relative to the front-side zone in its propagation through the turbulent mid-plane. The field topology which characterizes the thick-disk emission zone, is in all cases an axisymmetric spiral with a quadrupole dependance on height above the mid-plane. The front-side emission is affected by only mild dispersion (10’s of rad m-2) from the thermal plasma in the galaxy halo, while the back-side emission is affected by additional strong dispersion (100’s of rad m-2) from an axi-symmetric spiral field in the galaxy mid-plane. The field topology in the upper halo of galaxies is a mixture of two distinct types: a simple extension of the axisymmetric spiral quadrupole field of the thick disk and a radially directed dipole field. The dipole component might be a manifestation of (1) a circumnuclear, bipolar outflow, (2) an in situ generated dipole field, or (3) evidence of a non-stationary global halo.
Key Words.:
ISM: magnetic fields – Galaxies: magnetic fields – Radio continuum: galaxies1 Introduction
The magnetic fields in spiral galaxies are an important component, but their basic three dimensional topology remains largely unknown. Two of their main characteristics are however, known. First, the fields in relatively face-on spiral galaxies are seen to follow the spiral pattern traced in the optical morphology. In the handful of more edge-on galaxies that have been imaged to date, the field distributions are seen to extend into the halo regions, and have a characteristic X-shaped morphology (eg. Heesen et al. 2009). Apart from these basic properties, the details of the magnetic field topology are unknown.
Observations of polarized flux, polarization vector orientations, and Faraday rotation measures all provide information about the magnetic field associated with different electron populations and at different projections with respect to the line of sight. Synchrotron emission originates in ultrarelativistic electrons spiralling around magnetic field lines, is beamed in the direction of motion of the electron, and is polarized perpendicular to the orientation of the field line. Polarized synchrotron radiation and polarization vector orientation are thus direct tracers of the magnetic fields perpendicular to the line-of-sight (LOS), , within the region where both ordered magnetic fields and relativistic electrons are maximized. The Faraday rotation measure (RM), or more generally the Faraday depth, , that pertains to a given component of polarized emission, is sensitive to the integrated product of magnetic field component parallel to the LOS () and the thermal electron density in the foreground of a polarized emission component:
| (1) |
The Faraday depth is defined to be positive when points toward the observer, and negative when points away. When assessing the magnetic field geometry traced by these observational characteristics, it is essential to keep in mind that the observable attributes may originate in distinct regions of space. The classical Faraday rotation measure (RM) is an observable quantity derived from the polarization angle difference(s) between two (or more) frequency bands as . The empirically determined RM is only equivalent to the Faraday depth for a simple background emitter plus foreground dispersive screen geometry.
Polarized emission can become depolarized in a number of ways: beam depolarization can arise because the spatial resolution element is large relative to the size of significant variations in the field orientation or the thermal electron content, while Faraday depolarization can arise because synchrotron emission and Faraday rotation take place in the same extended volume along the LOS. Polarized emission from different locations (either separated spatially or along the LOS) is affected by different amounts of Faraday rotation, such that at a given wavelength there may be orthogonal polarization angles that cancel, yielding no net polarization at that wavelength. Beam depolarization can be circumvented in principle by using higher angular resolution, although the brightness sensitivity may then be insufficient to detect the extended emission at all. Faraday depolarization can be circumvented in principle by achieving a sufficiently complete sampling of the measurement space (relevant for measurements of RM and ), since cancellation effects are confined to discrete wavelengths or ranges of wavelength.
All of these observables can be used to constrain the likely magnetic field topology in the galaxies observed. In a previous paper (Heald et al. (2009), hereafter Paper II), we presented our polarimetric results for a large sample of nearby galaxies observed to a comparable sensitivity limit of about 10 Jy beam-1 RMS. In this paper, we begin by briefly summarizing the observations and data reduction steps of Paper II in Sect. 2. Trends noted in the data are described in Sect. 3. In Sect. 4, we then explore how particular magnetic field geometries might relate to the observations. We conclude the paper in Sect. 5.
2 Summary of observations and data reduction
The observational parameters and data reduction techniques of the WSRT-SINGS survey were presented in detail both by Braun et al. (2007), and specifically regarding the polarization data in Paper II. Here we recap the most important details. For more information, the reader is referred to Sect. 2 and Appendix A of Paper II.
The data used in this analysis were obtained using the Westerbork Synthesis Radio Telescope (WSRT). Two observing bands were used: of MHz and MHz (centered on 22- and 18-cm, respectively), there being 512 channels in each band and in all four polarization products. Each galaxy in the WSRT-SINGS sample (refer to Paper II) was observed for 12 hr in the Maxi-short configuration of the WSRT. During each 12 hr synthesis, the observing frequency was switched between the two bands every 5 min. This provided an effective observation time of 6 hr per band, and good coverage in both bands.
The data for both bands were analyzed using the Rotation Measure Synthesis (RM-Synthesis) technique (Brentjens & de Bruyn 2005, see also Paper II). This provides the possible reconstruction of the intrinsic polarization vectors along each LOS, within the constraints set by the observing frequencies. The output of the RM-Synthesis procedure was deconvolved along the Faraday depth () axis, as described in Paper II. Polarized fluxes, polarization angles, and Faraday depths were extracted from these data and are discussed for each target galaxy in Paper II. In that paper, we also estimate the contribution to the RM from the Milky Way foreground using only background radio sources in the observed fields, rather than the target galaxies themselves. With this collection of data, we noted several patterns in the target galaxies, and that the basic patterns were common to the sample galaxies collectively. In this paper, we seek to explain these patterns using a common global magnetic field topology.
3 Observational trends
Several interesting patterns emerge from our study of a large sample of galaxy types. Polarized emission is found to originate both in the disks of actively star-forming galaxies and in what appear to be either AGN or star-formation driven (circum-)nuclear or galactic wind outflows. “Disk” emission is relatively planar and detected out to large radii, whereas apparent “outflow” components extend much further from the plane and are only detectable at small radii. The magnetic field orientations are in all cases simply related to the morphology of these components (as shown in Fig. 4 of Paper II).
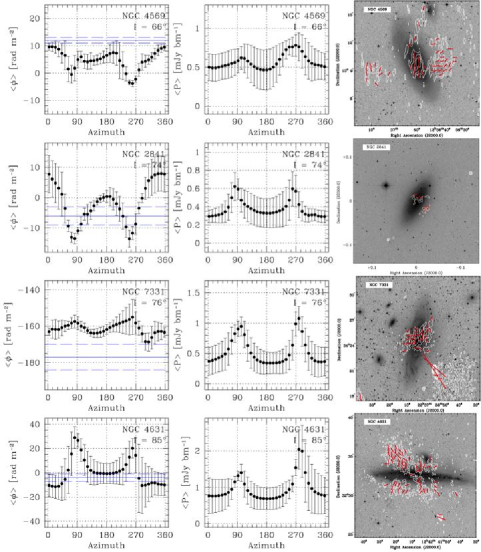
Disk fields have a spiral morphology that is strongly correlated with the orientation and pitch angle of traditional tracers of spiral arms, such as massive stars and dust lanes. This is despite the polarized emission possibly being both coincident with, and independent of, other spiral arm tracers. Classic examples of disk-dominated fields can be seen in galaxies such as NGC 628, 5194, and 6946, although they are present in almost all of our targets with varying detectability. On the other hand, outflow-related fields are typically oriented along the periphery of the bipolar lobes, and are often brightest close to the disk. The contribution of outflow-related components may be apparent in NGC 4569, 4631, and possibly 4736.
Here, we illustrate and describe some of the trends present in the WSRT-SINGS dataset. We consider the polarized flux distribution (Sect. 3.1), the Faraday depth distribution (Sect. 3.2), the effects of depolarization in (Sect. 3.3 and Sect. 3.4). In Sect. 4, we explore the predictions of a variety of global magnetic field topologies that can be used to model these trends.
3.1 Polarized flux
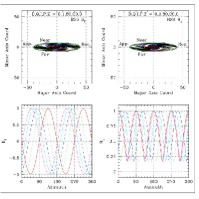
A remarkable pattern emerges for our sample relating to the basic distribution of polarized intensity in galaxy disks at GHz frequencies. For small inclination angles, there is a general gradient in the average polarized intensity that is approximately aligned with the major axis of the target galaxy. This gradient from high to low polarized intensity has the same sign in all well-detected cases, from high values on the kinematically approaching major axis to low values on the receding major axis. This effect cannot be explained by a symmetric planar field geometry. As the inclination of the target galaxy increases, a pair of local maxima in polarized intensity begins to separate from the approaching major axis and propagates toward the minor axis. This is simply a geometrical effect because maximum polarized emission emerges from magnetic fields perpendicular to the line of sight, which, in the case of a planar field geometry, are strongest near the minor axis (Stil et al. 2009). Even when the inclination has become quite substantial, and the two local maxima of polarized intensity are near the minor axis, there is still a systematic tendency for the receding major axis to have the overall minimum polarized brightness.
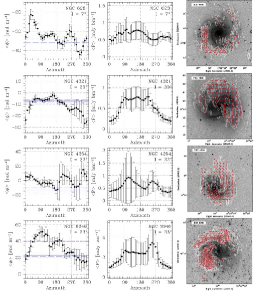
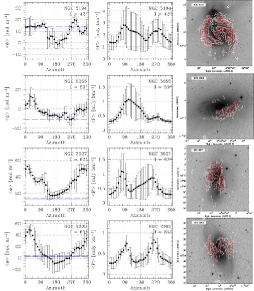
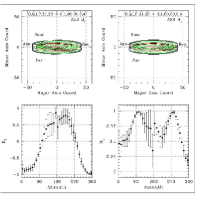
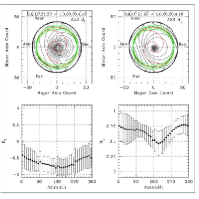
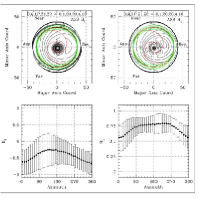
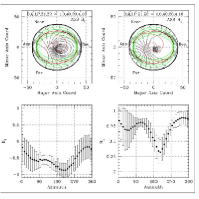
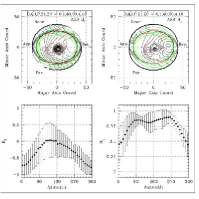
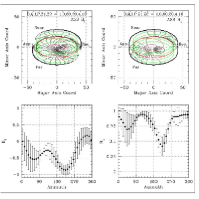
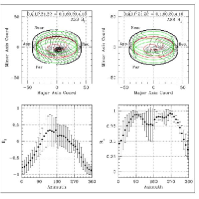
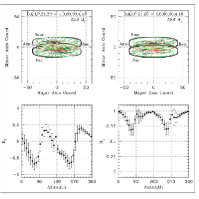
This pattern in the distribution of polarized flux in our target galaxies is visible first of all in Fig. 4 of Paper II, which shows maps of the polarized flux in each galaxy. We quantify this trend in Fig. 1 by plotting the average peak polarized intensity, , and the associated Faraday depth, , within inclination-corrected wedges spanning 10 degrees of azimuth in the disk of each galaxy in which extended polarized emission was detected. Azimuth is measured counter-clockwise from the kinematically receding major axis (see Table 1 of Paper II for basic data on each target). Error bars on the points in the plots represent the RMS variation within each wedge. The estimated foreground contribution to and its error caused by our own Galaxy toward each target is indicated by the horizontal lines. The pairs of panels in the figure have been ordered by increasing galaxy inclination (top to bottom) extending from less than 10 degrees for NGC 628 to about 85 degrees in NGC 4631.
The simple trend described above is clear, the polarized intensity showing a global minimum toward the receding major axis and there being a systematic progression from one broad maximum at the approaching major axis to a pair of maxima that move to the minor axes as the inclination increases. The latter effect is due to geometry of a planar field, while the former one has no current explanation. We note that the polarization asymmetry along the major axis is not as pronounced at frequencies of 5 GHz and higher (see e.g. Beck (2007)).
3.2 Faraday depth
The variation in Faraday depth with azimuth (shown in Fig. 1) also shows systematic trends with increasing inclination, although not as cleanly as those seen in polarized intensity. One complication is that each Faraday depth distribution can be either positive or negative, so both options need to be considered in assessing a possible trend with inclination. Another complication is the uncertainty in the foreground contribution to , which is critical in distinguishing peaks (be they positive or negative) in the modulation patterns from minima (consistency with that foreground level). What is immediately clear from an assessment of the patterns is that they are in no case consistent with being symmetric sinusoids (either of period or ) in their excursions about the estimated foreground Faraday depth. The implication is that a thin axisymmetric or bisymmetric spiral disk is not a viable model for the medium responsible for the Faraday rotation of the polarized emission detected at these frequencies (cf. Krause 1990).
The pattern that applies to a large fraction of our sample has a minimum Faraday depth (consistent with the estimated foregound) that occurs close to the approaching major axis (at an azimuth of 180∘) and a single maximum excursion near the receding major axis at low inclinations. This same pattern applies to many of the eight lowest inclination galaxies and would also apply to NGC 6946 if the previously published estimate of the Galactic foreground value, by Beck (2007), were the correct one, rather than the we estimate in Paper II. A similar consideration applies to NGC 5194, for which Horellou et al. (1992) estimated rather than our estimate of . We plotted these alternate estimates of in the figure with horizontal lines. We also note here a typographical error in the value of for NGC 4321 in Table 1 of Paper II, which is and not as stated there. This pattern of maximum and minimum is not a simple sinusoid but has a clear asymmetry about an azimuth of 180∘ that is most obvious in NGC 4321 and 6946. When the inclination exceeds 65∘, there is a sudden change to a pattern of two peaks near the minor axis that is found in all four of the highly inclined galaxies in our sample. It may well be of further significance that several (and possibly all) of these highly inclined galaxies had already been identified as having a morphology suggestive of a circum-nuclear or galactic wind outflow.
Another critical observation is the magnitude of the Faraday depth excursions from the foreground value, which is in all cases very modest, typically between 10 and 30 rad m-2. This is substantially less than the Faraday depth variations measured through the entire disk of the Large Magellanic Cloud by Gaensler et al. (2005) using distant background sources that show average excursions of plus and minus 50 rad m-2 and peak excursions of 245 and 215 rad m-2. Since the LMC is in no way a remarkable galaxy in terms of its likely field strength (based on the synchrotron surface brightness) or thermal electron populations (based on the star-formation-rate density) relative to our sample galaxies, the implication is that the medium responsible for the Faraday rotation of the diffuse polarized emission in our targets only extends over a small fraction of the complete line-of-sight. A similar conclusion was reached by Berkhuijsen et al. (1997) for NGC 5194 based on the smaller Faraday depths seen at 1.4-1.8 GHz relative to 5-10 GHz for that target.
An important conclusion that follows directly from a comparison of the and plots is that the polarized intensity and the Faraday rotation in the highly inclined galaxies of our sample must originate in distinct regions along the line-of-sight. This is because is proportional to B∥, while is proportional to . For any given field geometry, a peak in B∥ will be accompanied by a minimum in and vice versa. The observation that maximal excursions of both and are seen in all four of the most inclined galaxies cannot be achieved with any co-extensive geometry of the emitting and dispersing media.
3.3 Depolarization
In addition to detecting a systematic pattern of Faraday depth excursions across the full LMC disk, Gaensler et al. (2005) also document the very substantial depolarizing effect of the LMC disk on background polarized sources observed at 1.4 GHz. Despite a likely mean angular source size of only about 6 arcsec, which projects to 1.5 pc at the LMC disk, these sources are more depolarized (by a factor of more than two) when the LOS is associated with thermal electrons in the LMC disk exceeding an emission measure of about 50 pc cm-6. The implication appears to be that significant RM fluctuations are present at the 1.4 GHz observing frequency on scales 1.5 pc. Since even the diffuse ionized gas that permeates galaxy disks has an emission measure in excess of about 20 pc cm-6 in moderately face-on systems (e.g., Greenawalt et al. 1998), we can expect a significant degree of depolarization for any “backside” emission in our galaxy sample. This will be true in particular for the diffuse polarized emission originating in the target galaxy itself, since the relevant scale is then that of the observing beam, 15 arcsec, which projects across more than 700 pc at the typical galaxy distance of 10 Mpc.
It therefore seems likely that the polarized intensity from low inclination galaxy disks observed at GHz frequencies is dominated by emission from that portion of the galaxy disk/halo that faces us. Corresponding structures from the far side of the galaxy would be dispersed and depolarized by turbulent magneto-ionic structures in the star-forming mid-plane. We recall that it is only in those regions dominated by a regular rather than a turbulent magnetic field that a net polarized emissivity is expected at all. Given the strong concentration of massive-star formation and its associated turbulent energy injection into the mid-plane, there may well be two zones of enhanced net polarized emissivity that are offset above and below the mid-plane. Each region of polarized emissivity will then experience the dispersive effects of its own line-of-sight foreground, which is likely to be dominated by thermal rather than relativistic plasma. For the near-side polarized emission, this is likely to be caused by the extended thermal halo of the host galaxy, while for the far-side polarized emission there will be the additional contribution of the dense (depolarizing and dispersive) mid-plane.
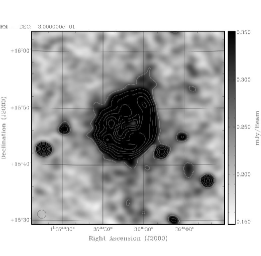
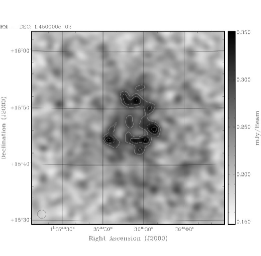
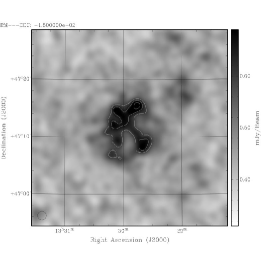
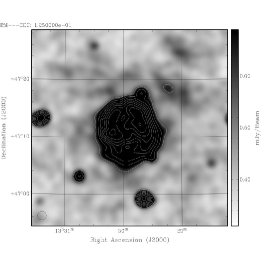
3.4 The “second” polarized disk
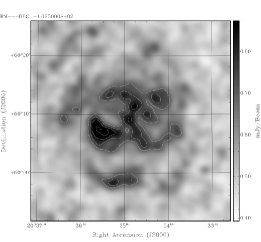
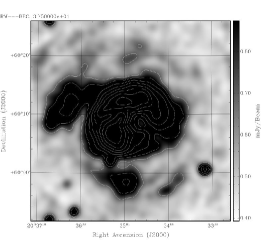
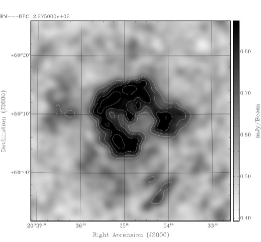
Because of the likely Faraday depth of the mid-plane medium, it is conceivable that the near- and far-side polarized emission zones in moderately face-on galaxies would experience very different Faraday dispersion, making it possible to distinguish the two components along each line-of-sight usingthe RM synthesis technique, which we employed in our study. We conducted a deep search for multiple Faraday depth components along the line-of-sight to detect disk emission from each of our sample galaxies, after applying a spatial smoothing to the cubes that results in an angular beamsize of 90 arcsec. Solid detections of faint secondary emission components were made in the brightest face-on galaxies of our sample, as shown in Figs. 2–4. In addition to the bright polarized emission that typically resides at a Faraday depth within only a few tens of rad m-2 of the Galactic foreground value, much fainter polarized emission (by a factor of 4 – 5) is detected in NGC 628, 5194, and 6946, which is offset to both positive and negative Faraday depths by about 200 rad m-2. We first considered whether these faint secondary components might be instrumental in nature, since they are similar to the Faraday depth side-lobes of our instrumental response (as described in Paper II), but concluded that they are likely reliable. Indicators of the reliability of these faint components are that (1) they do not occur toward the brightest low dispersion components; (2) the Faraday depth separation of the secondary components varies from source to source, while the instrumental sidelobe response does not; and (3) the faint positive and negative-shifted components form a complementary distribution of eachother, rather than merely repeating themselves in detail.
Detection of this highly dispersed and probably depolarized “second disk” supports the emerging model in which the polarized intensity observed at GHz frequencies from nearby galaxy disks is dominated by a region of emissivity located above the mid-plane on the near-side, which subsequently experiences Faraday rotation within the extended halo of the galaxy amounting to only a few tens of rad m-2. Significantly fainter polarized emission (by a factor of 4 – 5) is detected from the farside of the mid-plane, which displays the additional dispersive effects of that mid-plane zone amounting to plus and minus 150 – 200 rad m-2 within the three galaxies where this could be detected.
, ,
,
, ,
,
, ,
,
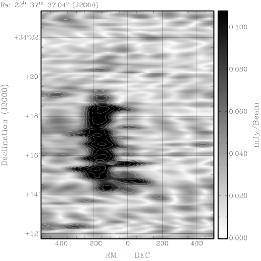
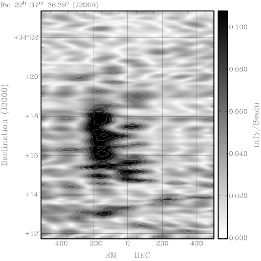
3.5 Small-scale RM fluctuations
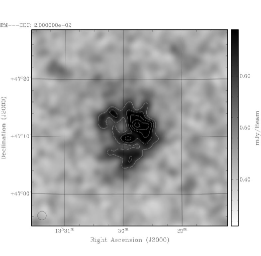
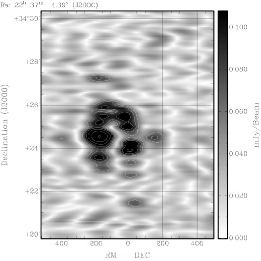
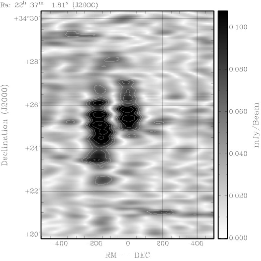
Extremely small-scale RM fluctuations within our own Galaxy were discovered in our sample data for the field of NGC 7331. This target is observed through the Galaxy near , within an extended () region of particularly large negative RMs near (e.g., Johnston-Hollitt et al. 2004). A corresponding region of large positive Galactic RMs is centered near . These two regions correspond to the directions where we look directly along what is likely to be the axisymmetric spiral field of the Galaxy (e.g., Sun et al. 2008). Diffuse polarized emission from the lobes of a background head-tail radio galaxy, the disk of NGC 7331, and even the Galactic synchrotron itself display the remarkable oscillatory behavior of the Faraday depth of the polarized emission with position in the field. As shown in the Faraday depth versus declination slices of Figs. 5 and 6, there are two dominant Faraday depths present in this field, one near and the other near . Depending on the exact location along the indicated declination slice, either one or the other of these RMs are encountered. In some regions, the transition from one RM to the other is well-resolved and a single RM value is observed over several beam-widths (of about 20 arcsec or 0.1 pc at a distance of 1 kpc), while in other regions the transition is unresolved, such that both RMs overlap spatially with only the peak polarization showing the oscillation between the two values. When completely unresolved extra-galactic sources are observed in this field, they display only one or the other of these two possible foreground RMs (compare Table 2 of Paper II), but more extended sources show an oscillation between the two values, occurring 3 – 4 times as often as . The regular Galactic magnetic field appears to be organized into discrete filamentary components with transverse sizes significantly less than a parsec.
, ,
,
, ,
,
4 Magnetic field distributions
The observational results summarized in Sect. 3 suggest a magnetic field geometry dominated by an in-plane field described by an axisymmetric spiral structure (ASS) and/or possibly a bi-symmetric spiral structure (BSS). These topologies assume a planar field configuration (in the plane) given by a family of logarithmic spirals defined in radial coordinates by the form
| (2) |
for a radial scaling constant, , an angular scaling constant, , which is related to the spiral pitch angle, , by,
| (3) |
and an angular offset, , which defines each curve in the family. We find it convenient to use the complement of the spiral pitch angle, given by,
| (4) |
The right-handed cartesian components of an inward directed planar ASS logarithmic spiral are then given by,
| (5) | |||||
| (6) | |||||
| (7) |
For the corresponding case of a planar BSS magnetic field with the usually assumed sinusoidal modulation of with , we have,
| (8) | |||||
| (9) | |||||
| (10) |
where is used to track the positive peak in the field modulation pattern from an initial value such that,
| (11) |
at radius , in terms of the spiral scaling constants defined above, and .
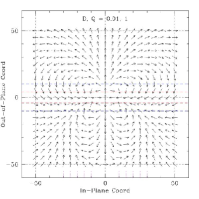
The out-of-plane field topology is not well-constrained by previous observations, but might be expected to have either an even or odd configuration of the symmetry about the mid-plane (see Fig. 2 of Widrow 2002). An even configuration corresponds to the case where the azimuthal (toroidal) component of the field has the same sign both above and below the mid-plane. The resulting field geometry has a quadrupole structure in the poloidal field and is the one predicted to emerge most naturally from an dynamo operating at intermediate to large radii in a galactic disk, where differential rotation is important (Elstner et al. 1992). An odd-parity configuration has the opposite signs of the azimuthal field above and below the mid-plane. The associated structure of the poloidal field is that of a dipole. This topology may be associated with the dynamo process that may be dominant within the circum-nuclear regions where solid body rotation may prevail in galaxies (Elstner et al. 1992). The dynamo in galactic halos may also generate dipolar fields Sokoloff & Shukurov (1990).
Of stronger relevance is the expected height above and below the mid-plane at which the polarized synchrotron emission might originate. From the discussion in Sect. 3, we expect that polarized emissivity may peak on either side of the galaxy mid-plane, but that the near-side component will dominate the detected polarized intensity at GHz frequencies because of depolarization in the turbulent mid-plane, which is an intervenor to the far-side emission. The Faraday depth distribution will reflect all of the relevant propagation effects that the emission has experienced. For the near-side component this will reflect the extended near-side halo of the target galaxy, while for the far-side component, the additional dispersion in the mid-plane region will also contribute.
We extend the usual planar ASS and BSS field topology with the addition of an out-of-plane component taken from a linear combination of dipole and quadrupole topologies. The basic equations describing dipole and quadrupole fields and magnetic flux functions can be found in Long et al. (2007). For the simple case under consideration, there is cylindrical symmetry about the galaxy rotation axis, z. In terms of the angle from the rotation axis, , and the distance from the origin, , the two perpendicular components of the poloidal magnetic field with a dipole moment, D, and quadrupole moment, Q, (each with a non-trivial sign) are given by,
| (12) | |||||
| (13) |
The corresponding magnetic flux function, , is given by,
| (14) |
The surfaces defined by represents example surfaces on which the magnetic field lines reside. The field components out of- and within the plane are given by,
| (15) | |||||
| (16) |
which yield the total field strength and local orientation angle from,
| (17) | |||||
| (18) |
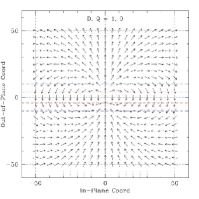
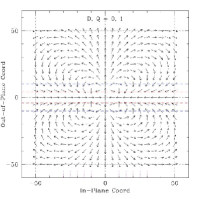
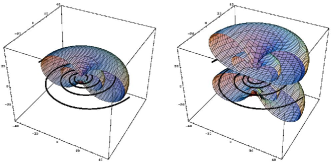
The poloidal field topologies are shown in a plane that includes the rotation axis in Fig. 7 for pure dipole, quadrupole, and a mixed dipole plus quadrupole configuration. The units of the two axes in the plot are arbitrary, since the topologies are self-similar. A three dimensional depiction of the pure dipole and quadrupole field topologies is given in Fig. 8, where several surfaces of constant magnetic flux are shown for each case.
, ,
,
Combining the planar (Eq. 4) and out-of-plane (Eq. 18) geometries permits the three right-handed cartesian components of the modified ASS magnetic field in the frame of the galaxy to be written as,
| (19) | |||||
| (20) | |||||
| (21) |
When viewed at an inclination, , this yields the observer’s frame components,
| (22) | |||||
| (23) | |||||
| (24) |
where the are the major axis, minor axis, and line of sight, respectively. If the spiral is a trailing one (as demonstrated in every kinematically studied galaxy with a well-defined nearside) then the positive axis so defined corresponds to the receding major axis. The projected parallel and perpendicular components of the magnetic field and the orientation angle of are given by,
| (25) | |||||
| (26) | |||||
| (27) |
We recall that the Faraday depth caused by a magneto-ionic medium is proportional to , the polarized intensity is proportional to , and the intrinsic polarization angle (giving the E-field orientation) is .
In the corresponding case of a modified BSS magnetic field, we have
| (28) | |||||
| (29) | |||||
| (30) |
When viewed at an inclination, , this yields the observer’s frame components,
| (31) | |||||
| (32) | |||||
| (33) |
and the corresponding , , and as above.
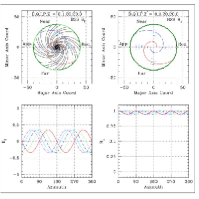
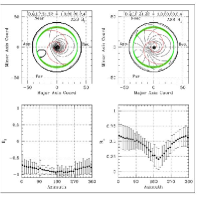
With these definitions in place, it is possible to explore the parameter space of modified ASS and BSS field topologies and produce both images and azimuthal traces of the expected distributions of and . We use these measures as proxies of the Faraday depth and polarized intensity, respectively. In the absence of a model for the spatial distributions of cosmic-ray and thermal electrons, we do not attempt to reproduce the observables directly, but merely the systematic modulations of and with azmiuth.
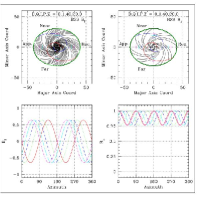
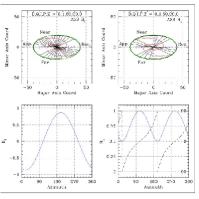
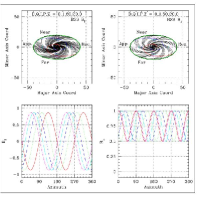
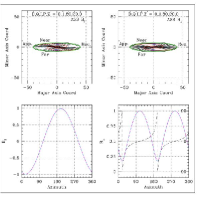
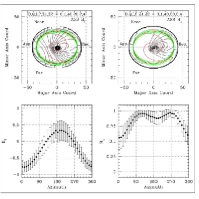
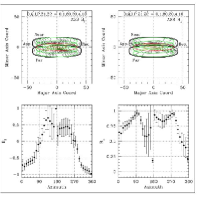
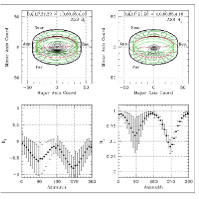
We present images and traces of the ASS and BSS predictions in Figs. 9–12. Each group of panels in the figure represents a contour plot of and (at top) and a series of traces of and at fixed radii (below). The relative weights of a dipole (D) and quadrupole (Q) field (each including a nontrivial sign), galaxy inclination, , spiral pitch angle, (positive for counter-clockwise and negative for clockwise), and distance(s), Z or (Z1 and Z2), from the mid-plane (positive toward the observer and negative away) are indicated at the top of the contour plots, together with an ASS or BSS designation. Two representative spirals are drawn for reference, both directed inwardly for the ASS plots and one inward and the other outward for the BSS plots. The inclination is defined such that for kinematically trailing spirals, the receding and approaching ends of the major axis are as indicated. The “near” and “far” designations in the plots also aid in demonstrating the spatial orientation of the disk unambiguously. An ellipse that is offset from the disk by the distance Z is drawn to demonstrate its location relative to the mid-plane. The radii at which the azimuth plots were made are marked by the same linetype on the contour plots. The azimuth angle increases counter-clockwise from the receding major axis.
We also plot the projected angle of , , within the same panel that presents the trace of using the right-hand scale. The traces are only plotted for the ASS cases, since the BSS cases vary so dramatically with radius.
For simplicity, we begin with a fixed spiral pitch angle, , since this corresponds well with the average measured value for our sample galaxies (cf. Kennicutt 1981), which vary from about 15–25∘, and we begin by considering counter-clockwise (CCW) spirals. Other values will also be considered below. First we consider the predictions for the simple planar ASS and BSS spirals in Fig 9. A radial spiral scaling constant, , and a galaxy disk radius, , are assumed for illustration. These choices have no effect on the results.
4.1 Planar models
Planar, axisymmetric field topologies yield projected field components (as shown in the left-hand groups of Fig. 9) that are independent of radius and have very simple symmetries, having positive and negative excursions that are fully symmetric about zero. The single positive peak occurs at offset from the approaching major axis, the negative peak being opposite to this (as also demonstrated by Krause 1990). The component has a complimentary behavior with two equal minima slightly offset from both major axes, and two equal maxima slightly offset from both minor axes. As the inclination increases from face-on toward edge-on, the amplitude of the and modulation increases, although there is no change in the azimuthal location of either the maxima or minima. The projected orientation of the plane-of-sky field, , has the expected linear variation with azimuth for a nearly face-on geometry, which becomes increasingly non-linear as the inclination increases.
Changing the sense of the field to be outwardly directed, rather than inwardly directed, changes only the sign of , and leaves unchanged. This is true for all of the field geometries we consider.
The basic BSS projected field patterns and their variation with galaxy inclination are illustrated in the right-hand groups of Fig. 9. Because of the modulation of field sense with azimuth along the family of spirals, there is a strong radial dependence of the projected field components and their variation with azimuth. has positive and negative excursions that are still fully symmetric about zero, but it exhibits two equal maxima and two equal minima (rather than only one for ASS), which are located at different azimuth depending on the radius. displays four equal maxima at the azimuthal angles where has its zero crossings, and four equal minima in-between (at the locations of maximum and minimum ). As with the basic ASS fields, a higher inclination yields an increased fractional modulation of and , while not affecting the location of those excursions. The strong radial dependence of these azimuthal patterns implies that if there were significant averaging of radii (by even as little as 20% in for a pitch angle of ) then most of the predicted modulation would disappear. This is particularly true of , for which the predicted modulation is both intrinsically smaller and twice as rapid as that of . The strong radial dependance of BSS models severely limits their predictive power for the general patterns of azimuthal modulation that are observed in galaxies and so will not be considered further.
The azimuthal modulation of and in the planar ASS and BSS spiral topologies is apparently inadequate for describing the general patterns noted above in Sect. 3. Neither of these topologies predict a clear distinction between the receding and approaching kinematic major axis in terms of either the intrinsic brightness of polarized intensity or the Faraday depth that it may encounter.

,
,
,
,
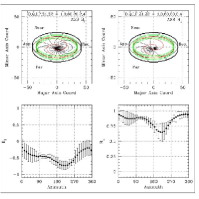
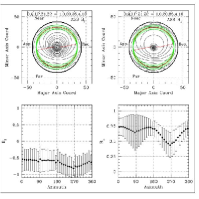
4.2 Thick disk models
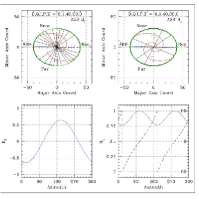
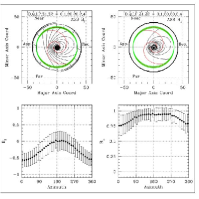
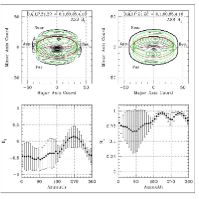
In Figs. 10 – 12, we explore the extension of the basic ASS topology with either a dipole (D = 1, left-hand groups) or quadrupole (Q = 1, right-hand groups) modification to the out-of-plane field, as given by Eq. 21. In keeping with the discussion of Sect. 3, we calculate a projected distribution that is populated within a specified range of mid-plane heights extending from Z1 to Z2 on the near-side of the galaxy and from Z2 to Z1 on the far-side. For lines-of-sight that intersect the mid-plane disk within the nominal galaxy radius, only the near-side region (Z 0) contributes to the integral, to approximate the effect of mid-plane depolarization. For other lines-of-sight, out to 1.2 times the nominal galaxy radius, both the nearside and farside zones are integrated. The integral is determined by first evaluating and at a sequence of finely-sampled line-of-sight depths and then forming the average. The two lower panels of each group were modified to allow more direct comparison with the data of Fig. 1 by plotting the mean modeled quantity within azimuthal wedges rather than the azimuthal traces at discrete radii. The error bars represent the RMS variation within each wedge, which are principally caused by a dependence on radius.
We first consider the dipole and quadrupole models that are integrated over mid-plane heights of (about 10% of the disk radius) in Fig. 10. Although the azimuthal trace of projected field modulation with azimuth show some variation in amplitude with radius (as indicated by the error bars), there are well-defined maxima and minima. The local modification to the planar spiral field is illustrated in Fig. 7 by the vector orientations along the horizontal line drawn at Z = 4. The addition of a poloidal field component has introduced several notable differences from the planar case. Although exhibits maxima and minima at the same azimuth as previously (near the major axes), it no longer has excursions that are symmetric about , being offset to negative values of (for an inwardly-directed spiral field) and showing complementary modulation in the dipole and quadrupole cases. The character of is more substantially modified by the addition of a poloidal field. We first consider the quadrupole case (Q = 1) shown in the right-hand groups of Fig. 10.
At low inclinations, a single minimum in occurs near the receding major axis at and a broad single peak centered near the approaching major axis. As the inclination increases, the single global minimum in remains close to the receding major axis, while the single broad maximum divides into two maxima that separate and shift toward the two ends of the minor axis. This is exactly the trend shown by the data in Fig. 1. The other noteworthy attribute of these distributions is that the largest excursion in is found on the receding major axis at all inclinations, representing the greatest Faraday depth at this azimuth for coextensive emitting and dispersive media. For low inclinations, there is a broad minimum in at the approaching major axis, which becomes a secondary peak at this location (of opposite sign) as the inclination increases. This roughly agrees with the patterns seen for the majority of lower inclination galaxies in Fig. 1, these models still being more symmetric than the data, which exhibit a much clearer nearside/farside asymmetry.
For the dipole case (D = 1), shown in the left-hand groups of Fig. 10, the receding and approaching major axes are reversed, since the poloidal field component of the dipole at positive mid-plane offsets is directed outward and not inward (as shown in Fig. 7). For this case, it is the approaching major axis that is predicted to have a global minimum in , and hence also the minimum intrinsic polarized intensity. In a similar way, it is the approaching major axis for which the greatest value of , hence the largest associated Faraday depth is found. The degree of modulation with azimuth is rather modest for the dipole case integrated over these heights.
From this comparison, it is clear that a large-scale quadrupole ASS field topology provides an excellent model for explaining the modulation of polarized intensity with azimuth, while the dipole clearly does not. The modulation of Faraday depth with azimuth is also explained qualitatively for the low inclination systems, but is not reproduced in detail. The crucial attributes of the quadrupole model in matching the observed azimuthal modulation pattern, , are the magnitude and particularly the sign of of the angle as given by Eq. 18. For typical values of the spiral pitch angle, , the projected field component, of Eq. 24 has minima and maxima near and . The “hour-glass” shape of the quadrupole field yields a positive sign of for small positive values of , i.e. toward the observer, and this is what yields a minimum of near for the nearside emission. The “donut” shape of the dipole field, on the other hand, yields a negative sign of for small positive values of , resulting in a maximum of near .
,
,
,
,
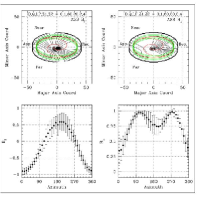
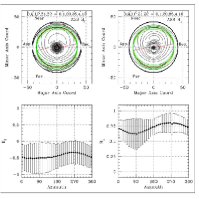
4.3 Halo models
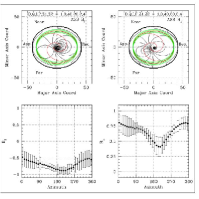
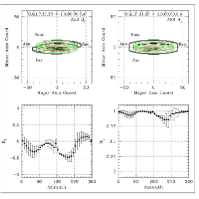
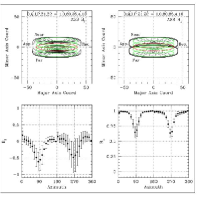
We now consider dipole and quadrupole models that extend to more substantial mid-plane heights in an attempt to reproduce the azimuthal modulations of Faraday depth seen in the data. In Fig. 11, we illustrate the result of integrating the same models just considered over mid-plane heights of (or about 30% of the disk radius). By considering first the quadrupole models in the right-hand panels, we see substantial similarity between these models and those originating closer to the mid-plane (Fig. 10). The modulation pattern in has a slightly smaller amplitude. The modulation pattern of the halo , while similar to its thick disk counterpart, has a clear asymmetry in the approaching major axis minimum about an azimuth of 180∘, which is reminiscent of what is seen in the data of Fig. 1. The pattern shown is for a positive pitch angle of 20∘ (CCW spiral), while for a negative pitch angle (CW spiral) it is mirrored about an azimuth of 180∘. We recall that changing the sign of the spiral field from inward directed (as shown) to outward directed changes only the sign of . Qualitative agreement of the halo predictions for the quadrupole with the basic patterns is reasonable for many of the low inclination galaxies of our sample. The dipole halo models (shown in the left-hand panels) with their maximal excursion near an azimuth of 180∘ reproduces the observations less successfully.
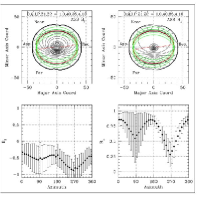
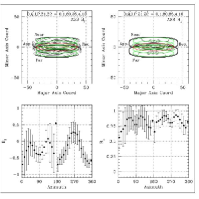
Although the models considered to this point can reproduce the general pattern of modulation at all galaxy inclinations and the modulations for many low inclination targets, they have not provided any agreement with the distinctive doubly peaked pattern of around the minor axes seen in our four highest inclination galaxies. We now consider an additional variant of our halo models in an attempt to reproduce those patterns. In Fig. 12 we consider dipole and quadrupole models for an extremely large pitch angle of 85∘, to illustrate the impact of a planar field component that is essentially radial. The distinctive doubly-peaked pattern of at large inclinations can be reasonably reproduced in this case, but only for the dipole topology.
,
,
,
,
,
,
,
,
5 Discussion
Our analysis of the projected three-dimensional magnetic field topologies presented in Sect. 4 and their predicted observable consequences for the azimuthal modulation, and , has provided a plausible explanation of the very general observed trends noted in Sect. 3. A self-consistent scenario has emerged that accounts for the polarized intensity and its Faraday dispersion observed at GHz frequencies from galaxy disks. The detected polarized intensity is dominated by a zone of emissivity above the mid-plane on the side of the galaxy facing the observer (at a height of perhaps 5 – 10 % of the disk radius). This thick disk emission arises in a region that is dominated by an axisymmetric spiral with an out-of-disk quadrupole topology, which is responsible for a distinctive modulation of and its variation with galaxy inclination. This emission is affected by only a modest amount of Faraday dispersion, of a few tens of rad m-2, within the nearside halo of the galaxy in its subsequent propagation. For the majority of low to modest inclination galaxies (), the dispersive foreground topology is consistent with an extension of the thick disk ASS quadrupole out to larger heights above the mid-plane (of perhaps 30% of the disk radius).
The most highly inclined galaxies of our sample require an alternative halo field topology, in the form of a radially-dominated dipole, which yields a distinctive doubly-peaked modulation of . It seems significant that in many or possibly all of the highly inclined galaxies of our sample there is evidence of a significant circum-nuclear outflow component to the polarized emission, in addition to that of the disk. This circum-nuclear component would quite naturally be expected to be associated with a dipole, rather than a quadrupole field, in view of the likely dominance of the over the dynamo mechanism at small galactic radii (e.g. Elstner et al. 1992). This circum-nuclear dipole field would also be less likely to have any association with the spiral pitch angle of the disk given its origin. Because of the shallower roll-off with radius of a dipole compared to the quadrupole field (see Eq. 13), a dipole component may come to dominate the halo field of the associated galaxy when both are present. Sokoloff & Shukurov (1990) also argued that a dynamo operating in the halo would directly produce a dipole field. Non-stationary global halo models (e.g. Brandenburg et al. 1992) may also provide a natural explanation of the dipole signature on the largest scales.
In addition to the bright polarized emission originating in the nearside, the corresponding rear-facing region of polarized emissivity of the thick disk can also be detected in relatively face-on galaxies if sufficient sensitivity is available. This emission is substantially weaker, by a factor of 4 – 5, and consistent with depolarization caused by fluctuations in the magneto-ionic medium of the mid-plane on scales smaller than a pc. This fainter polarized component is affected by much greater Faraday dispersion, corresponding to both plus and minus 150 – 200 rad m-2 in its propagation through the dense mid-plane plasma, as well as the near-side halo. These two maxima (one positive and one negative) in Faraday depth are aligned approximately with the major axes of each galaxy, and have approximately symmetric excursions about the Galactic foreground value. This pattern is consistent with the expectation for a simple planar ASS field in the galaxy disk.
Future observations of nearby galaxy disks at frequencies below 200 MHz, such as with the upcoming LOFAR facility, will likely detect net polarized emission from even larger heights above the galaxy mid-plane and exclusively from regions unobstructed by the mid-plane in projection. A good indication for the predicted observables is given in Fig. 11 in which we present model integrations of the upper halo (out to 30% of the disk radius).
Acknowledgements.
The Westerbork Synthesis Radio Telescope is operated by ASTRON (The Netherlands Institute for Radio Astronomy) with support from the Netherlands Foundation for Scientific Research (NWO).References
- Beck (2007) Beck, R. 2007, A&A, 470, 539
- Berkhuijsen et al. (1997) Berkhuijsen, E. M., Horellou, C., Krause, M., et al. 1997, A&A, 318, 700
- Brandenburg et al. (1992) Brandenburg, A., Donner, K. J., Moss, D., et al. 1992, A&A, 259, 453
- Braun et al. (2007) Braun, R., Oosterloo, T. A., Morganti, R., Klein, U., & Beck, R. 2007, A&A, 461, 455
- Brentjens & de Bruyn (2005) Brentjens, M. A. & de Bruyn, A. G. 2005, A&A, 441, 1217
- Elstner et al. (1992) Elstner, D., Meinel, R., & Beck, R. 1992, A&AS, 94, 587
- Gaensler et al. (2005) Gaensler, B. M., Haverkorn, M., Staveley-Smith, L., et al. 2005, Science, 307, 1610
- Greenawalt et al. (1998) Greenawalt, B., Walterbos, R. A. M., Thilker, D., & Hoopes, C. G. 1998, ApJ, 506, 135
- Heald et al. (2009) Heald, G., Braun, R., & Edmonds, R. 2009, A&A, 503, 409
- Heesen et al. (2009) Heesen, V., Krause, M., Beck, R., & Dettmar, R. 2009, A&A, 506, 1123
- Horellou et al. (1992) Horellou, C., Beck, R., Berkhuijsen, E. M., Krause, M., & Klein, U. 1992, A&A, 265, 417
- Johnston-Hollitt et al. (2004) Johnston-Hollitt, M., Hollitt, C. P., & Ekers, R. D. 2004, in The Magnetized Interstellar Medium, ed. B. Uyaniker, W. Reich, & R. Wielebinski, 13–18
- Kennicutt (1981) Kennicutt, Jr., R. C. 1981, AJ, 86, 1847
- Krause (1990) Krause, M. 1990, in IAU Symposium, Vol. 140, Galactic and Intergalactic Magnetic Fields, ed. R. Beck, R. Wielebinski, & P. P. Kronberg, 187–196
- Long et al. (2007) Long, M., Romanova, M. M., & Lovelace, R. V. E. 2007, MNRAS, 374, 436
- Sokoloff & Shukurov (1990) Sokoloff, D. & Shukurov, A. 1990, Nature, 347, 51
- Stil et al. (2009) Stil, J. M., Krause, M., Beck, R., & Taylor, A. R. 2009, ApJ, 693, 1392
- Sun et al. (2008) Sun, X. H., Reich, W., Waelkens, A., & Enßlin, T. A. 2008, A&A, 477, 573
- Widrow (2002) Widrow, L. M. 2002, Reviews of Modern Physics, 74, 775