The effects of charge transfer inefficiency (CTI) on galaxy shape measurements
Abstract
We examine the effects of charge transfer inefficiency (CTI) during CCD readout on the demanding galaxy shape measurements required by studies of weak gravitational lensing. We simulate a CCD readout with CTI such as that caused by charged particle radiation damage in space-based detectors. We verify our simulations on real data from fully-depleted p-channel CCDs that have been deliberately irradiated in a laboratory. We show that only charge traps with time constants of the same order as the time between row transfers during readout affect galaxy shape measurements. We simulate deep astronomical images and the process of CCD readout, characterizing the effects of CTI on various galaxy populations. Our code and methods are general and can be applied to any CCDs, once the density and characteristic release times of their charge trap species are known. We baseline our study around p-channel CCDs that have been shown to have charge transfer efficiency up to an order of magnitude better than several models of n-channel CCDs designed for space applications. We predict that for galaxies furthest from the readout registers, bias in the measurement of galaxy shapes, , will increase at a rate of at L2 for accumulated radiation exposure averaged over the solar cycle. If uncorrected, this will consume the entire shape measurement error budget of a dark energy mission surveying the entire extragalactic sky within about 4 years of accumulated radiation damage. However, software mitigation techniques demonstrated elsewhere can reduce this by a factor of , bringing the effect well below mission requirements. This conclusion is valid only for the p-channel CCDs we have modeled; CCDs with higher CTI will fare worse and may not meet the requirements of future dark energy missions. We also discuss additional ways in which hardware could be designed to further minimize the impact of CTI.
Subject headings:
cosmology: observations – gravitational lensing – large-scale structure of Universe1. Introduction
The past decade has seen enormous changes in the field of cosmology. A concordance cosmology in which the expansion of the universe is accelerating has been accepted (Spergel et al. 2007). This accelerated expansion was first demonstrated by observations of SN Ia (Riess et al. 1998; Perlmutter et al. 1998) and has been confirmed with other probes in recent years. This startling aspect of our Universe has prompted a wide variety of possible explanations (see, e.g., Caldwell 2004) and considerable effort has gone into developing concepts for dedicated space missions to probe the mysterious dark energy thought to be causing this accelerated expansion. These missions, which include the NASA/DOE Joint Dark Energy Mission888See http://jdem.gsfc.nasa.gov and ESA’s Euclid mission999See http://sci.esa.int/euclid, plan to use a variety of probes in order to constrain the properties of dark energy. It has become widely accepted that weak gravitational lensing, the small distortion of the observed shapes of background galaxies by foreground dark matter, is one of the most powerful probes of dark energy, provided that systematic effects can be controlled (Albrecht et al. 2006). Space missions are attractive in large part due the greater ability to control many systematic effects (Rhodes et al. 2004a).
The field of weak lensing by large-scale structure, or cosmic shear, developed in parallel to the study of dark energy as the dominant component of the Universe. From the first detections of cosmic shear a decade ago (Wittman et al. 2000; Bacon, Refregier & Ellis, 2000; Kaiser, Wilson, & Luppino, 2000; Van Waerbeke et al. 2000), surveys have grown in size and thus information content (see Hoekstra & Jain 2008 for a recent review). The culmination of this effort will be in the execution of the above-mentioned dedicated dark energy missions, which plan to survey up to 20000 square degrees, the entire extragalactic sky. It has become clear that control of systematic effects, both observational and astrophysical, is of paramount importance in making use of weak lensing as a probe of dark energy. The subtle shape changes induced by weak lensing require exquisite control of observational systematic effects, especially knowledge of the telescope’s point spread function (PSF). From the ground, thermal and gravity load-induced fluctuations in the telescope can change the PSF, and the atmospheric seeing both broadens the PSF and makes the PSF unstable on the timescale of astronomical exposures. These effects can be largely or completely mitigated by making observations in a thermally stable environment above the atmosphere.
The control of systematics is a large factor in the drive towards a dedicated space mission. However, the harsh radiation environment of space has the potential to introduce an observational systematic effect due to charge traps created in CCD detectors by impacts from charged particles. These defects trap charge (either electrons in so-called n-channel CCDs or holes in p-channel CCDs) as charge is clocked across pixels toward the readout registers. When the charge is subsequently released from the trap, it shows up in a neighboring pixel, thus creating a trail along the readout direction. These trails obviously change the observed shapes of the galaxies in the images. These shape changes are coherent across the image, thus mimicking a weak lensing signal caused by dark matter. The degradation of charge transfer efficiency (CTE, this quantity is one minus the CTI, or charge transfer inefficiency) due to these radiation-damage induced traps has been observed in all Hubble Space Telescope (HST) imaging cameras: the Wide Field Planetary Camera 2 (WFPC2; Dolphin 2009), the Space Telescope Imaging Spectrograph (STIS; Goudfrooij et al. 2006), and the Advanced Camera For Surveys (ACS; Sirianni et al. 2005) and has hampered the sensitive shape measurements needed for weak lensing with those cameras (Rhodes et al. 2004b; Schrabback et al. 2007; Rhodes et al. 2007). CTE degradation is a particularly difficult effect to correct for because its non-linear nature means that high signal-to-noise (S/N) stars which are typically used in weak lensing for PSF modeling will be affected less than the low S/N galaxies whose shapes are being measured. Thus, typical PSF deconvolution techniques are complicated by the effects of CTI. Thus, it is clear that future space weak lensing missions will need to minimize CTI due to radiation damage and have CCDs that are sufficiently well understood to allow for mitigation of the CTE degradation that does occur.
In this paper we carry out a quantitative analysis of the effects of CTI in CCDs on the analysis of galaxy shapes for weak lensing, and explore techniques to mitigate the shape distortions due to trailing charge. We have developed a detailed model for the effect of charge traps based on data from irradiated CCDs, and applied it to simulated galaxies. We quantify the effects on measured galaxy shapes in simulated data as a function of galaxy size, CTI, and S/N. We base our analysis on data from p-channel CCDs fabricated at Lawrence Berkeley National Laboratory (LBNL) and irradiated with protons at the LBNL 88” cyclotron (Dawson et al 2008; hereafter D08). However, our methods are general and can be applied to any CCDs if the density and time constants of the charge traps are known.
This paper is organized as follows. §2 gives a brief overview of how charge is transferred between pixels during CCD readout and how different types of CCDs have performed after radiation damage. §3 describes the code we have developed to mimic the effects of CTI on CCD readout. In §4 we validate that code by showing that it can reproduce the effects of CTE degradation as measured on real, irradiated LBNL CCDs. We apply our code to simulated astronomical images and detail the effects of CTI on the shapes of galaxies in §5. We examine how this will effect the future space missions and give recommendations for mitigating the effects in §6. Finally, we offer concluding remarks in §7.
2. Background
2.1. CCD readout and charge transfer
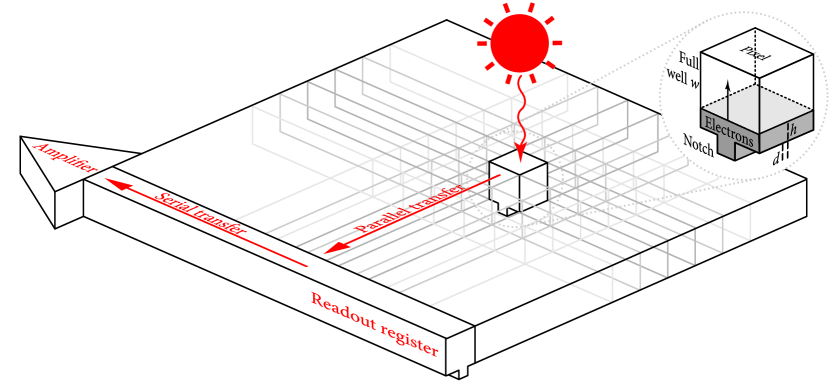
During exposure, a photon incident on a CCD generates an electron-hole pair. In n-channel CCDs, the electrons drift into the potential well of the nearest pixel, which is created by an electrostatic potential gradient within the substrate. In p-channel CCDs, holes are collected instead, but we shall not distinguish between the two mechanisms hereafter. Charge (electrons or holes) accumulates in a well-defined volume, outside which the density falls rapidly to zero (Hardy, Murowinski & Deen 1998, Seabroke et al. 2008). We are most concerned with the cross-sectional area of this cloud, which expands as a monotonic function of the amount of charge . As illustrated in Figure 1, we parameterize this as an effective height within the pixel; the variable need not really be the height, but that is a useful one-dimensional function for the purposes of explanation.
Some CCDs contain a supplementary buried channel or “notch” constructed at the bottom of the potential well. This is a small region of slightly lower potential and, like the channel in an artificial river bed designed to improve the flow of a small amount of water, it will concentrate the first few electrons (or holes). The notch reduces the number of traps the charge packet is exposed to, by confining the charge to a smaller region. We model the notch by setting the height to zero below some notch depth , and
| (1) |
above the notch, where is the full well depth (the total amount of charge that will fit in a pixel before it overflows) and , which depends on the construction of the potential but which is typically (see for instance, Chiaberge et al. 2009 and Mutchler & Sirianni, 2005). Setting to zero below the notch is an approximation because it is possible that there are some traps in the notch. At any rate, the CCDs we model in this paper have no notch in the imaging region and thus this approximation does not affect the results presented here.
At the end of the exposure, the charge must be moved to the amplifier electronics at the edge of the CCD to be read out and digitized. Each row of charge is first shuffled one pixel in the parallel direction, towards the serial readout register. This is typically accomplished using a 3-phase clock, as is the case for the CCDs described here (Janesick 2001), but can be approximated as a single operation (for a discussion of the consequences of this approximation, see Massey et al. 2009). Charge from the bottom-most row is transferred into the serial readout register and then shuffled using the same technique but in a perpendicular direction. The charge from each pixel is shifted onto a capacitor connected to an amplifier and then ‘counted’ by being sensed as a voltage and digitized. Read noise is the shot noise on this voltage and can be reduced by lengthening the sampling time, and thus slowing the readout rate. This process is then repeated once for each additional row of pixels: shuffling one row in the parallel direction and then through the serial readout register.
As the charge is transferred from pixel to pixel, charge traps due to defects or impurities in the Si lattice temporarily capture passing charge, and release it after some delay. The typical capture time is effectively instantaneous (and if it is not, the lower capture rate can be equivalently modeled as a lower density of charge traps). The probability of release is governed by an exponential decay, with a characteristic time constant that depends upon the properties of the lattice and impurities, as well as the operating temperature of the detector (Shockley & Read 1952, Hall 1952). Several different species of charge traps may be present in any given device, with different characteristic release times , and densities . If the captured charge is released after its charge cloud has been shuffled along, the released charge appears as a faint trail behind the main charge packet.
Trapping and trailing can occur in both the parallel and serial directions. Each column of pixels is independent and has a unique set of charge traps, while all of the rows share the same traps along the serial register. Note that even though the pixels and transfer mechanisms are physically similar in the two directions, the time per pixel transfer is typically shorter in the serial direction (D08). We demonstrate in §4 that only charge traps with release times roughly similar to the clocking (time between transfers) affect galaxy shapes. Thus, separate species of charge traps can be important for parallel and serial transfers.
2.2. CTE Effects in Irradiated CCDs
Thick, fully depleted p-channel CCDs have several advantages over conventional thin, n-channel CCDs, including enhanced quantum efficiency at near-infrared wavelengths, reduced fringing at near-infrared wavelengths, and significantly less degradation of CTE with a given accumulated radiation exposure. This last effect is particulary important for the measurement of subtle weak lensing-induced galaxy shape distortions. It arises due to the fact that the divacancy traps that are primarily responsible for CTI in p-channel devices are more difficult to form than the phosphorous vacancy traps that occur due to radiation damage in n-channel CCDs (Bebek et al. 2002; Janesick & Elliott 1992; D08; Spratt et al. 2005). We focus our analysis on p-channel CCDs precisely because it is more difficult to form traps in these types of CCDs than in existing n-channel CCDs.
Marshall et al. (2004) compared the CTE responses of irradiated p-channel LBNL CCDs with n-channel CCDs. These n-channel devices are designed for space applications and are the ones used for the recently installed Wide Field Camera 3 on the HST. They found that a notch implant in the channels improved the CTE performance by a factor of 2 for both p-channel and n-channel devices. More importantly, they found that the CTE performance of p-channel devices is about an order of magnitude better than that of n-channel devices after irradiation. A re-analysis of the Marshall et al. data (Lumb 2009) indicates that the p-channel devices may only have about a factor of 3-8 better CTE (depending on the signal level, with the p-channel advantage being greater at low signal levels such as those expected in the images of faint galaxies). Likewise, a comparison by Gow et al.(2009) found a factor of 7 improvement in tolerance for parallel CTI (and 15 for serial CTI) in otherwise similar p and n-channel devices. Thus, thick, fully depleted p-channel CCDs are particularly attractive for a weak lensing space mission and we use them as the baseline for this study. We do, however, note that p-channel devices do not have the rich heritage that n-channel devices do, particularly in space applications.
LBNL has developed radiation-hardened CCDs with the specific application of dark energy missions in mind (Holland et al. 2006). These CCDS are composed of m pixels with 4 readout registers and were baselined for the SuperNova Acceleration Probe (SNAP), a JDEM concept (Bebek 2007). The SNAP mission, like other candidate dark energy missions, would be at the L2 Earth-Sun Lagrange point, and we use the radiation flux there as the baseline for the flux experienced by a dark energy mission. A dark energy observatory will experience significant radiation exposure at L2, primarily from solar protons. Exposure to energetic protons leads to degraded CCD performance due to bulk damage from non-ionizing energy loss (NIEL) and charging of oxide layers from ionizing radiation. Bulk damage in the Si lattice is the dominant effect that manifests itself through increased CTI, increased dark current, and isolated hot pixels. Of these effects, an increase in CTI is the most likely to introduce systematic errors to a weak lensing survey.
3. Software Algorithm to Mimic CTI
Our model for CTI is that inefficient charge transfers are caused by discrete charge traps embedded in pixels. These charge traps can capture and release single electrons (or holes). Each pixel of the detector contains a number of charge traps, that have a mean density . Each trap is characterized by , its vertical location in the pixel and , its characteristic release time constant. Different species of charge traps have different decay time constants and thus different values of (and ). Whenever a trap in a pixel containing electrons (or holes) is within the electron cloud, i.e. , we assume that it immediately absorbs one electron from the free charge. When a full charge trap is above the free charge height (that is, not within the electron cloud), it is given an opportunity to decay.
We have developed a code that mimics the readout of a CCD with imperfect CTI. For each column of pixels, we use the following procedure to “read out” the image and determine the observed charge in each pixel. This procedure is also illustrated graphically in Figure 2.
-
1.
Populate each pixel with free charge, as accumulated during an exposure, and calculate .
-
2.
Define the locations of charge traps throughout the pixel array. This is done for multiple species of charge traps, each with a different and .
-
3.
For charge traps with fill the trap with one electron, and subtract one electron from the free charge in its pixel.
-
4.
Read out the charge in pixel row .
-
5.
For to set the free charge in pixel to the free charge in pixel .
-
6.
For full traps with , calculate the probability that the trap will decay (that is, release the charge), based on an exponential decay with time constant . Generate a random number in the range [0,1] and, if the probability is less than the random number chosen, empty the trap and increase the free charge by 1 electron.
-
7.
Repeat the previous four steps to calculate the measured charge in pixel rows , , …. Note that is decreased by one for each iteration.
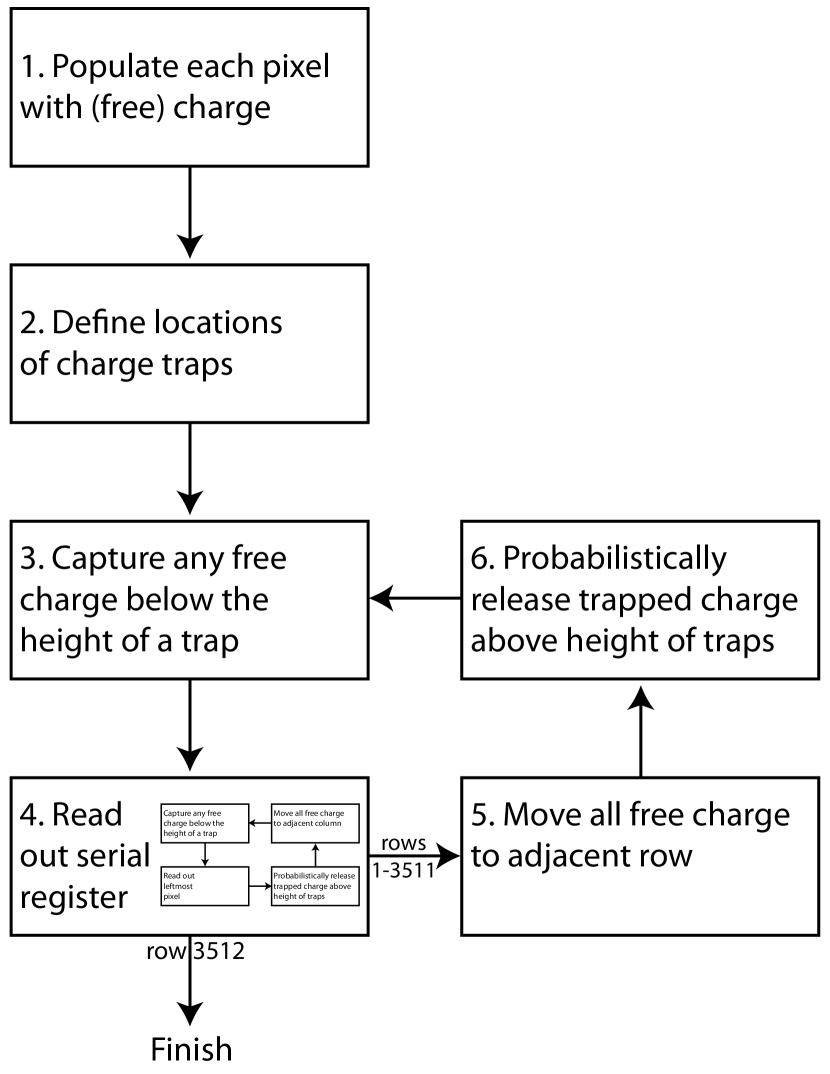
The image is then rotated by ninety degrees and exactly the same process is repeated to simulate serial transfers. The total number of operations to read out one row or column of pixels is . Thus, reading out out an entire array scales as and is computationally intensive. During a readout, a charge can be trapped multiple times in different pixels.
This process inevitably adds noise to an image because we do not know the true locations of individual traps within the detector101010This knowledge may be possible in future analyses using “pocket pumping”, as described in §6., but simply model the traps as a uniform density. We therefore ought to perform many iterations and average the results. As a more computationally efficient solution to this problem, we instead introduce “fractional traps”. That is, we place the same number of traps in each pixel and let each trap capture a “fractional electron” (with the fraction being , the trap density per pixel, which can be less than ). We further divide the fractional trap in each pixel into fractional traps, each located at a vertical position in multiples of . These traps release charge exactly as described above. We have found that setting allows us to reproduce the averaged results of many iterations with full traps placed randomly within the pixels (mimicking a real, physical CCD). However, the fractional trap method saves considerable computational overhead when simulating the effects of CTI on many thousands of images as described in §5. Our code allows each trap to have a different . However, as discussed below, we find that in each charge transfer direction, a small number of values (trap species) describe the behavior of physical detectors.
4. Validation of the Charge Transfer Code
The charge transfer code has been tested and validated by creating simulated images designed to mimic the irradiated data used in D08. Using the same software as D08, we show that the code is able to reproduce the observed radiation damage effects as measured in the D08 data.
4.1. Irradiation in the Lab to simulate Space Radiation
The damaging particle radiation flux incident on a spacecraft depends on exactly when the mission occurs within the year solar cycle (Barth et al. 2000). There is an order of magnitude difference in the flux of solar protons during the heaviest and lightest parts of the solar cycle (see, e.g. Figure 1 of Barth et al. 2000). In D08, the solar proton flux was modeled using the European Space Agency’s Space Environment Information System (SPENVIS)111111See http://www.spenvis.oma.be. In SPENVIS, a simplified solar cycle consisting of 7 years near the maximum flux level and 4 years at zero flux is used. The total displacement damage (energy deposited in the silicon) is predicted from a uniform 4 steradian spatial distribution of solar protons with an energy distribution derived from the Xapsos et al. (1999) model for solar proton emission. SPENVIS employs a statistical model based on data from previous solar cycles to predict the dose at confidence level (CL); that is, the prediction will underestimate the dose only of the time. D08 used the SPENVIS model to calculate the 95% CL solar proton flux incident on the CCDs, after passing through the shielding provided by the SNAP spacecraft and telescope, yielding an integrated NIEL exposure of MeV/g (Si) for one year at solar maximum.
D08 then characterized the CTE performance of thick, fully depleted LBNL p-channel CCDs by irradiating several CCDs at the LBNL 88-Inch Cyclotron with and MeV protons. Although a variety of irradiation levels were used, we only consider the MeV data with an irradiation level of protons/cm2. The NIEL factor for MeV protons is per proton (Jun et al. 2003). Thus, the protons/cm2 flux of 12.5 MeV protons used to irradiate the CCDs corresponds to MeV/g (Si,) a total dose equivalent to ten solar cycles at 95% CL, using the SPENVIS approximation detailed here, or 110 years at L2.
Although this accumulated radiation exposure is significantly higher than any proposed dark energy mission would encounter, the exaggerated radiation exposure makes it easier to characterize the detailed effects of CTE degradation. Since the number of traps (and thus the degradation of CTE) is linear with radiation exposure and the NIEL dose, the D08 accumulated radiation exposure can be used to estimate CCD performance over the course of a dark energy mission lifetime.
4.2. Analysis of CTI Due to Radiation Damage
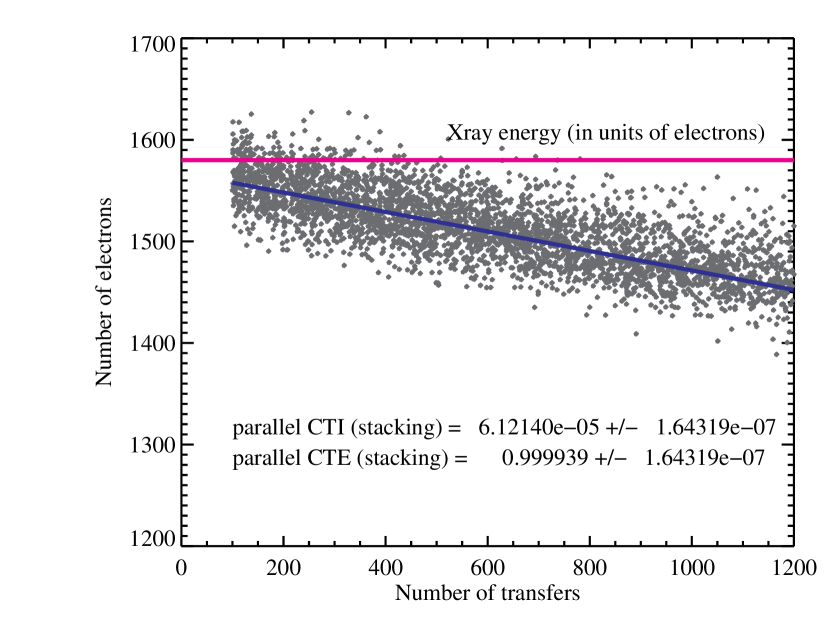
The CTE of irradiated CCDs was measured using a x-ray source that emits K-alpha photons with energies of 5.9KeV. At the operating temperature of 133K, a single K-alpha x-ray will generate 1580 electron/hole pairs, which, depending on the location of the x-ray relative to the pixel potential wells, may be localized in a single pixel or shared among two or more pixels.
In D08, CTE was characterized using single pixel events from the K-alpha peak, and the results showed that the irradiated LBNL CCDs are three times more affected by charge trailing in the parallel readout direction that in the serial readout direction. In this article, we disregard the serial CTE and only consider the trailing in the parallel direction since this will most affect galaxy shape measurements.
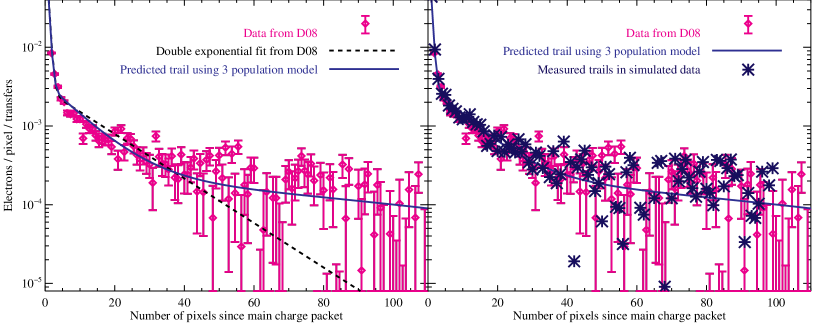
The effects of irradiation on CTE was studied in two ways in D08. In the first method, called the method, CTE is characterized by the average charge collected for single pixel x-ray events as a function of the number of pixel transfers. Those x-ray events that experience more transfers lose a larger amount of charge due to CTI, as shown in Figure 3. The serial and parallel CTE components are determined independently by fitting the fractional loss of each transfer to the data. The same single pixel x-ray events are used for a measurement of CTE using the method, in which the charge is counted in each trailing pixel as a fraction of the charge in the primary charge packet. The fractional trailing charge in each event is divided by the total number of transfers, and the results are averaged over all x-ray events. In other words, the averaged trails represent the fraction of charge left behind the primary charge packet for a single transfer. The effect of this trailing with a best fit to the data after irradiation and 1650 transfers is shown in Figure 4. The total fractional charge integrated over these trails represents the CTI. To summarize and compare the two methods, the stacking method offers a direct measurement of CTE, measuring charge that is successfully transferred relative to the expected x-ray charge deposition, while the trails method offers a direct measurement of CTI by measuring the trailing charge relative to the charge in the leading pixel. The total fractional charge integrated over these trails represents the CTI.
In practice, the analysis of the trails following x-ray events is limited by the ability to measure the faint trails after a large number of transfers in the presence of non-zero read noise. Because of the low S/N at large distances from the primary x-ray event, D08 fit only the first 45 pixels with a two term exponential. The charge in this two-term exponential represents approximately of the total charge lost due to CTE effects as identified in the stacking method. In a re-analysis of the D08 data, in which stacking plots were made with varying x-ray flux, we find strong evidence that the remaining charge must be attributed to one or more populations of traps with a much longer time constant. One such candidate is the C-O trap which has been independently identified in the LBNL CCDs in a previous analysis (Bebek et al. 2002) with a de-trapping time constant of many seconds compared to the typical time between pixel row transfers of 25 ms at the pixel/sec readout speed employed in D08.
We therefore choose to model the CTI using three distinct trap populations instead of the two used by D08. We assign the third trap a time constant corresponding to 200 pixels in our analysis. The results of our fit are shown in Fig. 4 and the best-fit parameters are found to be: , , , , , , where is in units of ‘pixels’. These best fit parameters are tabulated in Table 1. There are, on average, about traps per pixel when summed over the three species; a mission that was at L2 for only about 5 years would thus have only about one twentieth that number of traps. We created a set of simulated images with the same characteristics of the D08 images to test our models. Overall, the agreement is good, as shown in Figure 4.
| Trap Species | (traps per pixel) | (pixels) | (ms) | probable defect type |
|---|---|---|---|---|
| 1 | 0.35 | 10.0 | 250 | Carbon-interstial (Ci) |
| 2 | 0.49 | 0.486 | 12 | divacancy (VV) |
| 3 | 0.7 | 200.0 | 5000 | carbon-oxygen (CO) |
As we show in §5, charge traps with time constants that are long relative to the time between parallel transfers in readout have negligible effect on galaxy shapes (i.e. they do not leave trails). The trapped charge is, however, removed from the object, and will thus affect photometry. Because our primary motivation is to study the impact of charge trailing on galaxy shapes, we chose to mimic the measured trails in D08 instead of matching the CTE as measured by the stacking method. We note that the opposite approach would be appropriate if our aim was to measure changes in photometry instead of shapes.
5. Application of the CTE Code to Simulated Galaxy images
We create simulated galaxy images with de Vaucouleurs and exponential profiles and use the code described in §3 to introduce the effects of CTI on the galaxy images. We create galaxies as they would appear in the I-band of the proposed SNAP mission, which has a 2 meter mirror, ” pixels and 400 second exposures. The background level is chosen to be the average background for extragalactic observations taken from L2. The measured background is slightly lower than the input background because the CTI causes the flux to be dragged out into the overscan region of the CCD during readout. We create single galaxies in each image to avoid having the traps in a pixel be filled by charge from an object that has already passed through that pixel during readout. All objects are placed 1650 pixels from the readout register (close to the maximum of 1712 pixels from the readout register). This is done because objects farthest from the readout registers will encounter the most traps and suffer the worst CTI; we are trying to estimate the worst case scenario for galaxy shape measurement.
We assume that the trap densities increase linearly over time, as traps accumulate due to radiation damage, and that the time release constants do not change because they are properties of the detector material itself. The assumption of linearity in trap density is not entirely accurate because the proton flux is dominated by solar radiation, which varies over the solar cycle. A specific analysis of any future dark energy mission will need to take into account the portion of the solar cycle in which the mission occurs. We make a further simplification by assuming that at the start of a mission a CCD will have no charge traps, so only traps accumulated during the time spent at L2 affect readout. This is of course not true, because real CCDs always have some imperfections even immediately after their production. In the case of the LBNL CCDs we are simulating, however, this turns out to be a good approximation because the pre-irradiation CTE is so high and the number of traps so low (see Table IV of D08). However, our results represent a best-case scenario for the number of traps (and thus CTI) as a function of time; the real CTI will be slightly worse.
For each galaxy, we measure the shape both before and after the image is degraded with imperfect CTE. The shape is parameterized in the typical weak lensing fashion by a two component ellipticity , where corresponds to elongation along the axis (for positive ) or the axis (for negative ), and corresponds to elongation at degrees. Here, the shapes are described in terms of the second order moments of the pixel intensity such that where is the distance in pixels from the object centroid and is a Gaussian weight function. The ellipticities were measured using the method of Rhodes, Refregier, & Groth (2000; hereafter RRG). This method has been well-tested on real and simulated space-based data (see Leauthaud et al. 2007). Since we are only interested in perturbations to the galaxy shapes, we do not go through the somewhat complicated steps of point spread function deconvolution, which can introduce biases in shape measurements (Heymans et al. 2006; Massey et al. 2007). Instead, we only concern ourselves with , which is relatively independent of the particularly shear measurement method. We explore the effects of S/N and galaxy size on but for the bulk of our analysis, we consider small, faint galaxies; any weak lensing survey will be dominated by galaxies that are faint and small relative to the PSF size.
For the purposes of this paper, we only introduce parallel CTI into the simulated images and we set the serial CTE equal to 100%. We do this for two reasons. First, the parallel CTI smears objects in the vertical direction (negative ), but serial CTI smears them horizontally (positive , the serial readout direction). Thus, just using the ellipticity as an indicator of CTI-induced galaxy shape changes means that the effects of serial and parallel CTI partially cancel. The combined effects change the size of the PSF, and thus must be corrected for in real images, but would provide an unfair test for these purposes. The second reason we concentrate just on parallel CTI is that the parallel CTE degradation is three times worse for a given radiation exposure (D08) and different charge trap species affect the parallel and serial CTE because of the different clocking times in the parallel and serial directions. Thus, we seek only to demonstrate that we understand the more influential effects of the parallel CTI on shape measurement in this paper.
5.1. Effect of charge trap release time
Figure 5 demonstrates the effect of charge trap release time on the measurement of photometry as measured by S/N (calculated via SExtractor; Bertin & Arnouts 1996, S/N =flux_auto/fluxerr_auto), astrometry (the centroid of an object), and shapes (rms size and ellipticity ). We measure the release time in units of “pixels,” the amount of time it takes to clock the charge by a certain number of pixels in the parallel readout direction (i.e., one “pixel” is the time between row shifts during readout).
In terms of astrometry, photometry, and size, there are two limiting regimes. Charge traps with very short release times (or slow CCD readout) push charge from an object’s leading edge onto its core, and drag core charge into a short tail. Both effects shift the object away from the readout register. The net effect also increases the object’s size, because the core contains more charge than the wings. A small amount of flux can be lost from the wings into a tail, so flux is always slightly negative. However, the smoothing inherent in trailing correlates adjacent pixels and has the perverse effect of increasing the S/N. Note that the limiting behavior at low is as expected: in our model, all traps inside a charge cloud carry an electron to the adjacent pixel at every clock cycle. In a real CCD, some charge may be released from very fast charge traps part-way through the 3-stage clocking cycle and returned to their original pixel. This process would lower the effective density of charge traps with low .
Charge traps with long release times (or fast CCD readout) steal flux primarily from an object’s leading edge, and return it to the image in pixels well separated from the object. This stolen flux lowers the detection S/N. It also shifts the centroid as before, and decreases the size. For intermediate , these effects are dominated by the addition of a tail, which increases the overall size. One curious dependency upon measurement method is that, while the rms size decreases with , the FWHM fitted by SExtractor increases: for example, FWHM is negative for small . This is presumably related to the net increase in detection S/N, and the segmentation of the image into fewer pixels that SExtractor determines belong to a given object. Note that if high were achieved by dramatically speeding the CCD readout, our assumption of instantaneous capture times may become invalid. A probabilistic capture mechanism over a finite time would result in lower effective densities of all traps, and potentially increased sensitivity to the density of charge throughout a pixel potential, changing the well filling parameters and .

The spurious ellipticity induced in an object is interestingly different. The tail and the centroid shift induced by charge traps with short release times both elongate an object in the readout direction. As the tail lengthens, the spurious ellipticity initially increases. However, once the charge in the tail is sufficiently disconnected from the object and the object’s centroid shifts back towards the correct position, the spurious ellipticity begins to decrease. In the limiting case of charge traps with very long release times, charge missing from the object’s leading edge could potentially elongate the object perpendicular to the readout direction; however, the residual centroid shift in this case is sufficient to maintain a small ellipticity in the readout direction (this result may depend upon the object’s radial profile).
Thus, we find that, in terms of weak lensing shear measurement, not all CTI is equally bad. Furthermore, there is a worst possible case, in which traps with release times corresponding to 3–4 clock cycles induce the most spurious ellipticity. This value depends upon the shape measurement method: with KSB (Kaiser, Squires & Broadhurst 1995) and RRG, it depends upon the size of the Gaussian weight function. The bump in around this value is real and also depends upon this scale. However, from a more general argument about the dissociation of flux from an object in a very extended trail, it is clear that a local maximum in will be inevitable for all shear measurement methods. The clock speed is a parameter that can be tuned in the hardware. We discuss this possibility in §6.
5.2. Effects on galaxy morphology
We create a series of images at the fiducial irradiation level of D08 (110 years at L2). We created galaxies with De Vaucouleurs (DvC) profiles and exponential profiles. For the DvC galaxies, we varied S/N, size, and input ellipticity. For each different set of simulation parameters, we create 1000 simulated galaxies, each with a different, random sub-pixel position of the galaxy centroid and different background noise realization. We measure the size in terms of the rms size . Small galaxies have a size close to that of the PSF, representing the typical galaxies that will dominate a lensing survey; large galaxies are significantly bigger than the PSF. The values of S/N, size, and ellipticity for the different simulations are shown in Table 2. The key result for weak lensing, the change in measured ellipticity, is illustrated in Figure 6.
| Profile | S/N | (S/N) | rms size [pixels] | |||
|---|---|---|---|---|---|---|
| DvC | low (13) | 1.1 | 0 | -0.028 | (small) 1.8 | 0.19 |
| DvC | low (13) | 1.1 | -0.17 | -0.024 | (small) 1.8 | 0.19 |
| DvC | low (13) | 1.2 | +0.17 | -0.031 | (small) 1.8 | 0.19 |
| DvC | high (50) | 0.7 | 0 | -0.024 | (small) 1.9 | 0.17 |
| DvC | low (20) | 0.3 | 0 | -0.010 | (large) 3.1 | 0.20 |
| DvC | high (50) | 3.0 | 0 | -0.010 | (large) 3.6 | 0.20 |
| Exponential | high (49) | 0.9 | 0 | -0.022 | (small) 1.9 | 0.18 |

As expected, the small galaxies are significantly more affected by CTI than large galaxies. We also show that for small galaxies, brightness (S/N) is a mitigating factor (but not for large galaxies); small bright objects are slightly less affected by CTI than small faint ones. Another interesting feature recovered from these simulations is the dependence of on galaxy ellipticity. Galaxies that are already aligned along the readout direction ( in the case of our simulations) are less affected by CTI than galaxies that are aligned perpendicular to the readout direction (). Perturbations in the direction (such as CTI) affect galaxies that are already aligned in the direction less than galaxies aligned in the direction.
5.3. Effects of trap density
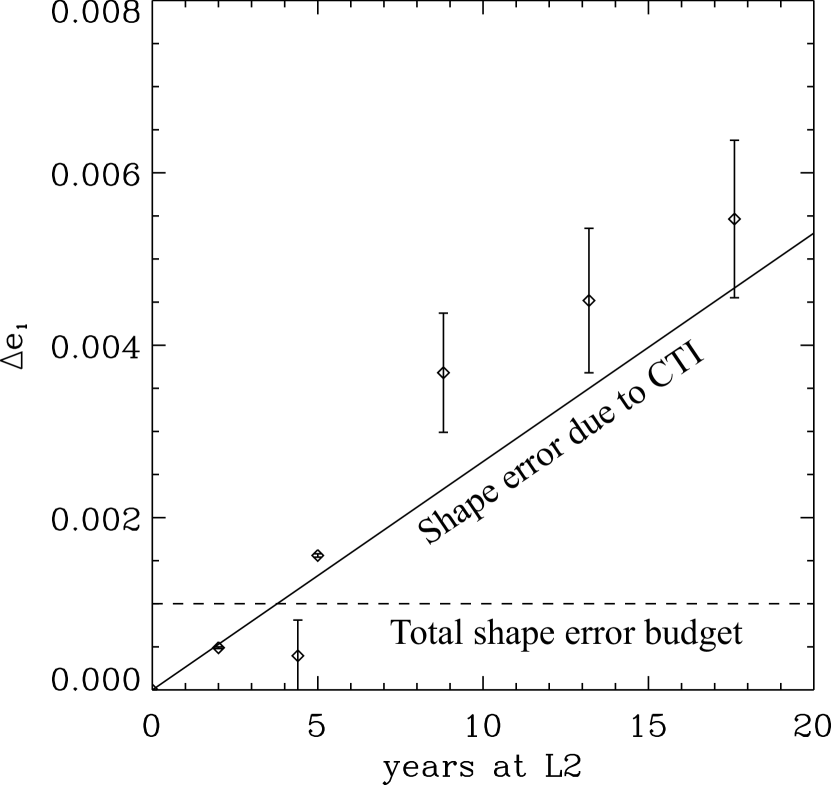
Figure 6 also shows the results of simulations with varying trap densities. We increment the trap density (in all three species) from zero to the density that would be found after 220 years at L2 (twice the fiducial value from D08). At each of 50 evenly spaced points along this timeline, we create 100 simulated galaxies, each with a DvC profile (small, low S/N, ). As expected, the degradation of shape measurement increases linearly with trap density. We find that
| (2) |
for a radiation dosage averaged over an 11-year solar cycle and yearly displacement damage dose of MeV per gram of Si. We make the simplifying assumption of zero traps (CTI) at time . However, D08 show that the number of traps in a new LBNL CCD is smaller than the measurement error, so the approximation we make here is a good one.
6. Consequences for the Future Space Missions
Amara & Refregier (2008) ascertain that the multiplicative error on measured shear needs to be kept below one part in in order that future dark energy missions not be dominated by systematic errors. This means that all sources of shear measurements error (not just the portion due to CTI) must be kept below throughout the mission lifetime. This level of shape measurement accuracy is represented in Figure 6 by a horizontal dotted line.
The prediction for after a fiducial 5 year mission can be calculated from Equation (2). To avoid any assumption of linearity with , however, we have also run a larger number of simulations at 2 and 5 years of mean L2 exposure. In each case, we created 3000 simulations to reduce measurement noise due to the sub pixel galaxy position and sky noise. We find that and . That is, without any correction, a 5 year weak lensing mission will have the entire shape measurement error budget consumed by CTI-induced effects before the end of the mission, even with specially designed, fully depleted, radiation hardened, p-channel CCDs.
Fortunately, recent work using data from the HST’s Advanced Camera for Surveys Wide
Field Camera (ACS/WFC) has shown that software postprocessing can correct the effects of CTI on galaxy
shapes by about a factor of 10 (Massey et al. 2009). Using the same code described here, trailed charge
could be moved back to where it belonged in an iterative procedure restoring images
to their true appearance. Massey et al. (2009) measured the time constants and number density of traps
in ACS/WFC as a function of time, using extragalactic survey imaging that would be naturally available
in any future survey without additional overhead. For this software, the factor of ten level of correction will be
maintained down to the regime of future missions with much lower trap densities. One component of noise
(due to variations in the number of traps in a given pixel, which we treat as a constant density) will be
improved, but this affects only scatter in rather than the level itself. We therefore
conclude that, using CCDs with the characteristics of those in our study, and proven software mitigation
techniques to achieve an additional factor of 10 correction, CTI in a future dark energy mission would
be satisfactorily controlled at only 10% of the total shape error budget.
One way in which CTI models (and mitigation techniques) could potentially be pushed beyond correction by a factor of 10 would be to precisely locate individual charge traps, rather than treating them statistically. This would be most beneficial in the early years of a dark energy mission, when . Designing flexibility into the clocking speed, waveform, and voltage in CCD electronics provides the ability to locate traps via “pocket pumping” (Janesick 2001). Pocket pumping is a process in which a uniform level of charge introduced by a flat field lamp is rapidly shuffled back and forth thousands of times in the parallel direction. Following the charge shuffle, the charge is transferred to the readout transistor in the normal manner. The resulting image reveals accumulated charge captured and then released by each trap in the shape of a dipole of an overdensity neighboring an underdensity of charge. The orientation and strength of this dipole reveal the location of the trap within the pixel and the effectiveness of the trap. This can be repeated with different levels of initial charge to map out traps in 3 dimensions within the CCD. Because the readout time of the CCD is dominated by the clocking of serial charge, the pumping of charge in the parallel direction does not introduce a significant amount of overhead to the survey. For example, it takes approximately 45 seconds to record a normal image from the LBNL CCDs using the D08 clocking parameters. Image acquisition takes an additional 45 seconds for 20000 cycles of pocket pumping with a five pixel shift. Acquisition of five successive pocket-pumping images every week to reject cosmic rays and model the traps therefore would account for less than ten minutes of additional calibration time.
Another suggested mitigation technique is “charge injection” (also called “fat zero” or “pre-flash”) in which charge is placed into the pixels in order to fill the traps. The charge injection is simply a method to increase the overall background level and fill the volume. However, this has the effect of increasing the background in an image (much like increasing the zodiacal background) and will reduce the S/N of the detected objects. This is obviously undesirable for a weak lensing experiment in which the observer is attempting to measure shapes of faint galaxies.
We showed in §5.1 that there exist clocking time scales that are maximally bad for shape measurement. If the clock cycle is 3–4 times the trap release time, then is maximized. Thus, future missions with weak lensing as a primary science driver should include an optimization of the charge clocking time in their CCD readout electronics. Increasing the rate at which charge is clocked serially, and thus increasing the rate at which parallel transfers of rows can be made, increases readout noise, resulting in an effective loss of survey depth; decreasing the rate at which charge is serially clocked increases the readout time and, if that dominates over factors like slew and settle time between exposures, will reduce survey area. Thus, careful consideration must be paid to the trade-offs in any such optimization. Furthermore, we are only making recommendations for how to minimize shape measurement errors due to CTI. Photometry is also degraded by traps with large values of relative to the charge clock period. This can remove charge from objects but place it far enough away that the shape is not significantly affected. Thus, trade-offs in charge clocking time must also take into account the photometric accuracy requirements of the mission.
We finally note that the temperature at which detectors are operated at has significant effect on CTE, and thus future missions should be tested and optimized with this in mind.
7. Conclusions
We have quantified the effect of CTI on measurements of weak gravitational lensing. We first simulated the transfer of charge within LBNL p-channel CCDs using a model for charge traps with three characteristic release times to reproduce the experimental results of D08. Using this model, we then simulated deep exposures of galaxies for weak lensing measurements from a space-based telescope subject to radiation damage. The resulting simulated data were used to quantify the effects of radiation damage on shape measurements of galaxies of various sizes and S/N levels, the true shapes of which were precisely known. Most galaxies in any weak lensing survey will be small and faint; as expected, we find that these suffer worst from the effects of CTI.
The level of CTI-induced shape error will approach the total shape error budget of a dark
energy mission (1 part in ; Amara & Refregier 2008) after less than 4 years of radiation exposure at L2.
Software mitigation techniques in image postprocessing, already proven on HST data (Massey et al. 2009),
will be able to reduce the levels of shape error well below mission requirements. We have also suggested
hardware capabilities, such as “pocket pumping” and adjustments to the readout speed, that may provide
additional help. However, our numerical results are only valid for p-channel devices, whose CTE characteristics after
radiation exposure have been shown to be superior to more common n-channel devices (Lumb 2009; Marshall et al. 2004).
Given the necessity of both hardware and software mitigation of CTI effects for successful mission
operation, we recommend that future spacecraft be designed with detectors and mission parameters that ensure CTE characteristics
no worse than the LBNL p-channel devices we simulated for this work.
There are several caveats to our results. First, we assumed that all galaxies are small, faint, and lie far from the readout register. Galaxies that are bright, large, or nearer the readout register will suffer less from CTI. Indeed, the average distance to the readout register will be exactly half of the worst case scenario we outlined, so the mean will be a factor of two lower. In a real mission, there will be several dithered exposures of each galaxy, with each dither placing the galaxy a different distance from the readout register; this may allow us to further model the effects of CTI on shapes and partially mitigate those effects. We also assumed a high level of radiation from the Sun for at least a portion of the mission due to modeling radiation flux in the heaviest part of a typical 11-year solar cycle. A mission flown during the level of minimum particle radiation at L2 would suffer less radiation damage, but a mission flown entirely during the maximum of the solar radiation flux would suffer more damage. This is a large uncertainty because the radiation flux due to the Sun can vary by an order of magnitude over the solar cycle (Barth et al. 2000). Furthermore, any real mission would need to adjust the flux according to the planned shielding on the spacecraft (D08 assume the SNAP design) and should take into account secondary particle cascades from reactions of high energy radiation with the shielding material (D08 ignored such secondary radiation). The ‘stacking’ and ‘trails’ methods probe different properties of CTE and we have chosen the fits to trails in D08 to model the effects of radiation exposure on shape measurements. We have only explored the charge transfer and radiation tolerance properties of a certain model of CCD operating at a single temperature; any future space-based weak lensing missions should undertake a similar analysis using the CCDs planned for that mission. Finally, if the CCDs contain a significant density of traps even before they are launched into the harsh radiation environment of space, the CTI will be worse throughout, and the useful mission lifetime reduced. Clearly, then, this paper is a first step, and any future mission should use a procedure similar to the one we have developed in this paper to meet specific mission requirements by fully optimizing its choice of CCDs, clocking rate, and shielding.
References
- Albrecht (2006) Albrecht, A., et al., 2006, astro.ph..9591A
- Amara (2008) Amara, A., & Refregier, A., 2008, MNRAS, 391, 228
- Bacon (2000) Bacon, D., Refregier, A., & Ellis, R., 2000, MNRAS, 318, 625
- Barth (2000) Barth, J., Isaacs, J., & Poivey, C., 2000,“The Radiation Environment for the next generation space telescope,” GSFC
- Bebek (2007) Bebek, C., 2007, NIMPA, 579, 848
- Bebek (2002) Bebek, C., et al., 2002, SPIE 4669, 161-171
- Bertin (1996) Bertin, E., & Arnouts, S. 1996, A&AS, 117, 393
- Caldwell (2004) Caldwell, R., 2004, MPLA, 19, 1063
- Chiaberge (2009) Chiaberge, M., et al., 2009, Instrument Science Report ACS 2009-01, STScI
- Dawson (2008) Dawson, K., et al., 2008, IEEE Transactions on Nuclear Science, 55, 1725
- Dolphin (2009) Dolphin, A., 2009, PASP, 121, 655
- Goudfrooij (2006) Goudfrooij, P., et al., 2006, PASP 118, 1455
- Gow (2009) Gow, J., et al., 2009, SPIE,7435, 74350F-2
- Hall (1952) Hall R., 1952, Phys. Rev. 87, 387
- Hardy (1998) Hardy T., Murowinski R. & Deen M., 1998, IEEE Trans. Nuclear Sci. 45, 154
- Heymans (2006) Heymans, C., et al., 2006, MNRAS, 368, 1323
- Hoekstra (2008) Hoekstra, H., & Jain, B., 2008, ARNPS, 58, 99
- Holland (2006) Holland, S.E., et al., 2006, SPIE, 6276, 10H
- Holland (2002) Dawson, K., et al., 2003, IEEE Trans. Electronics Dev., 50, 225
- Janesick (1991) Janesick, J., et al., 1991, SPIE, 1447, 87
- Janesick (1992) Janesick, J., & Elliott, T., 1992, ASPC, 23, 1J
- Janesick (2001) Janesick J., “Scientific Charge Coupled Devices”, 2001, SPIE (ISBN 0-8194-3698-4)
- Jun (2003) Jun, I. et al., 2003, NSS-IEEE, 50, 192.
- Kaiser (1995) Kaiser, N., Squires, G., & Broadhurst, T., 1995, ApJ, 449, 460
- Kaiser (2000) Kaiser, N., Wilson, G., & Luppino, G., astro-ph/0003338
- Leauthaud (2007) Leauthaud, A., et al., 2007, ApJS, 172, 219
- Lumb (2009) Lumb, D., 2009, SPIE, 743904
- Massey (2007) Massey, R., et al., 2007, MNRAS, 376, 13
- Massey (2009) Massey, R., et al., 2009, submitted
- Marshall (2004) Marshall, C., et al., 2004, SPIE, 5499,542
- Mutchler (2005) Mutchler, M., & Siriani, M. 2005, Instrument Science Report ACS 2005-03, STScI
- Perlmutter (1998) Perlmutter, S., et al., 1998, ApJ, 517, 565
- Rhodes (2007) Rhodes, J., et al., 2007, ApJS, 172, 203
- Rhodes (2004a) Rhodes, J., et al., 2004, APh, 20, 377
- Rhodes (2004b) Rhodes, J., et al., 2004, ApJ, 605, 29
- Rhodes (2000) Rhodes, J., Refregier, A., & Groth, E., 2000, ApJ, 536, 79
- Riess (1998) Riess, A., et al., 1998, AJ, 116, 1009
- Schrabback (2007) Schrabback, T., et al., A&A, 468, 823
- Seabroke (2008) Seabroke G., et al., 2008, SPIE, 7021, 49S
- Shockley (1952) Shockley W. & Read W., 1952, Phys. Rev. 87, 835
- Sirianni (2005) Sirianni, M., et al., 2005, PASP 117, 1049
- Spergel (2007) Spergel, D., et al., 2007, ApJS, 170, 377s
- Spreatt (2005) Spratt, J.P., et al. 2005, IEEE Trans Nuc Sci, 52, 6, 2695
- Van Waerbeke (2000) Van Waerbeke, L., et al., 2000, A&A, 538, 30
- Wittman (2000) Wittman, D., et al., 2000, Nature, 405, 143
- Xapsos (1999) Xapsos M.A., et al., 1999, NASA/TP-1999-209763.