0045
Isabel Pérez;
Deriving the pattern speed using dynamical modelling of gas flows in barred galaxies
Abstract
In this paper we analyse the methodology to derive the bar pattern speed from dynamical simulations. The results are robust to the changes in the vertical-scale height and in the mass-to-light () ratios. There is a small range of parameters for which the kinematics can be fitted. We have also taken into account the use of different type of dynamical modelling and the effect of using 2-D vs 1-D models in deriving the pattern speeds. We conclude that the derivation of the bar streaming motions and strength and position of shocks is not greatly affected by the fluid dynamical model used. We show new results on the derivation of the pattern speed for NGC 1530. The best fit pattern speed is around 10 km s-1 kpc-1 , which corresponds to a , implying a slower bar than previously derived from more indirect assumptions. With this pattern speed, the global and most local kinematic features are beautifully reproduced. However, the simulations fail to reproduce the velocity gradients close to some bright HII regions in the bar. We have shown from the study of the H equivalent widths that the HII regions that are located further away from the bar dust-lane in its leading side, downstream from the main bar dust-lane, are older than the rest by 1.5–2.5 Myr. In addition, a clear spatial correlation was found between the location of HII regions, dust spurs on the trailing side of the bar dust-lane, and the loci of maximum velocity gradients parallel to the bar major axis.
keywords:
galaxies: kinematics and dynamics – galaxies: spiral – galaxies: structure1 Introduction
The speed at which the bar rotates is one of the fundamental ingredients describing bars, their evolution and their coupling with other galaxy components. Its importance is indeed reflected in the fact that this whole volume is devoted to the study of pattern speeds.
Some conclusions were already stated in the 90’s about bar pattern speeds (Elmegreen 1996). The pattern speed seems to be close to the angular circular velocity in the disk near the end of the bar. The corotation radius seems to be around 1.2 times the bar semi-major axis, at least for early type galaxies. The question about the dependence of the pattern speed with morphological type was also raised and it is still an open question subject to discussion (Rautiainen et al. 2005). It was also already concluded that the best method for obtaining the location of corotation was that proposed by Tremaine & Weinberg (1984), hereafter TW method) which uses a set of simple kinematic measurements to derive the pattern speed assuming that the tracer obeys the continuity equation, that the disks are flat and that there is one well defined pattern speed. Some of these assumptions have been recently challenged, there is now a simple extension of the TW method to multiple pattern speeds (Maciejewski 2006) and the fact that Beckman et al. (this volume) have shown that the TW method can be applied to H velocity fields raises some interesting issues.
Some indirect methods to derive the bar pattern speed include identifying morphological or kinematic features with resonances (e.g., Athanassoula 1992, shape of dust lanes; Canzian 1993, sign inversion of the radial streaming motion across corotation; Buta 1986, 1995, rings as resonance indicators; Zhang & Buta 2007, phase-shift between the potential and density wave patterns). Other methods are based on numerical modelling: (1) matching numerical simulations to the observed velocity fields, from a set of general self-consistent models or models deriving the potential from the light distribution (e.g., Duval & Athanassoula 1983; Lindblad et al. 1996; Weiner et al. 2001; Pérez et al. 2004; Zánmar-Sánchez et al. 2008; Pérez & Zurita, in prep.), and (2) numerical simulations matched to galaxy morphology (e.g., Hunter et al. 1988; England 1989; Rautiainen et al. 2005). The best indirect method, so far, to calculate pattern speeds is the method based on the comparison of gas velocities to those obtained in numerical simulations that use a potential obtained from optical or NIR light (Elmegreen 1996).
In this paper, we will investigate the derivation of pattern speeds from dynamical simulations, and we will analyse the possible problems and caveats that one encounters when deriving bar pattern speeds in this indirect way. Finally, we will present some new results on the bar of NGC 1530.
2 Deriving the pattern speed
The method to derive the pattern speeds from dynamical modelling is relatively simple. From an optical or NIR image one can derive the gravitational potential with some assumptions for the ratio and the vertical scale-height, and imposing a certain pattern speed, then gas flows are modelled using a fluid dynamical method, exploring a certain range in parameter space. The modelled gas dynamics is then compared to the observed kinematics until the best-fit solution is found.
The N-body and hydro code, used by us in this work, was initially developed by the Geneva Observatory galactic dynamics group for spiral galaxy studies (Fux 1999, 1997; Pfenniger & Friedli 1993). The initially self-consistent code was modified to use a fixed rotating potential. The stellar potential is fixed using the observed light distribution. For more details about the code, refer to Fux (1999) or his Ph.D. Thesis, Fux (1997). For more details about the code in the form used for this work refer to Pérez et al. (2004).
In this way, we have modelled 5 barred galaxies (NGC 5505, NGC 7483, NGC 5728, and NGC 7267). Other groups that have taken the fluid dynamical modelling approach to derive the bar dynamics, using the light distribution to derive the potential, are Weiner et al. 2001, modelling NGC 4123 and Zánmar-Sánchez et al. (2008) modelling NGC 1365, both using a 2-D Eulerian grid code. All these studies concluded that the corotation radius is close to the end of the bar (i.e., fast bars).
Now, we will briefly analyse the effect of changing the model parameters on the output pattern speed.
The calculation of the from the broad–band colors using population synthesis models is robust to most of the parameters going into the modelling (Bell & de Jong 2001; Pérez 2003), such as SFR, although, the absolute normalisation depends on the chosen IMF. The photometric bands for which the ratio is most robust to galaxy colour changes are the NIR bands.
As already shown in Pérez et al. (2004), the scale height and the ratio affect the location and amplitude of the shocks in the bar region. For the vertical distribution an exponential profile is assumed with a radially constant vertical scale-height. This may not be a good assumption as there is evidence from infrared photometric studies of the Milky Way that the vertical scale of the bar is larger than that of the disk (Freudenreich 1998). The biggest impact on the dynamics of a non-constant scale-height is precisely in the inner region we are interested in, where the radial forces will change significantly. However, it is hard to do better than this since not much is known about the scale-heights of bars in external galaxies. For most of the simulations one value of the scale-height was adopted, following the relationship found by Kregel et al. (2002). They analysed the structure of the stellar disk in a sample of edge-on galaxies and found that the average , where and are respectively the disk exponential scale-length and scale-height. For the scale-heights smaller than , as defined before, none of the pattern speeds gives a good fit for the studied galaxies. For the models with the best fit corresponds to a slower bar; however, an average of kpc is an unrealistically large value for the vertical scale of a real galaxy with the observed scale-length (within the ranges of scale-lengths analysed).
Varying the for a given pattern speed causes a variation in the positions and strength of the shocks. The derivation of the pattern speed is robust to changes; i.e., there is a small range of ratios for which the models fit the observed kinematics (Weiner et al. 2001; Pérez et al. 2004). If we derive the models keeping the ratios and varying the pattern speeds, the shock gets steeper for slower bars and not only the morphology changes, but also the gas flow changes and the locations and amplitude of the shocks no longer fits the kinematics. The pattern speed is constrained within 10–20%.
We have also taken into account the use of different type of dynamical modelling and the effect of using 2-D vs 1-D in deriving the pattern speeds. Pérez (2008) showed that the global velocity field and the gas distribution is very similar in both 2-D and 3-D models. The study shows that the position and strength of the shocks developed in the 3-D N-body SPH simulations do not vary significantly compared to the results derived from the 2-D Eulerian code. The results obtained in the studies deriving the barred galaxies using the bar streaming motions and strength and position of shocks are robust to the fluid dynamical model used. Therefore, the effect of 2-D and 3-D modelling can be neglected in this type of studies.
Summarising, the pattern speed is constrained within 10–20% using this indirect approach. All the galaxies studied in this way by the different groups give pattern speeds that locate corotation close to the end of the bar. The morphological types covered for these type of simulations include from SBa to SBc galaxies, however, only a small number of galaxies have been modelled in this way.
3 Modelling NGC 1530
NGC 1530 is an archetypal barred galaxy, at intermediate inclination (between 40∘–50∘ according to different studies), it has one of the largest bars ever observed, around 24 kpc in length. The bar is dominated morphologically in the optical bands by dust lanes running straight along the bar. It has a complicated morphology in the nuclear region characterised in the optical and CO bands by a nuclear ring/spiral. NGC 1530 has been classified as a class 7 torque (Block et al. 2004) using the dust-penetrated classification scheme of Block & Puerari (1999), this makes NGC 1530 one of the strongest bars found in the literature. The weak inner pseudoring in this object is made from arms that break from the ends of the bar and wrap around the other ends (Block et al. 2004). Although it has been widely studied, there has not been an attempt to specifically model in detail the velocity field of NGC 1530 and, so far, only general SPH models of barred galaxies have been used to compare the global trends of the observed velocity field of NGC 1530. Due to the richness of the bar region structures, and the availability of high H velocity field (Zurita et al. 2004) NGC 1530 is a perfect candidate to test whether N-body/SPH can reproduce the details of this galaxy’s morphology and velocity field and whether this type of simulations can teach us something else about the dynamics of this galaxy.
Indirect assumptions have lead to the different authors to place corotation at 1.0 and 1.2 times the bar semi-major axis, with derived pattern speeds of 12 and 20 km s-1 kpc-1 , respectively (Downes et al. 1996; Regan et al. 1996), either assuming where the ILR resonance or where corotation are located, and always based on the fact that the size of the nuclear spiral/ring is around 1.5 kpc in radius, and corresponds to the location of the inner Lindblad resonance. We have carried out a detailed modelling of NGC 1530 to study the position of the resonances, and the correspondence of the dynamics with the star formation in this galaxy. As already mentioned, this is not the first attempt to understand the relation between the star formation and the morphology and kinematics of this galaxy but this is the first attempt to do a detailed comparison with numerical models, where the potential is derived directly from the light distribution of NGC 1530.
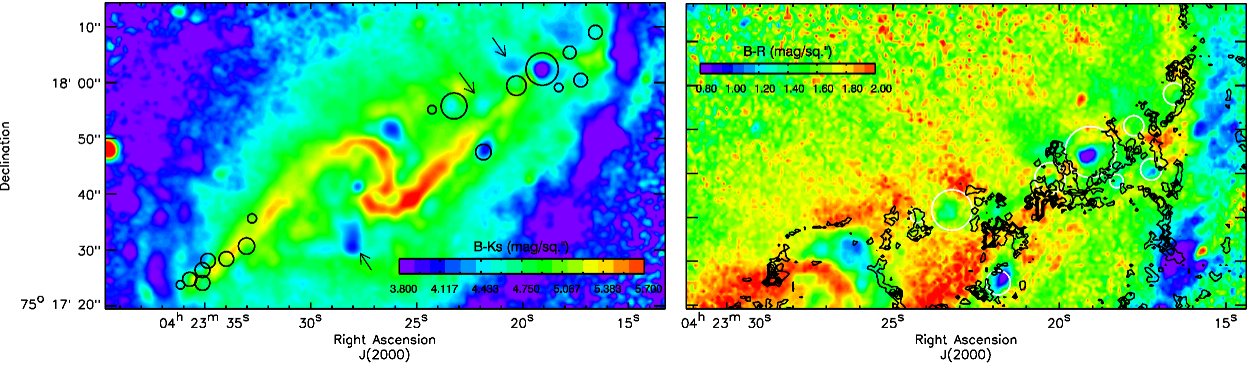
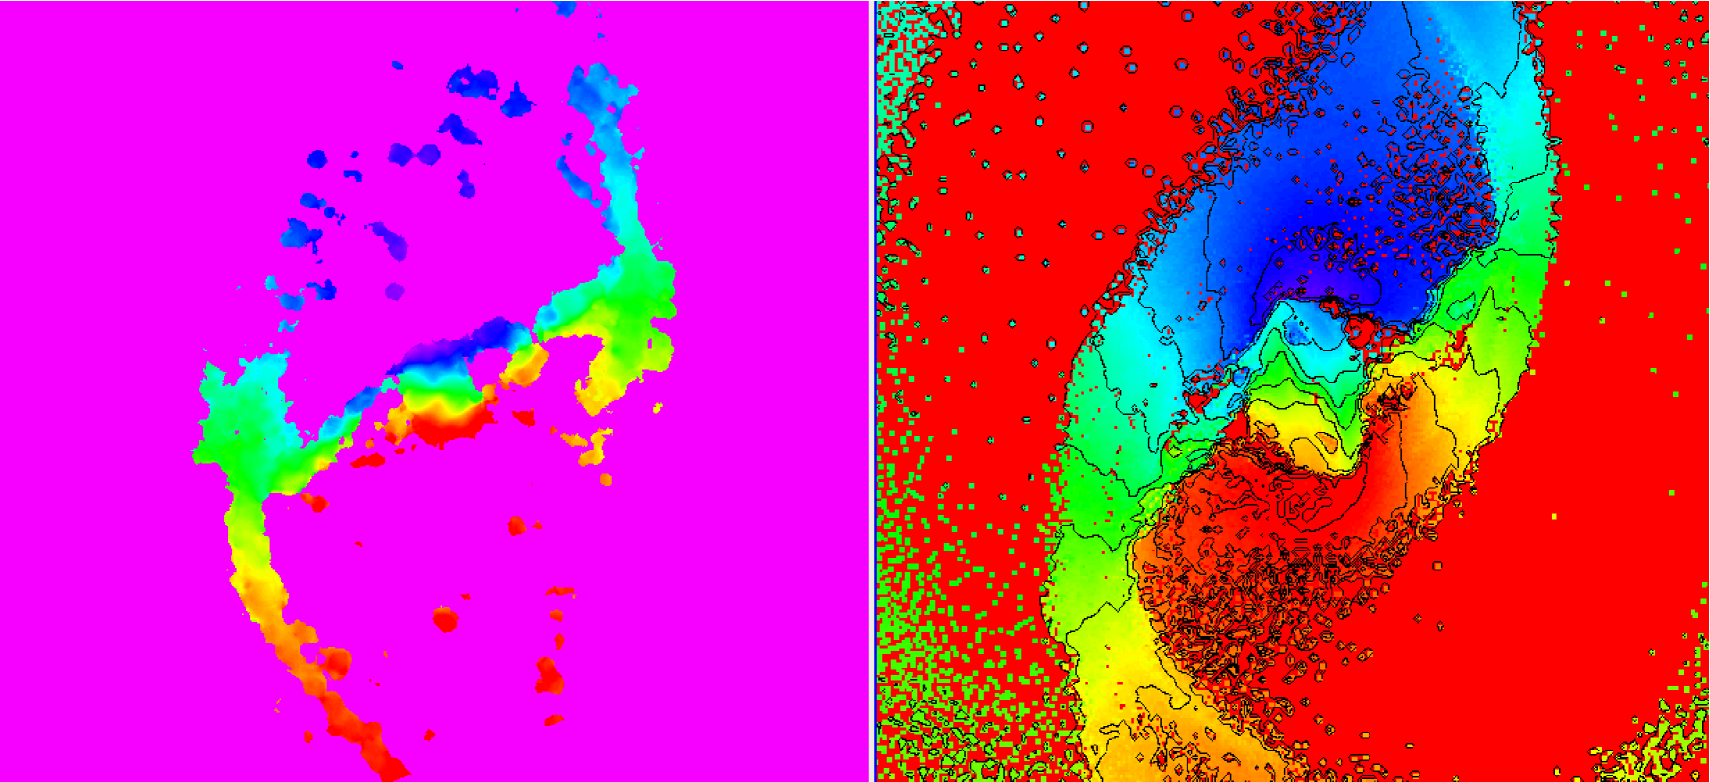
The best fit pattern speed is around 10 km s-1 kpc-1 , which corresponds to a , which implies a slower bar than previously derived from more indirect assumptions. With this pattern speed the global kinematic features are beautifully reproduced (Fig. 1). The models also develop the inner spiral/ring at around 1.2 kpc that in previous studies was associated to the first ILR. For this pattern speed, we find two ILRs one at around 0.15 kpc and the other at 4 kpc. The results are compatible with a maximum disk. The presence of an inner ring/spiral necessarily implies the existence of an ILR, as previously suggested; however, the radius of the ring/spiral need not be, necessarily, at the location of the resonance (Pérez & Zurita, in prep.). We also find that the SPH models fail to fully reproduce the exact location of the velocity gradients observed along the bar, on the north side, close to some bright HII regions. The HII regions in the bar region have been studied in detail in Zurita & Pérez (2008). They concluded from the study of the H equivalent widths that the HII regions that are located further away from the bar dust-lane in its leading side, downstream from the main bar dust-lane, are older than the rest by 1.5–2.5 Myr. In addition, a clear spatial correlation was found between the location of HII regions, dust spurs on the trailing side of the bar dust-lane, and the loci of maximum velocity gradients parallel to the bar major axis (possibly tracing gas flow towards the main bar dust-lane), see Fig. 2. These results support the hypothesis that massive stars are forming on the trailing side of the bar dust-lane, and age as they cross the bar, on a timescale that is compatible with the bar dynamics time–scales.
4 Conclusions
We have analysed the use of dynamical simulations deriving the potential from the galaxy light distribution to obtain the best-fit pattern speed when compared to observed kinematics. There is a small range of parameters for which the kinematics can be fitted. We have analysed the effect of varying these parameters, namely the ratio, the pattern speed and the vertical scale-height. We can constrain the pattern speeds within 10–20%. All the galaxies modelled in this way give pattern speeds that place corotation near the end of the bar. The results are also unaffected by the choice of the model in the dynamical modelling (Pérez 2008). We have, therefore, refined the methods (e.g., derivation) and the study of the systematics in this type of modelling but only for a handful of galaxies have the gas flows been derived (Zánmar-Sánchez et al. 2008; Pérez et al. 2004; Weiner et al 2001). This way of deriving the pattern speed is perfect to study later types which present nebular emission in the bar region. We should also compare, in the future, these results with sticky–particle simulations to check the reliability of the results, and improve the sample, carrying out the modelling in overlapping samples where the pattern speeds have been derived using different methods (cf., TW, morphology, etc.).
Unfortunately, we have not fully addressed yet with this method the study of later morphological types. We have presented here first results on the detail comparison of the modelled dynamics with the 2-D H velocity fields for NGC 1530. The models reproduce the global and local velocity fields (detailed results in Pérez & Zurita, in prep.). However, it fails to reproduce the velocity gradient on the north-side of the bar close to a few bright HII regions. Analysis of the H equivalent widths show that the HII regions that are located further away from the bar dust-lane in its leading side, downstream from the main bar dust-lane, are older than the rest by 1.5–2.5 Myr. In addition, a clear spatial correlation was found between the location of HII regions, dust spurs on the trailing side of the bar dust-lane, and the loci of maximum velocity gradients parallel to the bar major axis (Zurita & Pérez 2008).
Acknowledgements.
I. Pérez is supported by a postdoctoral fellowship from the Netherlands Organisation for Scientific Research (NWO, Veni-Grant 639.041.511) and the Spanish Plan Nacional del Espacio del Ministerio de Educación y Ciencia. A.Z acknowledges support from the Consejería de Eduación y C iencia de la Junta de Andalucía.References
- Athanassoula (1992) Athanassoula, E. 1992, MNRAS, 259, 345
- Block et al. (2004) Block, D. L., Buta, R., Knapen, J. H., et al. 2004, AJ, 128, 183
- Buta (1986) Buta, R. 1986, ApJS, 61, 609
- Downes et al. (1996) Downes, D., Reynaud, D., Solomon, P. M., & Radford, S. J. E. 1996, ApJ, 461, 186
- Duval & Athanassoula (1983) Duval, M. F., & Athanassoula, E. 1983, A&A, 121, 297
- Canzian (1993) Canzian, B. 1993, ApJ, 414, 487
- Elmegreen (1996) Elmegreen, B. 1996, in Barred galaxies, IAU Coll. 157, ASP. Conf. Ser. 91, ed. R. Buta, D. A. Crocker, & B. G. Elmegreen (ASP, San Francisco), 197
- England (1989) England, M. N. 1989, ApJ, 344, 669
- Freudenreich (1998) Freudenreich, H. T. 1998, ApJ, 492, 495
- Fux (1997) Fux, R. 1997, Ph.D. Thesis, Geneva University
- Fux (1999) Fux, R. 1999, A&A, 345, 787
- Hunter et al. (1988) Hunter, J. H., Jr., England, M. N., Gottesman, S. T., Ball, R., & Huntley, J. M. 1988, ApJ, 324, 721
- Kregel et al. (2002) Kregel, M., van der Kruit, P. C., & de Grijs, R. 2002, MNRAS, 334, 646
- Lindblad et al. (1996) Lindblad, P. O., Hjelm, M., Hoegbom, J., et al. 1996, A&AS, 120, 403
- Maciejewski (2006) Maciejewski, W. 2006, MNRAS, 371, 451
- Perez (2003) Pérez, I. 2003, Ph.D. Thesis, Australian National University
- Perez (2003) Pérez, I. 2008, A&A, 478 717
- Perez (2003) Pérez, I., Fux, R., & Freeman, K. C. 2004, A&A, 424, 799
- Pfenniger & Friedli (1993) Pfenniger, D., & Friedli, D. 1993, A&A, 270, 561
- Regan et al. (1996) Regan, M. W., Teuben, P. J., Vogel, S. N., & van der Hulst, T. 1996, AJ, 112, 2549
- Rautiainen et al. (2005) Rautiainen, P., Salo, H., & Laurikainen, E. 2005, ApJ, 631, L129
- Tremaine & Weinberg (1984) Tremaine, S., & Weinberg, M. D. 1984, ApJ, 282, L5
- Weiner et al. (2001) Weiner, B. J., Sellwood, J. A., & Williams, T. B. 2001, ApJ, 546, 931
- Zánmar Sánchez et al. (2008) Zánmar Sánchez, R., Sellwood, J. A., Weiner, B. J., & Williams, T. B. 2008, ApJ, 674, 797
- Zhang & Buta (2007) Zhang, X., & Buta, R. J. 2007, AJ, 133, 2584
- Zurita (2008) Zurita, A., & Pérez, I. 2008, A&A, 485, 5
- Zurita et al. (2004) Zurita, A., Relaño, M., Beckman, J. E., & Knapen, J. H. 2004, A&A, 413, 73