A coincidence between a hydrocarbon plasma absorption spectrum and the 5450 DIB
Abstract
Aims. The aim of this work is to link the broad 5450 diffuse interstellar band (DIB) to a laboratory spectrum recorded through expanding acetylene plasma.
Methods. Cavity ring-down direct absorption spectra and astronomical observations of HD183143 with the HERMES spectrograph on the Mercator Telescope in La Palma and the McKellar spectrograph on the DAO 1.2 m Telescope are compared.
Results. In the 543-547 nm region a broad band is measured with a band maximum at 545 nm and FWHM of 1.03(0.1) nm coinciding with a well-known diffuse interstellar band at 5450 with FWHM of 0.953 nm.
Conclusions. A coincidence is found between the laboratory and the two independent observational studies obtained at higher spectral resolution. This result is important, as a match between a laboratory spectrum and a – potentially lifetime broadened – DIB is found. A series of additional experiments has been performed in order to unambiguously identify the laboratory carrier of this band. This has not been possible. The laboratory results, however, restrict the carrier to a molecular transient, consisting of carbon and hydrogen.
Key Words.:
Diffuse Interstellar Bands, DIBs, cavity ring-down spectroscopy, absorption spectroscopy1 Introduction
Diffuse interstellar bands are absorption features observed in starlight crossing diffuse interstellar clouds. Since their discovery in the beginning of the 20th century, scientists have been puzzled by the origin of these bands that appear both as relatively narrow and rather broad bands covering the UV/VIS and NIR (A. G. G. M. Tielens & T. P. Snow, 1995). In the last decennia the idea has been established that it is unlikely that all these bands are due to one or a very few carriers and with the progress of optical laboratory techniques, several families of potential carriers have been investigated. It was shown that the electronic transitions of a series of PAH-cations do not match the listed DIBs (Salama et al., 1996, 1999; Bréchignac & Pino, 1999; Ruiterkamp et al., 2002). Similarly, systematic laboratory studies of electronic spectra of carbon chain radicals have not resulted in positive identifications either (Motylewski et al., 2000; Ball et al., 2000a; Jochnowitz & Maier, 2008), even though it is known from combined radio-astronomical and Fourier Transform Microwave (FTMW) studies that many of such species are present in dense clouds (Thaddeus & McCarthy, 2001). Only C3 has been recorded unambiguously in diffuse interstellar clouds (Maier et al., 2001). Other studies, focusing on multi-photon excitation in molecular hydrogen (Sorokin et al., 1998), or spectra of fullerenes and nano-tubes (Kroto & Jura, 1992; Foing & Ehrenfreund, 1994) have been unsuccessful as well. In the past years, several coincidences between laboratory and astronomical DIB studies have been reported in the literature. These have all turned out to be accidental, and from a statistical point of view, the chance of an overlap is also quite substantial, DIBs cover a major part of the wavelength region between roughly 350 and 1000 nm. However, there are a number of conditions that have to be fulfilled before a coincidence of a laboratory and an astronomical DIB spectrum may be interpreted as a real match. These conditions have become more and more strict with the recent improvement in achievable spectral resolution, both in laboratory and astronomical studies.

The two most important DIB matching criteria to link laboratory and
astronomical data are:
-
1.
The gas phase laboratory and observational values of both peak position and bandwidth of the origin band transition should be identical, unless it can be argued that a spectral shift or band profile change may be due to an isotope or temperature effect. An example of the latter is given by spectroscopic measurements on benzene plasma yielding an absorption feature coinciding with the strongest DIB at 442.9 nm (Ball et al., 2000b; Araki et al., 2004). The laboratory FWHM turned out to be narrower than in the astronomical spectrum. It was argued that the spectrum of a non-polar molecule cooled in a molecular expansion may be considerably colder than in space where only radiative cooling applies. A similar discussion has been given by (Motylewski et al., 2000) who showed that unresolved rotational profiles may change substantially for different temperatures, as has also been calculated and discussed by Cossart-Magos & Leach (1990).
-
2.
Once the origin band overlaps with a DIB feature, gas phase transitions to vibrationally excited levels in the electronically excited state of the same carrier molecule should match as well and the resulting band profiles should behave in a similar way (i.e. with comparable equivalent width ratios) (Motylewski et al., 2000). A good example for this is the electronic spectrum of C7- that has been regarded for several years as a potential carrier as subsequent electronic bands fulfilled both conditions (Tulej et al., 1998; Kirkwood et al., 1998). Detailed follow-up studies showed that the series of (near) matches was coincidental (McCall et al., 2001).
In the end, and despite much progress both from the observational and laboratory side, all efforts to assign DIBs have resulted in a rather static situation – triggering more and more exotic explanations for DIB carriers – and the origin of the DIBs is still as mysterious as it was nearly 100 years ago.
In this letter we report a match of a laboratory spectrum with a diffuse interstellar band that is special as the first condition is fulfilled for a rather broad and potentially lifetime broadened DIB, i.e. the laboratory and astronomical spectrum should be fully identical, independent of temperature restrictions. New astronomical observations obtained with the Mercator telescope, using the HERMES spectrograph and the Dominion Astrophysical Observatory (DOA) 1.2 meter telescope, using the McKellar spectrograph are presented in order to characterize the band profile of the 5450 DIB with the best possible resolution. Even though we have not been able to unambiguously identify the laboratory carrier, that most likely is a smaller hydro-carbon bearing molecular transient, we think that this overlap is important to report, as it provides a new piece of the puzzle.
2 Laboratory Experiments
The experimental set-up has been described (Linnartz et al., 1998; Motylewski & Linnartz, 1999) and has been extensively used to study a large number of carbon chain radicals of astrophysical interest (Jochnowitz & Maier, 2008). The monochromatic output 0.1 cm-1 at 540 nm ( 18,500 cm-1) of a pulsed dye laser based cavity ring-down setup is focused into an optical cavity consisting of two highly reflective mirrors (R 0.9999). A special pulsed high pressure slit-nozzle system capable of producing intense 300 s long plasma pulses by discharging (- 1 kV, 100 mA) an expanding gas mixture of 1 acetylene (C2H2) in He is mounted inside the cavity with its slit parallel to the optical axis of the cavity. In the expansion a large variety of new species is formed and as the technique is not mass selective, special care has to be taken when assigning bands to specific carriers. Mass selective matrix isolation spectra offer a good starting point for an assignment (Jochnowitz & Maier, 2008). In the case of rotationally resolved spectra unambiguous identifications are generally possible, either by combination differences of accurate spectral fits, or by isotopic studies using C2D2 instead of C2H2 (or a mixture of C2H2/C2D2). The source runs at 30 Hz and special care is taken that the pressure inside the cavity remains constant during jet operation to reduce baseline fluctuations. Rotational temperatures are typically of the order of Trot 10-20 K. This low temperature results in a spectral simplification and simultaneously increases the detection sensitivity because of an improved state-density. In addition, the source offers a Doppler free environment with a relatively long effective absorption path length. The laser beam intersects the 3 cm long planar expansion about 5-10 mm downstream using a sophisticated trigger scheme. Subsequent ring-down events (typically 20-30 s for a 52 cm long cavity) are recorded as function of the laser frequency by a photo-diode and transferred to an averaged ring-down time by fitting 45 subsequent ring-down events. This value as function of the laser wavelength provides a sensitive way to record optical spectra. An absolute frequency calibration is obtained by recording an I2 reference spectrum simultaneously.
3 Astronomical Observations
The laboratory data are compared to observations from two different astronomical facilities.
3.1 HERMES @ Mercator Telescope
The HERMES observations were carried out in service mode using the Mercator telescope at Roque de los Muchachos Observatory on La Palma. The 1.2 m telescope is operated by the Katholieke Universiteit in Leuven, Belgium, in collaboration with the Observatory in Geneva, Switzerland. The spectra were obtained in June 2009 with HERMES (High Efficiency and Resolution Mercator Echelle Spectrograph) (Raskin & Van Winckel, 2008), which is a fibre-fed-cross-dispersed spectrograph. The spectrograph has a fixed spectral format and samples the spectrum between 377 and 990 nm in 55 spectral orders on a 4.6 k x 2 k CCD. The spectral resolution is slightly variable over the field, but is 85,000 on average. We obtained 3 spectra of 1,200 s of HD 183143 (B7Ia, m(v)=6.92, B-V=+1.001), the DIB spectral standard with a reddening E(B-V) close to 1.0. The reference star HD 164353 (B5Ib, m(v)=3.97, B-V = 0.002) was sampled in 3 exposures of 1 min. The spectral reduction was performed using the specifically coded HERMES pipeline and contains all standard steps in spectral reduction. The wavelength calibration is based on spectra of ThAr and Ne lamps. As we are mostly interested in the broad absorption feature that is centred around 545 nm, we focus further on this spectral region of HD 183143. The spectra are shown in Figure 1 (middle rows) and compared to the 5450 DIB profile as available from a series of digital DIB catalogues (Herbig, 1975; Jenniskens & Desert, 1994; Tuairisg et al., 2000; Galazutdinov et al., 2000) in the upper row.
3.2 McKellar @ DAO Telescope
Fifty-five half-hour spectra were taken with the McKellar Spectrograph and SITe-4 CCD at the DAO 1.2 m telescope, operated by the National Research Council of Canada, over 6 nights between 16 and 23 July 2006 (UT) at a dispersion of 10.1 /mm giving 0.151 /pixel for a resolution 0.3 . The data were processed in a standard fashion using IRAF 111IRAF is distributed by the National Optical Astronomy Observatory, which is operated by the Association of Universities for Research in Astronomy (AURA) under cooperative agreement with the National Science Foundation.. The aggregate spectrum had a signal to noise of about 1200/pixel before correction of telluric lines. Removal of the quite weak telluric features was performed conventionally with spectra (S/N 1600) of the A0 V star zeta Aql (HD 177724) as the template.
Rigel, an unreddened comparison star with a B8 Ia spectral type very similar to the B7 Ia of HD 183143, was also observed in order to identify photospheric lines which contaminate the interstellar features observed in the latter star. The sharp line at approximately 5454Å arises from S II and was removed from the spectrum of HD 183143 by simply fitting a Voigt profile to the line and subtracting this from the original spectrum. The final “deblended” spectrum is plotted as a comparison in Fig. 1 (lower panel, middle spectrum).
4 Results
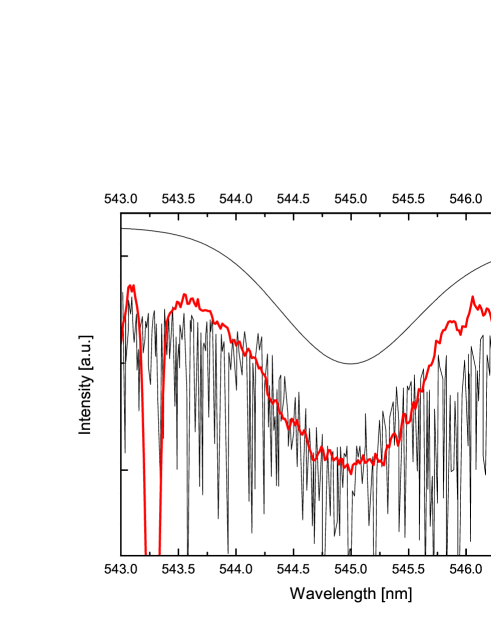
In Fig. 2 several spectra in the 543-547 nm region are compared. The top spectrum is the digital DIB spectrum of the 5450 DIB (Herbig, 1975; Jenniskens & Desert, 1994; Tuairisg et al., 2000; Galazutdinov et al., 2000). The spectrum in the middle is a zoom in on the deblended McKellar spectrum as shown in Fig. 1. The bottom spectrum is the laboratory spectrum recorded in direct absorption through an expanding 1 C2H2/He plasma. The similarity between the three spectra is striking.
This wavelength region was initially scanned to search for the 1u – X1g+ electronic origin band spectrum of the linear carbon chain radical C7 (following the C DIB discussion) that was located in matrix isolation experiments around 542.3 nm. The laboratory spectrum, shown in Fig. 2, consists of many narrow lines that are due to small acetylene fragments (typically C2 and CH) that get weaker when the distance from the nozzle orifice to the optical axis is increased, but there is clearly a broad feature lying underneath. As this band shifts by 1.5 nm to the red upon C2D2 precursor substitution, it initially was neglected, as for C7 both C2H2 and C2D2 should result in an identical spectrum. The shift is illustrated in Fig. 3. In addition, the deuterated spectrum appears to be somewhat stronger. Despite this negative result for C7 the profile hiding under the narrow lines in the C2H2 precursor experiment perfectly matches the 5450 DIB as available from the DIB databases, reason why additional observations were performed.

5 Discussion
There is little discussion possible about the coincidence between the recorded laboratory spectrum and the 5450 DIB. Both bands have a central peak position of 545 nm and a FWHM of 1.03 (0.1) nm (laboratory spectrum) and 0.953 nm (observational spectrum) (Tuairisg et al., 2000). The uncertainty in the first value is due to the overlap of the many individual transitions that prohibits a clear view on the broad feature. The question is more whether this actually represents a DIB match and for this complementary information is needed. Additional laboratory work has been performed, where it should be noted that scans as shown in Figs. 2 and 3 typically last 45 minutes to an hour, in order to achieve the required sensitivity and to cover a frequency domain large enough to discriminate band profile and base line, i.e. fast optimizations are not possible. The laboratory band does not show any structure that can be related to unresolved P, Q and R-branches. With 1.03 (0.1) nm the band is also much broader than the unresolved rotational profile of a larger carbon chain radical. For comparison, at 15 K, the band profile of the linear C6H radical (at 525 nm) is about five times narrower (Linnartz et al., 1999). It should also be noted that such a broad feature actually represents a large absorption compared to many of the sharper DIBs. Changing the experimental settings to vary the final temperature in the expansion by measuring close ( 50 K ′warm′) and far ( 10 K ′cold′) downstream, does not substantially change the FWHM of the spectral contour. As the narrow overlapping transitions have FWHMs close to the laser bandwidth, experimental broadening artifacts such as residual Doppler broadening in the expansion or amplified spontaneous emission, can be excluded. It is clear that the band profile is due to a temperature independent and carrier specific broadening effect, presumably life time broadening. The observed bandwidth of 1.0 nm ( 35 cm-1 around 545 nm) corresponds to a lifetime of roughly 0.15 ps. The bandwidth profile does not allow concluding on the nature of the laboratory carrier. The carrier must be a transient species (a molecular radical, a cation or anion, a weakly bound radical complex, possibly charged, or a vibrationally or electronically excited species) as no comparable spectra are recorded without plasma (i.e. with a regular C2H2/He expansion). The use of a C2D2/He expansion results in a red–shifted spectrum (Fig. 3) and from this it can be concluded that the laboratory carrier must contain both carbon and hydrogen. In order to check whether there are equivalent H-atoms in this carrier a C2H2/C2D2 1:1 mixture in He has been used as an expansion gas, but this only results in a very broad absorption feature covering the whole region between results obtained from pure C2H2 and pure C2D2 expansions. It is not possible, as demonstrated for HC6H+ or HC7H (Sinclair et al., 1999; Ball et al., 2000a; Khoroshev et al., 2004), to conclude on the actual number of equivalent H-atoms in the carrier by determining the number of bands that shows up. Also the use of another precursor (e.g. allene) did not provide conclusive information.
Additional experiments have been performed. The 543-545 nm region
has been scanned using a two-photon REMPI-TOF experiment with the
aim to determine the mass of the carrier (Pino et al., 2001). No
spectrum could be recorded, which may be related to the short
lifetime of the excited state or with the fact that the carrier
is an ion. Ions are indeed formed in this planar plasma source
(Witkowicz et al., 2004). Both smaller and larger species have
been observed, with optimum production rates depending, among
other things, on the backing pressure. The production of larger species is
generally more critical, e.g. higher backing pressures are needed
but this also may destabilize the plasma which is unfortunate,
particularly during long scan procedures. More complex species
are generally found further downstream, but in this specific case
we did not observe large differences as function of the distance
from the laser beam to the nozzle orifice. This is the typical
behaviour for a smaller constituent in the gas expansion. We have
tried to study systematically the voltage dependence of the signal;
for a positive ion an increase in voltage should go along with a
decrease in signal for distances further downstream, as the jaws
carry a negative voltage. For anions it is the opposite, but 10 years
of experience with this source have shown that negative ions are rather
hard to produce. Again, the changes we recorded were small and did
not allow drawing hard conclusions. Following condition 2 mentioned
in the introduction, we have also searched in other wavelength regions
blue shifted by values typical for an excited C–C, CC, CC
or CH stretch in the upper electronic state. Such excited bands
have not been observed here, but it should be noted that these
bands can be intrinsically weak.
In summary, we are left with a laboratory spectrum that coincides
both in band maximum and band width with a known DIB band at 545 nm.
Our measurements show that the absorption spectrum of a transient
molecule containing hydrogen and carbon reproduces the astronomical
spectrum. The profile can be explained with life time broadening
and this is consistent with the observation that the laboratory
and astronomical spectrum are identical, i.e. without temperature
constraints. In addition, it explains why the large bandwidth of
this DIB does not vary along different lines of sight. The large
effective absorption also may be indicative for an abundant carrier.
The exact carrier, as such, remains an open question.
The present result, however, may be useful to stimulate upcoming DIB work.
Acknowledgements.
The results presented here bridge a period of 10 years. The cavity ring-down measurements were performed in the Institute for Physical Chemistry (Department of Chemistry, University of Basel) with support of the Swiss National Science Foundation and the analysis follows recent observations and a collaboration within the framework of the FP6 research training network The Molecular Universe. Additional financial support of NOVA is gratefully acknowledged.References
- A. G. G. M. Tielens & T. P. Snow (1995) A. G. G. M. Tielens & T. P. Snow, ed. 1995, Astrophysics and Space Science Library, Vol. 202, The diffuse interstellar bands, ed. A. G. G. M. Tielens & T. P. Snow
- Araki et al. (2004) Araki, M., Linnartz, H., Kolek, P., et al. 2004, ApJ, 616, 1301
- Ball et al. (2000a) Ball, C. D., McCarthy, M. C., & Thaddeus, P. 2000a, J. Chem. Phys., 112, 10149
- Ball et al. (2000b) Ball, C. D., McCarthy, M. C., & Thaddeus, P. 2000b, ApJ, 529, L61
- Bréchignac & Pino (1999) Bréchignac, P. & Pino, T. 1999, A&A, 343, L49
- Cossart-Magos & Leach (1990) Cossart-Magos, C. & Leach, S. 1990, A&A, 233, 559
- Foing & Ehrenfreund (1994) Foing, B. H. & Ehrenfreund, P. 1994, Nature, 369, 296
- Galazutdinov et al. (2000) Galazutdinov, G. A., Musaev, F. A., Krełowski, J., & Walker, G. A. H. 2000, PASP, 112, 648
- Herbig (1975) Herbig, G. H. 1975, ApJ, 196, 129
- Jenniskens & Desert (1994) Jenniskens, P. & Desert, F. 1994, A&AS, 106, 39
- Jochnowitz & Maier (2008) Jochnowitz, E. B. & Maier, J. P. 2008, Molecular Physics, 106, 2093
- Khoroshev et al. (2004) Khoroshev, D., Araki, M., Kolek, P., et al. 2004, J. Molec. Spectrosc., 227, 81
- Kirkwood et al. (1998) Kirkwood, D. A., Linnartz, H., Grutter, M., et al. 1998, in Chemistry and Physics of Molecules and Grains in Space. Faraday Discussions No. 109, 109–+
- Kroto & Jura (1992) Kroto, H. W. & Jura, M. 1992, A&A, 263, 275
- Linnartz et al. (1998) Linnartz, H., Motylewski, T., & Maier, J. P. 1998, J. Chem. Phys., 109, 3819
- Linnartz et al. (1999) Linnartz, H., Motylewski, T., Vaizert, O., et al. 1999, J. Molec. Spectrosc., 197, 1
- Maier et al. (2001) Maier, J. P., Lakin, N. M., Walker, G. A. H., & Bohlender, D. A. 2001, ApJ, 553, 267
- McCall et al. (2001) McCall, B. J., Thorburn, J., Hobbs, L. M., Oka, T., & York, D. G. 2001, ApJ, 559, L49
- Motylewski & Linnartz (1999) Motylewski, T. & Linnartz, H. 1999, Rev. Sci. Instr., 70, 1305
- Motylewski et al. (2000) Motylewski, T., Linnartz, H., Vaizert, O., et al. 2000, ApJ, 531, 312
- Pino et al. (2001) Pino, T., Ding, H., Güthe, F., & Maier, J. P. 2001, J. Chem. Phys., 114, 2208
- Raskin & Van Winckel (2008) Raskin, G. & Van Winckel, H. 2008, in Society of Photo-Optical Instrumentation Engineers (SPIE) Conference Series, Vol. 7014, Society of Photo-Optical Instrumentation Engineers (SPIE) Conference Series
- Ruiterkamp et al. (2002) Ruiterkamp, R., Halasinski, T., Salama, F., et al. 2002, A&A, 390, 1153
- Salama et al. (1996) Salama, F., Bakes, E. L. O., Allamandola, L. J., & Tielens, A. G. G. M. 1996, ApJ, 458, 621
- Salama et al. (1999) Salama, F., Galazutdinov, G. A., Krełowski, J., Allamandola, L. J., & Musaev, F. A. 1999, ApJ, 526, 265
- Sinclair et al. (1999) Sinclair, W. E., Pfluger, D., Linnartz, H., & Maier, J. P. 1999, J. Chem. Phys., 110, 296
- Sorokin et al. (1998) Sorokin, P. P., Glownia, J. H., & Ubachs, W. 1998, in Chemistry and Physics of Molecules and Grains in Space. Faraday Discussions No. 109, 137–+
- Thaddeus & McCarthy (2001) Thaddeus, P. & McCarthy, M. C. 2001, Spectrochimica Acta, 57, 757
- Tuairisg et al. (2000) Tuairisg, S. Ó., Cami, J., Foing, B. H., Sonnentrucker, P., & Ehrenfreund, P. 2000, A&AS, 142, 225
- Tulej et al. (1998) Tulej, M., Kirkwood, D. A., Pachkov, M., & Maier, J. P. 1998, ApJ, 506, L69
- Witkowicz et al. (2004) Witkowicz, E., Linnartz, H., de Lange, C., et al. 2004, Int. J. Mass Spectrom., 232, 25