On the physical properties of 6–8 galaxies
Abstract
Aims. We analyse the spectral energy distributions (SEDs) of the most distant galaxies discovered with the Hubble Space telescope and from the COSMOS survey and determine their physical properties, such as stellar age and mass, dust attenuation, and star-formation rate.
Methods. We use our SED fitting tool including the effects of nebular emission to analyse three samples of 6–8 galaxies with observed magnitudes 23 to 29. Our models cover a wide parameter space.
Results. We find that the physical parameters of most galaxies cover a wide range of acceptable values. Stellar ages, in particular, are not strongly constrained, even for objects detected longward of the Balmer break. As already pointed out earlier, the effects of nebular lines significantly affect the age determinations of star-forming galaxies at 6–8. We find no need for stellar populations with extreme metallicities or other non-standard assumptions (IMF, escape fraction) to explain the observed properties of faint z-dropout galaxies. Albeit with large uncertainties, our fit results show indications of dust attenuation in some of the 6–8 galaxies, which have best-fit values of up to . Furthermore, we find a possible trend of increasing dust attenuation with galaxy mass, and a relatively large scatter in specific star-formation rates, SFR/.
Conclusions. The physical parameters of very high- galaxies may be more uncertain than indicated by previous studies. Dust attenuation seems also to be present in some 6–8 galaxies, and may be correlated with galaxy mass, as is also the case for SFR.
Key Words.:
Galaxies: starburst – Galaxies: ISM – Galaxies: high-redshift – Ultraviolet: galaxies1 Introduction
Finding and studying the most distant galaxies formed during the epoch of reionisation, more recent than 1 Gyr after the Big Bang, is one of the challenges of contemporary observational astrophysics. Over the past few years considerable progress has been made in this field, pushing the observable limits beyond redshift 6 with the use of ground-based facilities and satellites.
A variety of observational programs have tried to locate galaxies using different observational techniques, mostly involving either searches for Ly emission through narrow-band filters or searches using the Lyman break technique – also called the dropout technique. These have been performed either in blank fields or in fields with galaxy clusters, which act as strong gravitational lenses, targetting different depths and survey areas. The objects found in this way are line emitters or Lyman break galaxies (LBGs).
Although Ly emitters are among the most distant galaxies with spectroscopically confirmed redshifts (see Iye et al. 2006; Ota et al. 2008), few have been found at (see e.g. Cuby et al. 2007; Stark et al. 2007b; Willis et al. 2008; Hibon et al. 2009; Sobral et al. 2009). Furthermore, because of their faintness the photometry available is inadequate in terms of depth to allow studies of their stellar populations.
Surveys using strong gravitational lensing were among the first to pave the way in the of study galaxies (see Kneib et al. 2004; Pelló et al. 2004; Egami et al. 2005; Richard et al. 2006, 2008; Bradley et al. 2008; Zheng et al. 2009). Ultra-deep fields with the Hubble Space Telescope (HST) including near-IR observations with NICMOS have uncovered a handful of candidates in blank fields (Bouwens et al. 2004; Labbé et al. 2006; Henry et al. 2008). These pilot studies also showed that some of the galaxies could be detected at 3.6 and 4.5 m with Spitzer, thus probing the rest-frame optical emission from these objects (Egami et al. 2005; Labbé et al. 2006).
Since then, surveys of z-dropout galaxies (targeting objects) have been extended to cover larger areas, primarily with ground-based instruments (Mannucci et al. 2007; Capak et al. 2009; Castellano et al. 2009; Hickey et al. 2009; Ouchi et al. 2009; Wilkins et al. 2009), but also with HST (Henry et al. 2007, 2009; Gonzalez et al. 2009). In most cases, however, only a few near-IR photometric bands are available, providing so far information only on source counts and luminosity functions, but precluding more detailed studies of the physical properties of the sources. Notable exceptions are the work of Capak et al. (2009), who present three bright () galaxy candidates from the COSMOS 2 square degree field, and the study of Gonzalez et al. (2009) finding 11 fainter (J110W 26.–27.5) galaxies in the two GOODS fields. Both studies benefit from a coverage including optical, near-IR, and Spitzer bands.
Observations taken recently with the newly installed WFC3 camera on-board HST have just been released, resulting in publications from four independent groups identifying faint (J125 27–29) galaxies, based on the combination of the deepest available ACS/HST and WFC3 data (Oesch et al. 2010; Bouwens et al. 2010a; Bunker et al. 2009; McLure et al. 2009; Yan et al. 2009). While these objects are too faint to be detected at the current limits of the deepest Spitzer images, a stack of 14 z-dropout galaxies from Oesch et al. (2010) shows tentative (5.4 and 2.6 ) detections at 3.6 and 4.5 m, respectively (Labbé et al. 2010).
Given these detected galaxies (or candidates) with available multi-band photometry, it is of interest to determine their physical properties such as stellar ages, reddening, stellar masses, star-formation rates, and related properties such as their formation redshift, specific star-formation rate, and others. Several studies have addressed these questions using different modeling tools (see Bouwens et al. 2010b; Capak et al. 2009; Gonzalez et al. 2009; Labbé et al. 2010). However, some consider only special types of star-formation histories (constant star-formation rate), or zero dust extinction, and except for Capak et al. (2009) none of them accounts for the effects of nebular emission (lines and continua) present in star-forming galaxies. Neglecting the latter may in particular lead to systematically older stellar ages, to lower dust extinction, and differences in stellar masses, as shown by Schaerer & de Barros (2009) for galaxies. Furthermore, the uncertainties in the derived physical parameters are not always determined or addressed. Last, but not least, no “uniform” study of the entire data sets of galaxies has yet been undertaken using the same methodology and modeling tools. For all these reasons, we present a critical analysis of the physical properties of the majority of 6–8 galaxies that have been discovered recently.
Nebular emission can significantly alter the physical parameters of distant star-forming galaxies derived from broad-band photometry. The main reason for this is that the emission lines, which are invariably present in the H ii regions accompanying massive star-formation, strengthen with redshift, because their observed equivalent width scales with . Since the main emission lines are in the optical (rest-frame) domain and few are in the UV, their presence can mimick a Balmer break in absorption, a signature usually interpreted as an age indicator for stellar populations (Kauffmann et al. 2003; Wiklind et al. 2008). This effect of emission lines, and to a lesser extent also nebular continuum emission, can lead to degeneracies in broad-band SED fits of high- galaxies as e.g., shown by Zackrisson et al. (2008) and Schaerer & de Barros (2009). The presence of both nebular lines and continua and their contribution to broad-band photometry is well known in nearby star-forming galaxies, such as very metal-poor objects (e.g., I Zw 18, SBS 0335-052, and others), blue compact dwarf galaxies and related objects (cf. Izotov et al. 1997; Papaderos et al. 2002; Pustilnik et al. 2004; Papaderos et al. 2006). The strongest evidence of a significant contribution of the nebular continuum in some nearby star-forming galaxies is the observational finding of a Balmer jump in emission (see Guseva et al. 2007). For these reasons, it is important to include nebular emission in SED fits of distant starbursts and to examine their effect on the derived physical properties.
In the present paper, we analyse samples of 6–8 galaxies discovered recently. The data are compiled from the literature, including the brightest objects from the sample of Capak et al. (2009), the “intermediate” sample of Gonzalez et al. (2009), and the faintest z-dropouts recently found with the WFC3 camera. Applying our up-to-date spectral energy distribution (SED) fitting tool, we search in particular for possible trends in the physical parameters of galaxies over a range of 6 magnitudes, i.e., a range of 250 in flux. First results from our analysis are presented here. A more detailed and extensive study of the properties of z-dropout galaxies and comparisons with objects at lower redshift will be published elsewhere.
In Sect. 2, we summarise the galaxy sample and the SED fitting method. In Sect. 3, we present our results for the three subsamples. The overall results of the whole LBG sample and implications are discussed in Sect. 4, where we also compare our results to those for LBGs at lower redshift. Our main conclusions are discussed and summarised in Sect. 5. We assume a flat CDM cosmology with km s-1 Mpc-1, , and . All magnitudes are given in the AB system.
2 Observational data and modelling tools
2.1 galaxy samples
To determine the physical properties of galaxies and their uncertainties, we chose the following three samples:
-
•
Two of the three bright () z dropout galaxies from the COSMOS survey, discovered by Capak et al. (2009). We refer to these as the “bright sample”.
-
•
The 11 z850LP dropout objects identified by Gonzalez et al. (2009) from the HST ACS and NICMOS data in the GOODS and HUDF fields, plus their mean SED. These objects typically have J110W 26.–27.5, and are referred to as the “intermediate sample”.
-
•
The “faint sample”, including 15 of the 16 z850LP dropout candidates found by Oesch et al. (2010) in the HUDF using the newly installed WFC3 camera of HST, and the 15 additional objects identified as 6–9 candidates by McLure et al. (2009). The photometry is taken from McLure et al. (2009). They typically span a range from J125 27 to 29. We also include the stacked SED obtained by Labbé et al. (2010) for 14 objects from the Oesch et al. (2010) sample, which shows tentative (5.4 and 2.6 ) detections in the 3.6 and 4.5 m bands of Spitzer.
The following photometric data/filters was used for the samples: (1) , from SuprimeCam on SUBARU, , , from WIRCAM on the CFHT, and channels 1-4 of IRAC/Spitzer for the Capak et al. (2009) sample. Since object 2 is detected in the band and at 24 m, and its SED indicates a low redshift (, Capak et al. 2009), we exclude it from our analysis. (2) B435, V606, i776, z850LP filters of ACS/HST, J110W and H160W of NICMOS/HST, , and channels 1-2 of IRAC/Spitzer for the Gonzalez et al. (2009) objects. We adopted the properties of the filter of ISAAC/VLT for all objects. (3) B435, V606, i776, z850LP filters of ACS/HST, Y105, J125, H160 filters of WFC3/HST, and channels 1-2 from IRAC/Spitzer for the faint sample. The original photometry from the respective papers was adopted.
Except for the 3 objects in the bright sample for which one spectral line was found for each of them, no spectroscopic redshifts are available for these objects. We therefore treat the redshift as a free parameter for all objects.
2.2 SED fitting tool
To analyse the broad-band photometry, we use a modified version of the Hyperz photometric redshift code of Bolzonella et al. (2000) described in Schaerer & de Barros (2009). The main improvement with respect to both earlier versions and other SED fitting codes is the treatment of nebular emission (lines and continua), which can have a significant impact on the broad-band photometry of high redshift galaxies and hence their derived properties (see Schaerer & de Barros 2009). We use a large set of spectral templates (primarily the GALAXEV synthesis models of Bruzual & Charlot 2003), covering different metallicities and a wide range of star formation (SF) histories (bursts, exponentially decreasing, or constant SF), and we add the effects of nebular emission. Models with a more sophisticated description of stellar populations, chemical evolution, dust evolution, and different geometries (see e.g., Schurer et al. 2009) are not used, given the small number of observational constraints.
We adopt a Salpeter IMF from 0.1 to 100 M⊙, and we accurately consider the returned ISM mass from stars. Nebular emission from continuum processes and lines is added to the predicted spectra from the GALAXEV models, as described in Schaerer & de Barros (2009), proportional to the Lyman continuum photon production. The relative line intensities of He and metals are taken from Anders & Fritze-v. Alvensleben (2003), including galaxies grouped into three metallicity intervals covering 1/50 Z⊙ to Z⊙. Hydrogen lines from the Lyman to the Brackett series are included with relative intensities given by case B. Our treatment therefore covers the main emission lines of H, He, C, N, O, and S from the UV (Ly) to 2 m (rest-frame), necessary for fitting the SED of galaxies at up to 10 m (IRAC channel 4).
The free parameters of our SED fits are: the redshift , the metallicity (of stars and gas), the SF history described by the timescale (where the SF rate is SFR ), the age defined since the onset of star-formation, the extinction described here by the Calzetti law (Calzetti et al. 2000), and whether or not nebular emission is included. In some cases, we exclude the Ly line from the synthetic spectra, since this line may be attenuated by radiation transfer processes inside the galaxy or by the intervening intergalactic medium.
Here we consider in steps of 0.1, three metallicities 1, 1/5, 1/20, 5, 7, 10, 30, 50, 70, 100, 300, 500, 700, and 1000 Myr in addition to bursts and SFR=constant, ages up to the Hubble time, and 0–2 (or 4) mag in steps of 0.2. In general, the combination of all parameters leads to models for each object.
Non-detections are included in the SED fit with Hyperz by setting the flux in the corresponding filter to zero, and the error to the upper limit. For all the above combinations we compute the and the scaling factor of the template, which provides information about the SFR and , from the fit to the observed SED. Minimisation of over the entire parameter space yields the best-fit parameters.
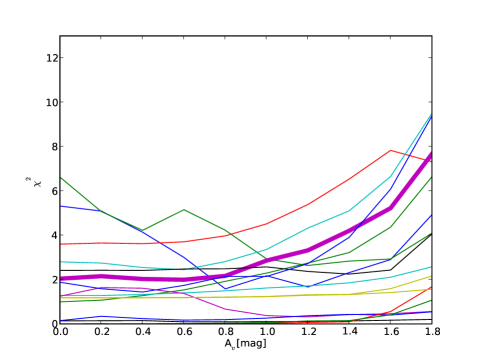
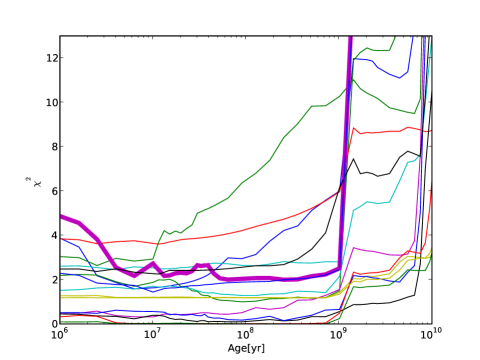
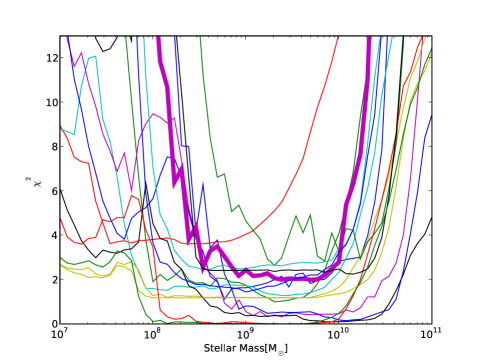
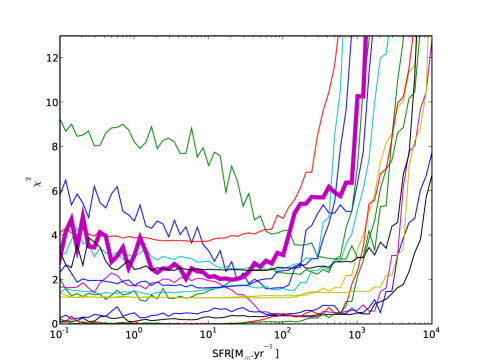
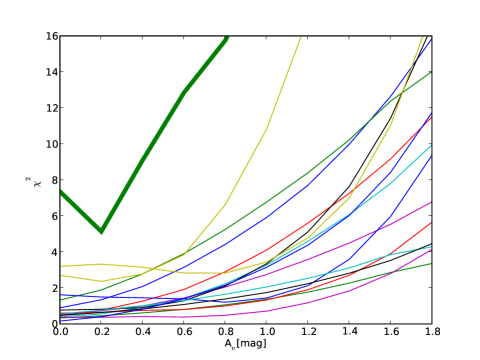
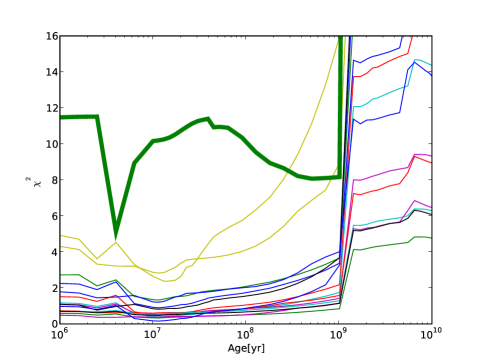
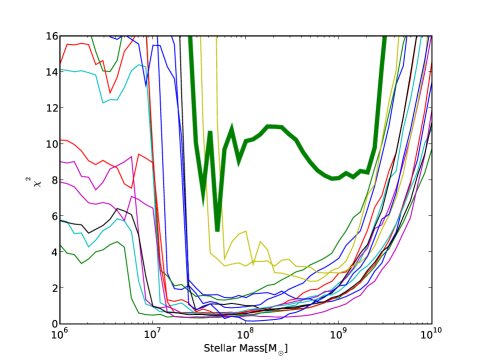
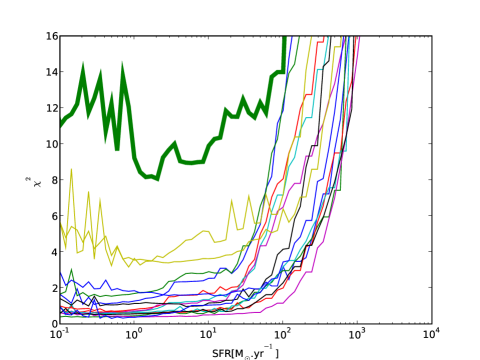
To illustrate the uncertainties in the resulting fit parameters, we examine the distribution of across the entire parameter space. To determine confidence intervals from the distribution, the degree of freedom must be known to determine the values corresponding to different confidence levels, or Monte Carlo simulations must be carried out. In any case, the photometric uncertainties, typically taken from SExtractor, would also need to be examined critically, since these may be underestimated, and since errors in the relative photometric calibration between different telescopes/instruments, which affect SED fits, are usually not taken into account. We chose to plot the 1D distribution for the parameter of interest, marginalised over all other parameters, so that the reader is able to appreciate these distributions. Illustrative confidence intervals are determined by assuming , the value for one degree of freedom. This should provide a lower limit to the true uncertainties. More quantitative estimates of the uncertainties will be given in a subsequent publication, which will include the analysis of a larger sample of LBGs at different redshift.
3 Results
3.1 Photometric redshifts: overview of the full sample
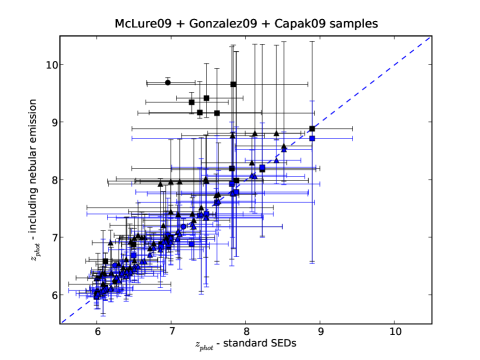
The photometric redshifts of the objects from the three subsamples were discussed by Capak et al. (2009); Gonzalez et al. (2009), and McLure et al. (2009). Since these authors use different spectral templates and methods, it is useful to examine briefly the redshifts we derive from our SED fits, and their dependence om nebular emission. Figure 1 shows the best-fit model values for using either standard templates (i.e., neglecting nebular emission), or including nebular emission (lines and continua), and the latter but neglecting the contribution from Ly. Clearly, the contribution of Ly can lead to higher photometric redshifts, since it can compensate for the drop of the flux shortward of Ly, and hence lead to drop-out at higher . With the prescription used for Ly in our models (i.e. maximum emission according to Case B recombination) this typically leads to . In some cases, e.g., for 4 objects from the Gonzalez et al. (2009) sample, the shift is larger. The reason for this large shift is the available filter set, which include z850LP and J110W for this sample, whereas Y105, a filter that is intermediate between z850LP and J125, is available for the WFC3/HST (faint) subsample. By including the nebular continuum and all spectral lines except Ly (blue symbols) one recovers essentially the same photometric redshifts as with standard templates. This is expected, since the Lyman break — the main feature determining — can only be strongly affected by Ly.
We compared our photometric redshifts against objects with known spectroscopic redshifts, where possible. For a sample of , , and -dropouts from the GOODS fields, we find good agreement for the majority of objects using the GOODS-MUSIC photometry (Santini et al. 2009). For this sample, spanning objects with 4–6, our results are essentially the same with/without nebular emission, and with/without Ly. Since Ly emission may be weaker than predicted by the models, because of the multiple scattering in the presence of dust (Verhamme et al. 2008) and/or because of the intervening IGM, we subsequently consider models including all nebular lines except Ly. It must, however, be noted that for objects with strong Ly emission the true redshift may be higher than obtained from photometric codes neglecting this line.
3.2 Bright sample
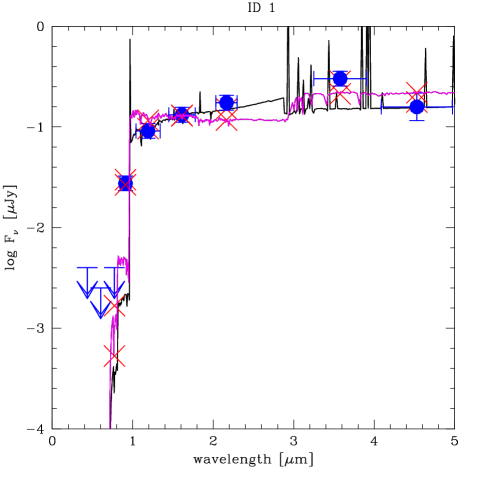
Our SED fits for these objects yield results (redshift probability distributions and physical parameters) broadly in agreement with Capak et al. (2009), which is unsurprising since these authors also include nebular lines in their analysis using the Le Phare code. Since we include SEDs spanning metallicities from Z⊙ to 1/50 Z⊙ (in contrast to Z⊙ only), we obtain a wider range of acceptable fit parameters.
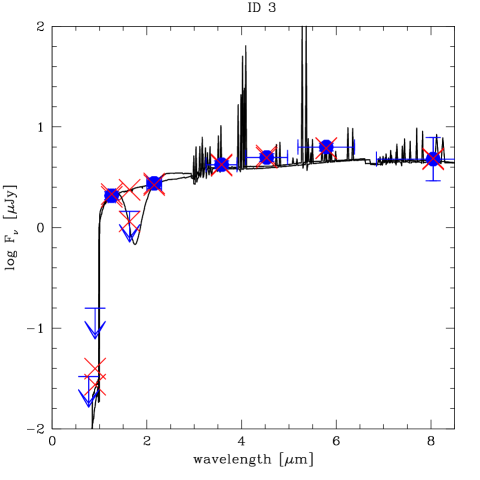
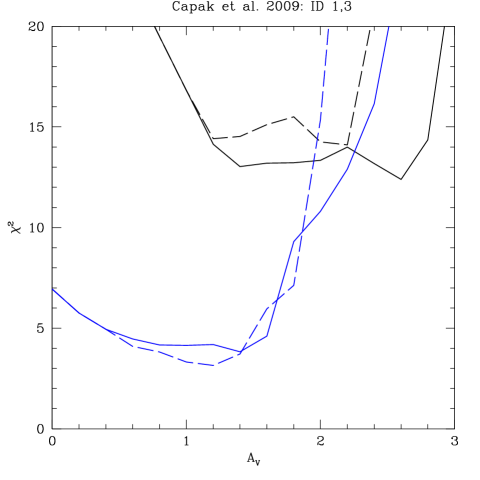
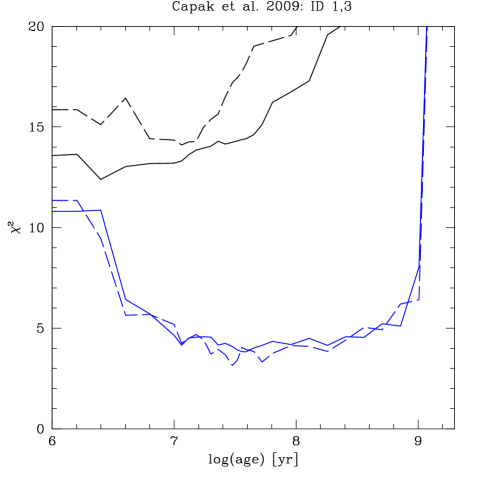
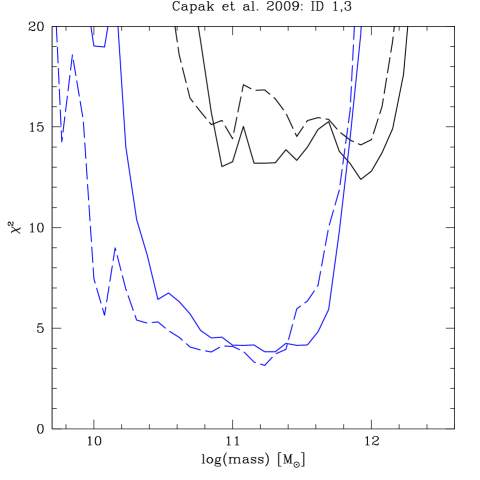
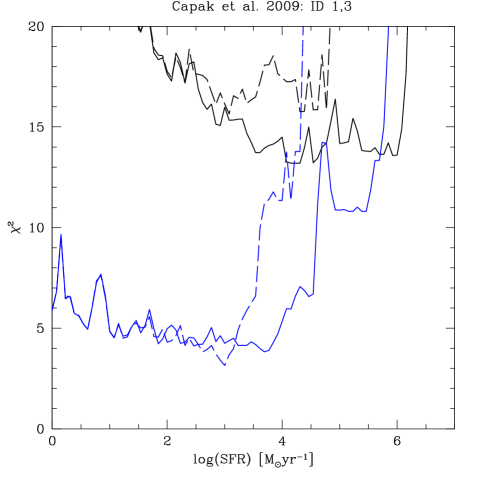
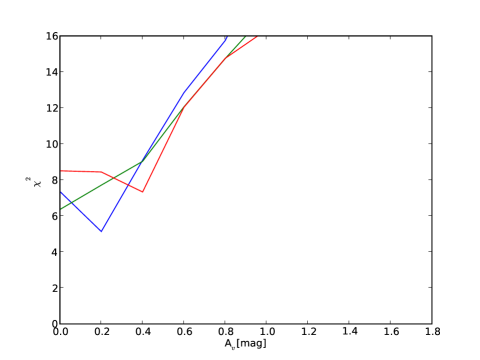
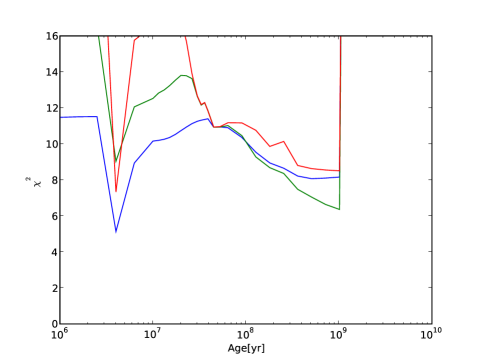
For example, we find evidence of significant reddening in object 1, with 1–2.6, in agreement with the best-fit value of given by Capak et al. (2009). The corresponding distribution is shown in Fig. 13. The situation is similar for object 3, although for more moderate extinction ( 0.6–1.6).
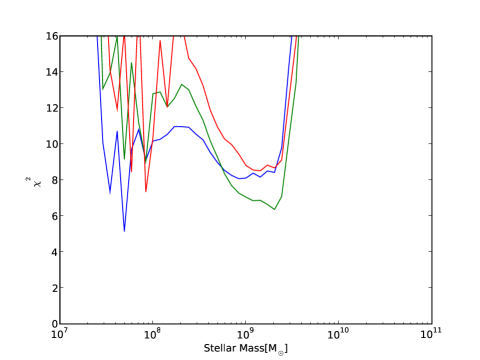
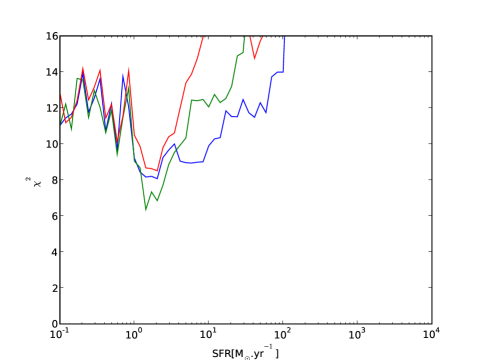
The corresponding range of ages, SFRs, and stellar masses for both objects, obtained with and without nebular emission, are illustrated in Figs. 14 to 16. Approximately (within 1-2.3) object number 1 (3) has thee best-fit model parameters 0–30 (10-200) Myr, 10.8–12. (10.6–11.6) M⊙, and SFR 100–106 (10–104) M⊙ yr-1. We note that a very large range in SFR is obtained from the SED fits since both the SF history and the extinction are kept free. The high SFR tail is related to solutions with high extinction and very young populations, where the UV output per unit SFR remains below the equilibrium value reached after typically 100 Myr. For comparison, using the standard SFR(UV) calibration of Kennicutt (1998) and assuming , one obtains SFR 240 M⊙ yr-1 without extinction correction for object 1, and SFR 6500 M⊙ yr-1 adopting and Calzetti’s attenuation law.
As noted by Capak et al. (2009), object 3 is not detected in H, possibly indicating a dip in the flux between J and K (see Fig. 2). If real, this dip could be explained by the 2175 Å dust absorption feature, as also mentioned by Capak et al. (2009). Using the Galactic extinction law from Seaton (1979) provides excellent fits with , as shown in Fig. 2. The possible indication for a 2175 Å dust absorption feature at such a high redshift is in contrast to evidence so far, suggesting the absence of this feature (see e.g., Maiolino et al. 2004).
3.3 Intermediate sample
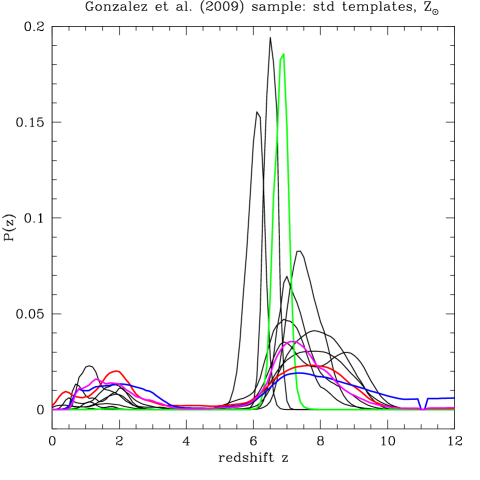
The redshift probability distribution of the objects from the Gonzalez et al. (2009) sample is shown in Fig. 3. All objects have a best-fit photometric redshift at high ( 6–6.5). However, 6 of the 11 objects (ID 4, 5, 6, 7, 8, 10) also have an acceptable fit at low redshift ( 1–2) with a probability comparable to the high- solution; the most unreliable objects being ID 6, 7, and 8. The 3 brightest objects in J110W (ID 1, 9, 11) favour clearly high- solutions, since they provide the largest “leverage” on the Lyman-break between J110W and the optical data.
Figure 4 shows an example of an object with both acceptable low- or high-redshift solutions of similar quality. The observed SED is reproduced well by a low extinction, young, starburst at high- ( here) or by a 4.5 Gyr old stellar populations with at . Reducing the probability of a low- interloper would obviously be possible with deeper optical photometry, which would place tighter constraints on the Lyman break. Deep K-band data (not available for this object) or other constraints on the shape of the SED between 2 and 3.6 m, may allow us to distinguish between the two solutions shown here, and provide stronger constraints on the possible Balmer break – hence the age – of this object.
Object 1 (UDF-640-1417) from Gonzalez et al. (2009) is such an example, benefiting from deeper optical imaging and data, as shown in Fig. 5. The former leads to a well-defined and clearly most probable high- solution at 6.7–6.9. However, here the observed spectral shape between the rest-frame UV and optical range (probed by JHK and 3.6-4.5 m, respectively) may imply a degeneracy between age and extinction. While Gonzalez et al. (2009) fit this SED with a dust-free population of several 100 Myr age (cf. our magenta line), we obtain a tighter fit with models including nebular emission for a young population plus dust reddening (typically 10 Myr, 0.8–1.2). The distribution of for and other parameters are shown in the Appendix (Figs. 17 to 20).
In total, we find three objects (UDF-640-1417, GNS-zD5, HDFN-3654-1216) with best-fit solutions for 0.6–1.2 and relatively young age ( Myr). Incidentally these are the three brightest objects in J110W, which may suggest a trend of extinction with magnitude (cf. below). However, the significance of non-zero extinction is not very high, in particular for GNS-zD5 and HDFN-3654-1216, where the 3.6 m flux is affected by a bright neighbouring source (cf. Gonzalez et al. 2009).
Considering the entire parameter space for the whole sample (cf. Figs. 17 to 20), we find that age and dust extinction of most objects are not well constrained, and could reach from few Myr up to the age of the universe at that redshift, and from 0 to mag for some objects. In particular, the data does not allow us to conclude that these galaxies show no sign of dust extinction. Furthermore, their age and hence formation redshift remains poorly constrained. The same is also true for the mean SED from Gonzalez et al. (2009), which yields results compatible with those of the individual objects, as expected (see thick line in the plots). For comparison, Gonzalez et al. (2009) find fairly old best-fit stellar-mass-weighted ages Myr111With their definition, one has for SFR=const assumed by these authors, where is our definition of the stellar age. typically. Both the assumption of SFR=const and lead to the highest age, since both effects minimise the ratio of the rest-frame visible/UV light, the main age constraint.
Allowing for wide range of SF histories, variable extinction, and for nebular emission yields, on average, a broader age range (between a few Myr and up to the maximum age), room for extinction up to , stellar masses from to M⊙, and SFR 2–100 M⊙ yr-1. In other words, the properties of the galaxies from this sample of intermediate brightness (J110W 26–28), are clearly more uncertain than indicated by Gonzalez et al. (2009), who consider only a restricted range of the parameter space.
3.4 Faint sample
Using the first UDF observations taken with the newly installed WFC3 camera onboard HST, four studies have identified 11 to 20 galaxy candidates (or z850LP drop-outs) (Oesch et al. 2010; Bunker et al. 2009; McLure et al. 2009; Yan et al. 2009). What can be said about their physical properties?
3.4.1 Photometric redshifts
McLure et al. (2009) had previously examined the photometric redshifts and uncertainties for their sample, which also covers the majority of galaxies found by the other groups (Oesch et al. 2010; Bunker et al. 2009; Yan et al. 2009). Unsurprisingly, our results using a modified version of the Hyperz code also used by McLure et al. (2009) and a slightly more extended template library, confirm their findings. In particular, for the sample of Oesch et al. (2010) we find that their objects consistently show photometric redshifts with well-defined probability distributions peaking between 6.3 and 7.6. For fainter z-dropouts and Y-dropouts, the photometric redshift becomes far more uncertain, and a significant fraction of the objects could also be low- galaxies. As already pointed out by McLure et al. (2009) and Capak et al. (2009), the depth of the optical imaging becomes the limiting factor for objects that faint in the near-IR.
3.4.2 UV slope
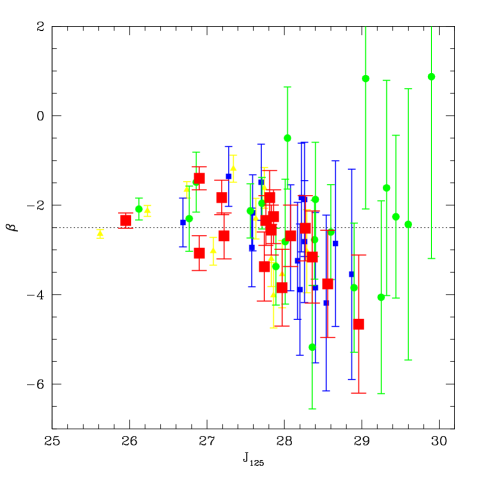
One group pointed out that the fainter of these objects had very blue UV-continuum slopes, , indicative of “non-standard” properties of these galaxies (Bouwens et al. 2010b). Their data, shown as red squares in Fig. 6, exhibits a trend of decreasing (as estimated from their (J125-H160) colour) towards fainter magnitudes. From the very steep slopes (i.e., low values of ) reached in faint objects, Bouwens et al. (2010b) claim that extremely low metallicities and large Lyman continuum escape fractions seem to be required to understand these objects, since “standard” evolutionary synthesis models predict minimum values of for young stellar populations. As the data and the errorbars from different groups plotted in Fig. 6 show, we cannot reach similar conclusions, given the uncertainties in the colour measurement used to determine . For the bulk of the sources, the -slope is compatible within with normal values of or flatter slopes. Furthermore, it is unclear whether the (J125-H160) colour exhibits any systematic trend towards fainter magnitudes. The observations do not exclude different properties such as extremely low metallicities and large Lyman continuum escape fractions for some of the objects at . However, the low significance of these deviations do not justify making assumptions that differ significantly from those commonly adopted for the analysis of lower redshift objects.
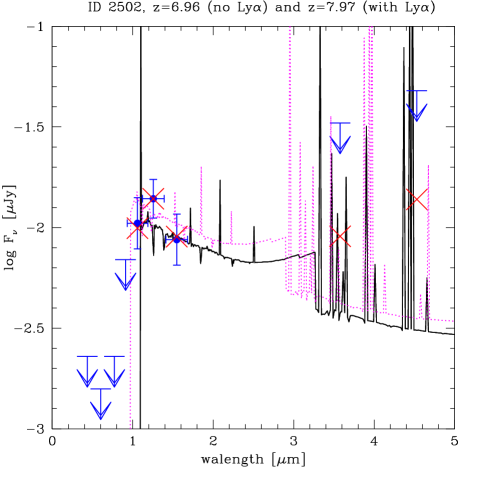
With the WFC3 filters used in this survey, it is possible to generate unusually blue (J125-H160) colours in certain circumstances from spectral templates including nebular emission. Such a case is illustrated in Fig. 7, showing a fit to object 2502 from the McLure et al. (2009) sample. Shown here is a model of a very young stellar population with solar metallicity including lines and nebular continuum emission redshifted to either (dashed, magenta line) or (solid, black line). In the latter case, the strong intrinsic Ly emission (with Å) boosts the flux in both J125 and Y105 since these filters overlap by m. This provides a very blue (J125-H160) colour, and enough flux in Y105 to ensure that this object does not appear as a Y105-drop even at . If at , as implied by SED fits excluding the Ly line (magenta line) or from simple colour-criteria designed to select galaxies (e.g Oesch et al. 2010), the (J125-H160) colour is not affected by Ly. However, this is not necessarily the case for all z-dropout galaxies since strong Ly emission, if present, may mimic a lower redshift (cf. Sect. 3.1). The likelyhood of this situation remains difficult to establish, especially since Ly may be differentially affected by dust, and scattered by the IGM.
3.4.3 Age and reddening
For the 15 objects in common between the Oesch and McLure samples, we find young stellar populations ( Myr) as best-fits, and zero extinction, except for objects 688, 835, and 1092, with 0.2–0.6. However, as for the objects from the intermediate sample, the distribution of is very flat (cf. Figs. 21 to 24), allowing a wide range of extinctions ( 0–1.2), ages of 0 to several 100 Myr, stellar masses from to few times M⊙, and SFRs from 0.1 (or less) to M⊙ yr-1, for most objects in the faint sample. The wide age range, is possible, e.g., since the upper limits at 3.6 and 4.5 m do not provide a strong enough constraint on the optical to UV flux of these faint objects. Given the rapid evolution with time in the mass/light ratio involved here (mostly the UV–optical domain), the uncertainty in the ages translates into a large spread in stellar masses, as show by Fig. 23. The wide range of acceptable SFR values is due to both age and SF history (parametrised here by the e-folding timescale ) being kept free, in contrast e.g., to commonly used SFR(UV) calibrations assuming SFR=constant and ages 100 Myr.
3.4.4 Physical properties from the stacked SED
The individual z-dropout candidates of Oesch et al. (2010) and McLure et al. (2009) are undetected in the deep, available 3.6 and 4.5 m Spitzer images, but Labbé et al. (2010) stacked the images of 14 of the 16 z-dropout galaxies from Oesch et al. (2010), obtaining 5.4 and 2.6 detections in these bands. Fitting the SED of this stack, we find that the physical parameters are more tightly constrained, as the thick line in Figs. 21 to 24 show. Overall our best-fit values (with or without nebular emission) are very similar to those obtained by Labbé et al. (2010), bearing the different definitions of stellar ages and in mind. Furthermore, the values of the physical parameters derived for the majority of the individual objects is compatible with the values determined from the stack.
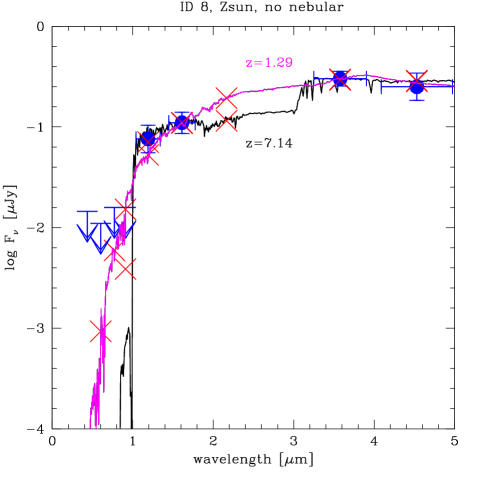
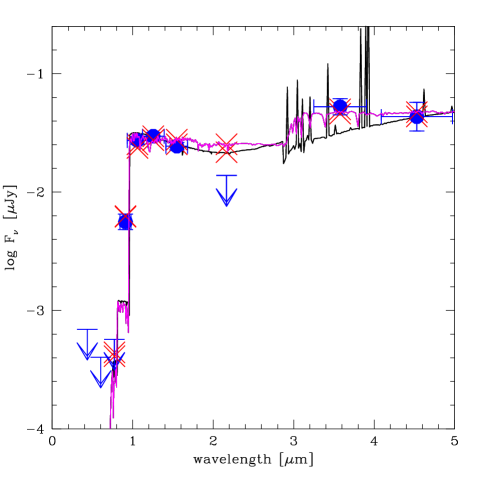
An uncertainty remains, however, in the age and consequently also in the stellar mass determination. We first obtain secondary solutions with 1–2 with young ages ( 4–5 Myr) and a small extinction ( 0.2–0.4) as we consider all metallicities, both with our without nebular emission. Furthermore, if we suppress the Ly line we improve the fit, leading to a best-fit at young ages ( 2–7 Myr). The corresponding distributions illustrating these results are shown in Figs. 25 to 28, and SED fits from these models are shown in Fig. 8. This figure clearly illustrates how an apparent Balmer break can be explained by an old population (here 700 Myr) or by nebular emission from a younger population, as already shown by Schaerer & de Barros (2009). A suppression of the Ly line is justified since Ly may be attenuated by radiation transfer processes inside the galaxy or by the intervening intergalactic medium. In any case, neglecting nebular emission is inconsistent for spectral templates with recent ( Myr) or ongoing star formation. Finally, in comparison with the bright and intermediate samples we may also question why the faintest objects should have the oldest stellar populations, whereas the ages of brighter objects are compatible with a broad range of ages, including young ones.
The uncertainty in the age also translates into an uncertainty in stellar mass. Whereas the estimated average mass is M⊙ for the old population (cf. Labbé et al. 2010), it is more than a factor of 10 lower for young ages (see Fig. 27), since nebular emission contributes partly to the rest-frame optical domain. The SFR is, however, hardly affected by this uncertainty (see Fig. 28), since it is more sensitive to the rest-frame UV light present in both young and old star-forming populations. In consequence, the specific SFR (SFR) could be significantly higher than advocated by Labbé et al. (2010). Before performing spectroscopy for these objects – a currently impossible task – to examine if the 3.6 m filter is truly affected by emission lines as predicted by the model, the present data does not allow us to completely rule out one or the other solution.
4 Discussion
We discuss the effects of varying the model assumptions on the physical parameters derived. We then examine the main derived properties and possible correlations among them for the ensemble of galaxies studied here, and compare any correlations found to those of lower redshift galaxies. Finally, we discuss some implications of our results.
4.1 Effects of varying model assumptions
Varying the model assumptions in broad-band SED fits affects the inferred physical parameters of distant galaxies in ways that have been discussed in several studies, e.g., by Yabe et al. (2009) in quite some detail (cf. also Papovich et al. 2001; Sawicki et al. 2007; Gonzalez et al. 2009, and others). The most relevant assumptions are the star-formation histories, metallicity, the inclusion of dust extinction, and the adopted extinction law. Furthermore, the inclusion of nebular emission and the assumptions made to do so also affect the results as shown here and in (cf. also Schaerer & de Barros 2009; Yabe et al. 2009, and the latter for a discussion of the effect of H).
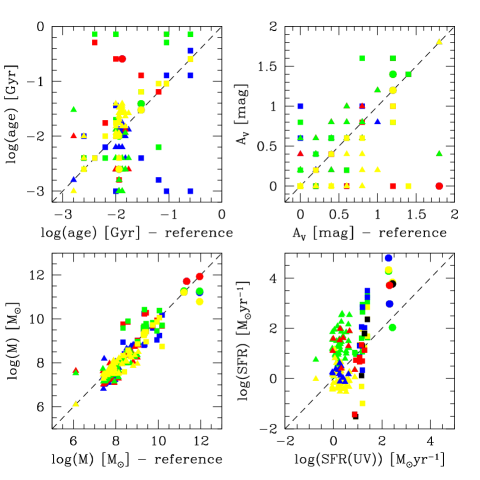
The impact of different model assumptions on the best-fit parameters of our sample is shown in Fig. 9, where we plot the values from our “reference model” (including nebular emission, Ly suppressed, all SF histories, all ages , all extinction values, and all metallicities) on the x-axis, and the same from comparison models on the y-axis. The models we consider here for comparison are: 1) models with Myr (yellow), 2) models with Ly (blue), 3) models without nebular emission (red), and 4) same as 3), but for SFR=constant only (green). SEDs without nebular emission (3) may be taken as an extreme case of models with a very large escape fraction () of ionising radiation from the Lyman continuum, whereas in the other cases we implicitly assume no escape (), maximising thus nebular emission if young massive stars are present. One may theoretically expect an evolution of with redshift, galaxy mass, and other properties, although large differences remain even between simulations (see e.g., Gnedin et al. 2008; Wise & Cen 2009; Razoumov & Sommer-Larsen 2010). Intermediate values of may be included in future models.
Circles, squares, and triangles in Fig. 9 represent objects from the bright, intermediate, and faint samples, respectively. In Figs. 9 to 12, we now include all objects of McLure et al. (2009) in the faint sample, i.e. 15 objects in addition to the 15 of Oesch et al. (2010), to maximise the sample size and because the results with the additional sample do not show noticeable differences. We do not show the effect of fixing metallicity, since it is small compared to the other effects discussed here. We now discuss the dependence of the physical parameters on these models assumptions one-by-one.
4.1.1 Stellar mass
As noted and discussed by Yabe et al. (2009) and others, the stellar mass is the least sensitive parameter to the model assumptions, especially when measurements for the rest frame optical domain are available. This is mainly because it is derived from the absolute scaling of the overall SED, and that the mass-to-light ratio in the optical does not change much with age and star-formation history.
4.1.2 Age
In contrast, age is the most sensitive quantity (cf. Yabe et al. 2009). From Fig. 9 it is clear that models without nebular emission (red and green) yield older ages in most cases, as already discussed above (cf. Schaerer & de Barros 2009). By assuming constant SFR, we also tend to infer older ages, as is well known, but not in all cases (see green symbols). The inclusion (suppression) of Ly can also lead to younger (older) ages, as shown by the blue symbols. This is the case for some objects because of the increase of (cf. Sect. 3.1), which in turn demands a younger age (steeper UV spectrum) to reproduce the same observed slope in the UV. In other words, to some extent there is also a degeneracy between age and redshift 222In addition, there is the well-known age–extinction degeneracy. when Ly is taken into account. Naively one may have expected the opposite, namely that the inclusion of Ly would lead to older age estimates, since for a fixed redshift, the contribution of Ly produces a bluer UV spectrum (cf. Finkelstein et al. 2009). This shows the importance of consistently fitting the physical parameters and redshift using the same spectral templates.
4.1.3 Extinction
Although a spread is obtained in for the different model assumptions, the best-fit model values of correlate reasonably well around our “reference value” for most objects. The greatest differences arise when the SF history is varied – here imposing Myr leads to lower and higher ages (because of the age–extinction degeneracy), as shown by the yellow symbols – and, for the same reason, when nebular lines are omitted, as shown by some outliers with red symbols. The largest differences in stellar mass are found for some objects where nebular emission leads to a strong age reduction and hence a lower M/L ratio.
4.1.4 SFR
The star-formation rate SFR deserves special comment. The value of the current SFR (SFR) obtained from SED fits depends strongly on both SFH and age. Formally, SFR=0 for instantaneous burst models, which are also considered here and in other publications. Furthermore since the UV luminosity emitted per unit SFR varies by order of magnitude within 100 Myr even for constant star formation, the current SFR resulting from SED fits can differ333In general, one has SFRSFR(UV), since stars over a broad age range contribute to the UV output, and since SFR is lower at young ages. from the usual SFR(UV) calibrations by 1 dex or more depending on both SF history and age. For this reason, we compare in Fig. 9 the best-fit SFR values to SFR(UV), the value derived from the magnitude using the Kennicutt (1998) calibration, and assuming no extinction. The following differences can be seen: SFR SFR(UV) is obtained for many objects, where and 100 Myr. Lower SFRSFR(UV) values are obtained for some objects with relative short timescales , i.e., rapidly declining SF histories.
The comparisons shown here all include a marginalisation over the three metallicities considered in our models. As already mentioned, fixing leads to small differences. Given our limited knowledge of high- galaxies, other variations in the input physics, e.g., for the star-formation history or the reddening law, could be considered. Quantifying this is beyond the scope of this paper. The effect of different reddening laws on the physical parameters, however, can be understood quite simply, and is e.g., illustrated in Yabe et al. (2009). Rising SF histories, which are not considered here, have, e.g., been advocated by Finlator et al. (2007). We note, that these SF histories would in general correspond to a higher extinction than decreasing ones, to reproduce the observed SEDs of LBGs Finlator et al. (cf. 2007). This would strengthen our arguments in favour of dust at .
4.2 Correlations between physical properties in galaxies
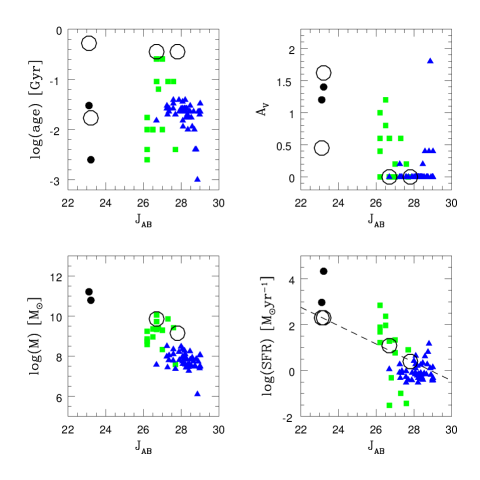
Although the uncertainties in the physical parameters are relatively large for most objects, it is helpful to search for correlations between them, and with observed quantities. Figure 10 shows the best-fit values for age, , stellar mass, and SFR of all objects from the 3 samples, plotted as a function of the -band magnitude, which traces approximately the rest-frame UV at 1500 Å. The values plotted here are taken from our model 1, i.e., the reference model plus the constraint that Myr, in particular to assure that SFR is properly defined. We also compare the best-fit values obtained by Gonzalez et al. (2009) and Labbé et al. (2010) for the mean/stacked SED for the intermediate and faint samples, and the available fit results from Capak et al. (2009) for the bright objects. The origin of the differences with these authors have already been discussed above.
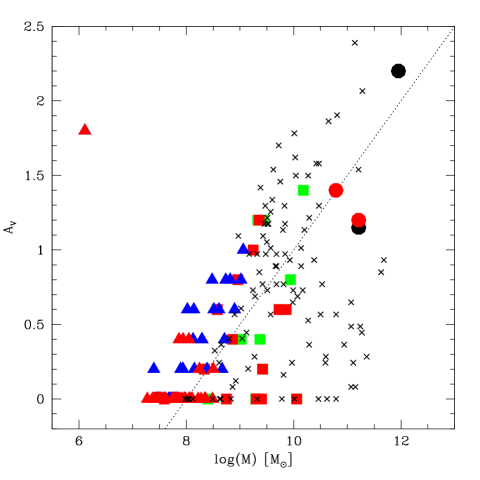
As is clear for the different samples, stellar ages and extinction cover a wide range of values with no clear or strong trend. It is possible that a tendency of increasing for brighter objects exists, as would be expected from other studies at lower redshift (cf. below). This trend becomes clearer when is plotted as a function of stellar mass, as shown in Fig. 11. We also find a tentative trend of the extinction with galaxy mass , as shown in Fig. 11.
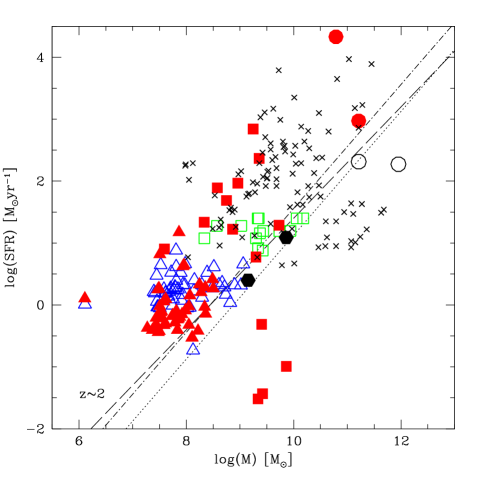
Both the stellar mass and SFR show clear trends with the -band magnitude, albeit with a significant scatter. We note that the scatter in the mass-magnitude relation for the objects does not significantly decrease when 3.6 or 4.5 m photometry is used. Deviations of the best-fit SFR from the simple “standard” calibration, also indicated in Fig. 10 for , are caused by non-zero extinction, age effects, and exponentially decreasing SF histories, or combinations thereof, as already discussed above. Figure 12 shows the corresponding correlation between stellar mass and SFR, suggesting a fairly well-defined mass–SFR relation at . Our best-fit values yield on average higher specific star-formation rates (SSFRSFR) than the values derived by Gonzalez et al. (2009) and Labbé et al. (2010) shown by large open circles, and tend to indicate a relatively large spread in SSFR.
4.3 Comparison with lower redshift galaxies
Although an exhaustive comparison with studies of the physical properties of LBGs at lower redshift is clearly beyond the scope of the present paper, it is worthwhile comparing briefly our results with those obtained at , and at lower redshift. To do so we refer to the detailed SED fitting analysis and discussions of Yabe et al. (2009, and references therein), who have compared the physical parameters of , 3, 5, and 6 LBGs from different samples.
The analysis of both Yabe et al. and Verma et al. (2007) of galaxies find clear signs of significant extinction. The former study finds values ranging from 0 to 0.5, with a median of , corresponding to i.e. a factor 9 attenuation of the UV flux! Our typical values are lower and the uncertainties are large; but in many cases the best-fit model extinction is for the LBGs. For comparison, Bouwens et al. (2009, 2010b) advocate an attenuation of the UV flux by a factor 1.35–1.6 (corresponding to 0.12–0.19 for the Calzetti law) at , and an attenuation by 2.7 () at . The extinction obtained by Yabe et al. (2009) and from our analysis is thus typically higher by a factor 3 than in the work of Bouwens and collaborators, who estimate the dust attenuation from the UV slope.
We find a trend of increasing extinction with galaxy mass (Fig. 11). At 0–2, it is known that dust extinction increases with bolometric luminosity (i.e., also with SFR), which in turn increases with stellar mass (e.g., Buat et al. 2005, 2008; Burgarella et al. 2007; Daddi et al. 2007; Reddy et al. 2006, 2008). Luminosity-dependent dust corrections have been proposed, e.g., by Reddy & Steidel (2009) and Bouwens et al. (2009), based on observed variations of the UV slope with . From these results, it is not surprising to find a similar relation at , here expressed as extinction versus stellar mass. The origin of a mass–extinction relation is most likely related to that of the mass–metallicity relation (cf. Tremonti et al. 2004; Erb et al. 2006; Finlator et al. 2007; Maiolino et al. 2008). The data of Yabe et al. (2009) at , also plotted in Fig. 11, may show a less clear trend with mass and some offset. A systematic differential analysis of LBG samples at different redshifts, will be necessary to shed more light on these issues.
The best-fit model values of the other physical parameters (age, mass, and SFR) span a similar range as found by Yabe et al. (2009) for LBGs. In contrast to the results of Gonzalez et al. (2009) and Labbé et al. (2010), our relatively young ages resemble those found by Verma et al. (2007) and Yabe et al. (2009) for , which are younger than 2–3 LBGs (cf. Shapley et al. 2001, 2005; Sawicki et al. 2007; Yabe et al. 2009). However, other studies (e.g., Stark et al. 2007a; Eyles et al. 2007; Stark et al. 2009), find relatively old ages at , and Yabe et al. (2009) confirm some of them with their method. Whether LBGs show a clear trend of decreasing age with increasing redshift, as one may naively expect, thus remains to be clarified.
For the IRAC-detected objects at (the bright and intermediate samples), the relation between stellar mass and absolute optical magnitude (derived from the 4.5 m flux) is very similar to that of the objects. The lower masses of the faint subsample – undetected by IRAC – provide a natural extension towards fainter objects. A similar behaviour is also found for the SFR, when comparing our results to those of Yabe et al. (2009).
The –SFR relation found at resembles that of LBGs (see Fig. 12). We note that most objects lie above the –SFR relation found at (cf. Daddi et al. 2007; Sawicki et al. 2007). However, both the behaviour and the scatter found for the objects resembles that of LBGs, also shown in this plot. Given the large uncertainties for the objects, and the different methods used in these analysis, it is possible that the same –SFR relation (with a similar scatter) is in place from to 2 and that the specific SFR declines to lower redshift (cf. Daddi et al. 2007; Elbaz et al. 2007; Noeske et al. 2007; Gonzalez et al. 2009).
A detailed study of the physical parameters of LBGs over a wide redshift domain with our modeling tools, including more in-depth comparisons of the results from different methods/groups, will be presented elsewhere.
4.4 Implications
An important result of this study is the possible discovery of dust extinction in LBGs at from detailed SED modeling, which contrasts with claims of basically dust-free objects from studies of their UV slope or from too restrictive SED modeling (cf. Bouwens et al. 2010b; Gonzalez et al. 2009; Labbé et al. 2010). If this were correct, the UV attenuation – up to (factor 20) for the brightest objects – would imply a higher SFR density at high redshift than previously inferred. However, to quantify the average dust correction remains difficult, especially given the large uncertainties for the individual objects and the possible dependence of on the UV luminosity and/or stellar mass. Even if our results imply that a non-negligible dust correction is required at , it is possible that the SFR density decreases with redshift from 3–5 on, at least if the median attenuation of found by Yabe et al. (2009) at is representative.
Our analysis, covering a wider domain in parameters space than previous studies and also allowing for the effects of nebular emission, shows that a wide range of stellar ages is acceptable for most LBGs. The Balmer break observed for some objects does not always imply old ages, or correspondingly high formation redshifts as already pointed out by Schaerer & de Barros (2009). It can often equally well be explained by nebular emission, younger populations at non-solar metallicity, extinction, or a combination thereof.
Younger ages and variations in the star-formation history can lead to solutions with lower masses and higher SFR for many of the LBGs than estimated by other groups (Gonzalez et al. 2009; Labbé et al. 2010). The specific star-formation rate (SSFRSFR) of these high- galaxies may also be higher than thought.
In short, our SED analysis including in particular the effects of nebular emission and considering a wide parameter space (SF histories, extinction etc., shows that the physical parameters of galaxies may differ significantly from those advocated by other groups, with possibly many implications for our picture of galaxy formation and evolution in the early universe. However, we emphasize that the physical properties of these objects are affected by large uncertainties (cf. Sect. 3 and Appendix), given their faintness and the available data. Furthermore, comparisons with results for lower redshifts may be problematic because of the use of different methods.
Obviously, additional and higher quality data, and a detailed differential study of the physical parameters of LBGs over a wide redshift domain using state-of-the-art tools will be very helpful in providing a clearer and more accurate picture of the properties and evolution of high- galaxies in the distant universe, and their link to lower redshift galaxy populations.
5 Conclusions
We have presented a homogeneous and detailed analysis of broad-band photometry for three samples of 6–8 galaxies discovered by the COSMOS survey and with HST (see Capak et al. 2009; Gonzalez et al. 2009; Oesch et al. 2010; McLure et al. 2009; Bunker et al. 2009). Their -band magnitude span a range from 23 to 29, the bulk of them having 26–29. The broad-band SEDs have been fitted using our modified version of the Hyperz photometric redshift code described in Schaerer & de Barros (2009), which accounts for the effects of nebular emission.
In contrast to earlier studies that assumed, e.g., constant star formation and/or no extinction, we have explored a wide range of the parameter space without using priors. The free parameters (and range) of our SED fits are: the redshift (), the metallicity (1, 1/5, 1/20), the SF history described by the e-folding timescale ( Myr, ), the age defined since the onset of star-formation (), the extinction ( in general) described by the Calzetti law (Calzetti et al. 2000), and whether or not nebular emission is included 444In some cases, we exclude the Ly line from the synthetic spectra, since this line may be attenuated by radiation transfer processes inside the galaxy or by the intervening intergalactic medium..
Our main results can be summarised as follows:
-
•
Overall, we find that the physical parameters of most galaxies studied here cover a wide range of acceptable values, e.g., within from the best-fit modeling. This finding is independent of whether nebular emission is included or not.
-
•
Stellar ages, in particular, are not tightly constrained, even for objects detected with Spitzer, i.e., with photometry both blue- and redward of the Balmer break. When nebular emission is taken into account, we find that the majority of the objects (and the stacked SEDs as well) are most accurately reproduced by ages , which are younger than derived in other studies of the same objects (Gonzalez et al. 2009; Labbé et al. 2010). The younger ages are due to the contribution of nebular lines to the broad-band rest-frame optical filters, which mimic to some extent a Balmer break, as already shown by Schaerer & de Barros (2009).
-
•
Examination of the UV slope and SEDs of faint z-dropout galaxies found with WFC3/HST shows no need for “unusual” stellar populations, extreme metallicities, or other physical processes, advocated previously by Bouwens et al. (2010b), when the uncertainties are taken into account (see also Finkelstein et al. 2009).
-
•
Albeit with large uncertainties, our fit results show indications of dust attenuation in some of the 6–8 galaxies, with best-fit model values of up to 1, even among relatively faint objects ( 26–27; cf. Fig. 10).
-
•
We find a possible trend of increasing dust attenuation with the stellar mass of the galaxy (Fig. 11) and a relatively large scatter in specific star-formation rates, SFR/.
- •
We will present elsewhere a systematic study of the evolution of the physical parameters of LBGs at different redshifts, adopting a homogeneous method and including a detailed error analysis.
Acknowledgements.
We would like to thank Matthew Hayes, David Valls-Gabaud, Rychard Bouwens, and Masami Ouchi for interesting discussions, and Roser Pelló for regular discussions and support with Hyperz. This work was supported by the Swiss National Science Foundation.Appendix A Bright sample (Capak et al. 2009)
Appendix B Intermediate sample (Gonzalez et al. 2009)
Appendix C Faint sample
C.1 Oesch et al. (2010) objects
C.2 Stacked SED (Labbé et al. 2010)
References
- Anders & Fritze-v. Alvensleben (2003) Anders, P. & Fritze-v. Alvensleben, U. 2003, A&A, 401, 1063
- Bolzonella et al. (2000) Bolzonella, M., Miralles, J.-M., & Pelló, R. 2000, A&A, 363, 476
- Bouwens et al. (2009) Bouwens, R. J., Illingworth, G. D., Franx, M., et al. 2009, ApJ, 705, 936
- Bouwens et al. (2010a) Bouwens, R. J., Illingworth, G. D., Oesch, P. A., et al. 2010a, ApJL, 709, L133
- Bouwens et al. (2010b) Bouwens, R. J., Illingworth, G. D., Oesch, P. A., et al. 2010b, ApJL, 708, L69
- Bouwens et al. (2004) Bouwens, R. J., Thompson, R. I., Illingworth, G. D., et al. 2004, ApJL, 616, L79
- Bradley et al. (2008) Bradley, L. D., Bouwens, R. J., Ford, H. C., et al. 2008, ApJ, 678, 647
- Bruzual & Charlot (2003) Bruzual, G. & Charlot, S. 2003, MNRAS, 344, 1000
- Buat et al. (2008) Buat, V., Boissier, S., Burgarella, D., et al. 2008, A&A, 483, 107
- Buat et al. (2005) Buat, V., Iglesias-Páramo, J., Seibert, M., et al. 2005, ApJL, 619, L51
- Bunker et al. (2009) Bunker, A., Wilkins, S., Ellis, R., et al. 2009, ArXiv e-prints, 0909.2255
- Burgarella et al. (2007) Burgarella, D., Le Floc’h, E., Takeuchi, T. T., et al. 2007, MNRAS, 380, 986
- Calzetti et al. (2000) Calzetti, D., Armus, L., Bohlin, R. C., et al. 2000, ApJ, 533, 682
- Capak et al. (2009) Capak, P., Mobasher, B., Scoville, N. Z., et al. 2009, ArXiv e-prints, 0910.0444
- Castellano et al. (2009) Castellano, M., Fontana, A., Boutsia, K., et al. 2009, ArXiv e-prints, 0909.2853
- Cuby et al. (2007) Cuby, J., Hibon, P., Lidman, C., et al. 2007, A&A, 461, 911
- Daddi et al. (2007) Daddi, E., Dickinson, M., Morrison, G., et al. 2007, ApJ, 670, 156
- Egami et al. (2005) Egami, E., Kneib, J.-P., Rieke, G. H., et al. 2005, ApJL, 618, L5
- Elbaz et al. (2007) Elbaz, D., Daddi, E., Le Borgne, D., et al. 2007, A&A, 468, 33
- Erb et al. (2006) Erb, D. K., Shapley, A. E., Pettini, M., et al. 2006, ApJ, 644, 813
- Eyles et al. (2007) Eyles, L. P., Bunker, A. J., Ellis, R. S., et al. 2007, MNRAS, 374, 910
- Finkelstein et al. (2009) Finkelstein, S. L., Papovich, C., Giavalisco, M., et al. 2009, ArXiv e-prints, 0912.1338
- Finlator et al. (2007) Finlator, K., Davé, R., & Oppenheimer, B. D. 2007, MNRAS, 376, 1861
- Gnedin et al. (2008) Gnedin, N. Y., Kravtsov, A. V., & Chen, H. 2008, ApJ, 672, 765
- Gonzalez et al. (2009) Gonzalez, V., Labbe, I., Bouwens, R. J., et al. 2009, ArXiv e-prints, 0909.3517
- Guseva et al. (2007) Guseva, N. G., Izotov, Y. I., Papaderos, P., & Fricke, K. J. 2007, A&A, 464, 885
- Henry et al. (2008) Henry, A. L., Malkan, M. A., Colbert, J. W., et al. 2008, ApJL, 680, L97
- Henry et al. (2007) Henry, A. L., Malkan, M. A., Colbert, J. W., et al. 2007, ApJL, 656, L1
- Henry et al. (2009) Henry, A. L., Siana, B., Malkan, M. A., et al. 2009, ApJ, 697, 1128
- Hibon et al. (2009) Hibon, P., Cuby, J., Willis, J., et al. 2009, ArXiv e-prints, 0907.3354
- Hickey et al. (2009) Hickey, S., Bunker, A., Jarvis, M. J., Chiu, K., & Bonfield, D. 2009, ArXiv e-prints, 0909.4205
- Iye et al. (2006) Iye, M., Ota, K., Kashikawa, N., et al. 2006, Nature, 443, 186
- Izotov et al. (1997) Izotov, Y. I., Lipovetsky, V. A., Chaffee, F. H., et al. 1997, ApJ, 476, 698
- Kauffmann et al. (2003) Kauffmann, G., Heckman, T. M., White, S. D. M., et al. 2003, MNRAS, 341, 33
- Kennicutt (1998) Kennicutt, Jr., R. C. 1998, ARA&A, 36, 189
- Kneib et al. (2004) Kneib, J., Ellis, R. S., Santos, M. R., & Richard, J. 2004, ApJ, 607, 697
- Labbé et al. (2006) Labbé, I., Bouwens, R., Illingworth, G. D., & Franx, M. 2006, ApJL, 649, L67
- Labbé et al. (2010) Labbé, I., González, V., Bouwens, R. J., et al. 2010, ApJL, 708, L26
- Maiolino et al. (2008) Maiolino, R., Nagao, T., Grazian, A., et al. 2008, A&A, 488, 463
- Maiolino et al. (2004) Maiolino, R., Schneider, R., Oliva, E., et al. 2004, Nature, 431, 533
- Mannucci et al. (2007) Mannucci, F., Buttery, H., Maiolino, R., Marconi, A., & Pozzetti, L. 2007, A&A, 461, 423
- McLure et al. (2009) McLure, R. J., Dunlop, J. S., Cirasuolo, M., et al. 2009, ArXiv e-prints, 0909.2437
- Noeske et al. (2007) Noeske, K. G., Weiner, B. J., Faber, S. M., et al. 2007, ApJL, 660, L43
- Oesch et al. (2010) Oesch, P. A., Bouwens, R. J., Illingworth, G. D., et al. 2010, ApJL, 709, L16
- Ota et al. (2008) Ota, K., Iye, M., Kashikawa, N., et al. 2008, ApJ, 677, 12
- Ouchi et al. (2009) Ouchi, M., Mobasher, B., Shimasaku, K., et al. 2009, ApJ, 706, 1136
- Papaderos et al. (2006) Papaderos, P., Guseva, N. G., Izotov, Y. I., et al. 2006, A&A, 457, 45
- Papaderos et al. (2002) Papaderos, P., Izotov, Y. I., Thuan, T. X., et al. 2002, A&A, 393, 461
- Papovich et al. (2001) Papovich, C., Dickinson, M., & Ferguson, H. C. 2001, ApJ, 559, 620
- Pelló et al. (2004) Pelló, R., Schaerer, D., Richard, J., Le Borgne, J., & Kneib, J. 2004, A&A, 416, L35
- Pustilnik et al. (2004) Pustilnik, S. A., Pramskij, A. G., & Kniazev, A. Y. 2004, A&A, 425, 51
- Razoumov & Sommer-Larsen (2010) Razoumov, A. O. & Sommer-Larsen, J. 2010, ApJ, 710, 1239
- Reddy & Steidel (2009) Reddy, N. A. & Steidel, C. C. 2009, ApJ, 692, 778
- Reddy et al. (2006) Reddy, N. A., Steidel, C. C., Fadda, D., et al. 2006, ApJ, 644, 792
- Reddy et al. (2008) Reddy, N. A., Steidel, C. C., Pettini, M., et al. 2008, ApJS, 175, 48
- Richard et al. (2006) Richard, J., Pelló, R., Schaerer, D., Le Borgne, J., & Kneib, J. 2006, A&A, 456, 861
- Richard et al. (2008) Richard, J., Stark, D. P., Ellis, R. S., et al. 2008, ApJ, 685, 705
- Santini et al. (2009) Santini, P., Fontana, A., Grazian, A., et al. 2009, A&A, 504, 751
- Sawicki et al. (2007) Sawicki, M., Iwata, I., Ohta, K., et al. 2007, in Astronomical Society of the Pacific Conference Series, Vol. 380, Deepest Astronomical Surveys, ed. J. Afonso, H. C. Ferguson, B. Mobasher, & R. Norris, p. 433
- Schaerer & de Barros (2009) Schaerer, D. & de Barros, S. 2009, A&A, 502, 423
- Schurer et al. (2009) Schurer, A., Calura, F., Silva, L., et al. 2009, MNRAS, 394, 2001
- Seaton (1979) Seaton, M. J. 1979, MNRAS, 187, 73P
- Shapley et al. (2001) Shapley, A. E., Steidel, C. C., Adelberger, K. L., et al. 2001, ApJ, 562, 95
- Shapley et al. (2005) Shapley, A. E., Steidel, C. C., Erb, D. K., et al. 2005, ApJ, 626, 698
- Sobral et al. (2009) Sobral, D., Best, P. N., Geach, J. E., et al. 2009, MNRAS, 398, L68
- Stark et al. (2007a) Stark, D. P., Bunker, A. J., Ellis, R. S., Eyles, L. P., & Lacy, M. 2007a, ApJ, 659, 84
- Stark et al. (2009) Stark, D. P., Ellis, R. S., Bunker, A., et al. 2009, ApJ, 697, 1493
- Stark et al. (2007b) Stark, D. P., Ellis, R. S., Richard, J., et al. 2007b, ApJ, 663, 10
- Tremonti et al. (2004) Tremonti, C. A., Heckman, T. M., Kauffmann, G., et al. 2004, ApJ, 613, 898
- Verhamme et al. (2008) Verhamme, A., Schaerer, D., Atek, H., & Tapken, C. 2008, A&A, 491, 89
- Verma et al. (2007) Verma, A., Lehnert, M. D., Förster Schreiber, N. M., Bremer, M. N., & Douglas, L. 2007, MNRAS, 377, 1024
- Wiklind et al. (2008) Wiklind, T., Dickinson, M., Ferguson, H. C., et al. 2008, ApJ, 676, 781
- Wilkins et al. (2009) Wilkins, S. M., Bunker, A. J., Ellis, R. S., et al. 2009, ArXiv e-prints, 0910.1098
- Willis et al. (2008) Willis, J. P., Courbin, F., Kneib, J., & Minniti, D. 2008, MNRAS, 384, 1039
- Wise & Cen (2009) Wise, J. H. & Cen, R. 2009, ApJ, 693, 984
- Yabe et al. (2009) Yabe, K., Ohta, K., Iwata, I., et al. 2009, ApJ, 693, 507
- Yan et al. (2009) Yan, H., Windhorst, R., Hathi, N., et al. 2009, ArXiv e-prints, 0910.0077
- Zackrisson et al. (2008) Zackrisson, E., Bergvall, N., & Leitet, E. 2008, ApJL, 676, L9
- Zheng et al. (2009) Zheng, W., Bradley, L. D., Bouwens, R. J., et al. 2009, ApJ, 697, 1907