The non-evolving internal structure of early-type galaxies: the case study SDSS J07283835 at
Abstract
We study the internal dynamical structure of the early-type lens galaxy SDSS J07283835 at . The analysis is based on two-dimensional kinematic maps extending out to 1.7 effective radii obtained from Keck spectroscopy, on lensing geometry and on stellar mass estimates obtained from multiband Hubble Space Telescope imaging. The data are modelled under the assumptions of axial symmetry supported by a two-integral distribution function (DF), by applying the combined gravitational lensing and stellar dynamics code cauldron, and yielding high-quality constraints for an early-type galaxy at cosmological redshifts. Modelling the total density profile as a power-law of the form , we find that it is nearly isothermal (logarithmic slope ), and quite flattened (axial ratio ). The galaxy is mildly anisotropic () and shows a fair amount of rotational support, in particular towards the outer regions. We determine a dark matter fraction lower limit of 28 per cent within the effective radius. The stellar contribution to the total mass distribution is close to maximal for a Chabrier initial mass function (IMF), whereas for a Salpeter IMF the stellar mass exceeds the total mass within the galaxy inner regions. We find that the combination of a NFW dark matter halo with the maximally rescaled luminous profile provides a remarkably good fit to the total mass distribution over a broad radial range. Our results confirm and expand the findings of the SLACS survey for early-type galaxies of comparable velocity dispersion ( km s-1). The internal structure of SDSS J0728 is consistent with that of local early-type galaxies of comparable velocity dispersion as measured by the SAURON project, suggesting lack of evolution in the past two billion years.
keywords:
gravitational lensing — galaxies: elliptical and lenticular, cD — galaxies: kinematics and dynamics — galaxies: structure.1 Introduction
Unveiling the mass distribution, dynamical structure and dark matter content of early-type galaxies is of great interest both as a subject in its own right, considering their importance in the local Universe, where a large fraction of the total stellar mass is contained within E/S0 systems (Fukugita, Hogan, & Peebles, 1998), and in order to provide stringent tests for the galaxy formation and evolution models.
It is not surprising, therefore, that nearby early-type galaxies have been the object of intense study during the last decades, by taking advantage of the diverse available observational tracers. These include stellar kinematics (see e.g. Saglia, Bertin, & Stiavelli 1992, Franx et al. 1994, Rix et al. 1997, Loewenstein & White 1999, Gerhard et al. 2001, Borriello et al. 2003, Cappellari et al. 2007, Thomas et al. 2007b, Weijmans et al. 2009), globular clusters and planetary nebulae kinematics (e.g. Côté et al., 2003; Romanowsky et al., 2003; de Lorenzi et al., 2008), the occasional H I disk or ring (e.g. Franx, van Gorkom, & de Zeeuw 1994; Weijmans et al. 2008) and hot X-ray emission (e.g. Matsushita et al., 1998; Fukazawa et al., 2006; Humphrey et al., 2006; Humphrey & Buote, 2010). The general picture emerging from many of these studies is that the total mass density profile of ellipticals can be well described by a power-law form close to , often referred to as the isothermal profile. Moreover, while the inner regions of early-type galaxies are clearly dominated by the stellar component, the dark matter component is usually found to play already a non negligible role, with fractions of approximately to per cent of the total mass within an effective radius. Studies based on stellar population and dynamical models (e.g. Padmanabhan et al., 2004) indicate that the dark matter fraction increases with the mass of the galaxy, a trend that is more conspicuous in the case of slow-rotator ellipticals (Tortora et al., 2009).
The analysis of early-type galaxies beyond the local Universe, i.e. beyond redshift , holds great promise in view of understanding the structural evolution of these objects, but it also presents several difficulties which hinder the application of traditional techniques. Stellar dynamics studies, in particular, are limited by the degeneracy between the galaxy mass profile and the anisotropy of the stellar velocity dispersion tensor. Taking into account higher order velocity moments can provide a solution (see Gerhard, 1993; van der Marel & Franx, 1993; Łokas & Mamon, 2003), but unfortunately carrying out such measurement for distant systems is not viable with the current instruments on 8-10 meter class telescopes.
However, galaxies at have a far greater chance of acting as strong gravitational lenses (Turner, Ostriker, & Gott, 1984), thus providing a very helpful additional diagnostic tool. This is particularly valuable since it allows an accurate and robust determination of the total mass enclosed, in projection, within the region delimited by the Einstein radius (Kochanek, 1991). Unfortunately, the diagnostic power of strong lensing to constrain internal mass distribution of the deflector is limited, chiefly by the mass-sheet and mass-slope degeneracies (Falco et al., 1985; Wucknitz, 2002), although the latter can be partially overcome by studying spatially extended lensed sources (e.g. Warren & Dye, 2003; Suyu et al., 2010). A very effective way to overcome these difficulties and robustly recover various structural properties of the galaxy is to combine the gravitational lensing analysis with the complementary constraints provided by stellar dynamics (see Koopmans & Treu 2002, 2003, Treu & Koopmans 2002a, 2002b, 2004, Barnabè & Koopmans 2007, hereafter BK07, and, e.g., Rusin & Kochanek 2005, Jiang & Kochanek 2007, van de Ven et al. 2008, Trott et al. 2010, Grillo et al. 2010 for further applications of this approach).
Up to very recently, the availability of only a handful of lens galaxies suitable for the joint analysis represented a major limitation. This concern has been dispelled by the Sloan Lens ACS Survey, SLACS (Bolton et al. 2006, 2008a, 2008b, Koopmans et al. 2006, 2009, Treu et al. 2006, 2009, Gavazzi et al. 2007, 2008, Auger et al. 2009), which has led to the discovery of a large and homogeneous sample of almost a hundred strong gravitational lenses, mostly early-type galaxies, in the redshift range of . For a subset of about SLACS systems, the data set is complemented by two-dimensional kinematic maps of the lens obtained from spectroscopic observations carried out either with the Very Large Telescope (VLT) instrument VIMOS or with the Low Resolution Imager and Spectrograph (LRIS, see Oke et al. 1995) mounted on the Keck-I telescope. This has provided further motivation to expand the combined analysis technique into a more general and self-consistent method which makes full use of the available data sets (i.e. surface brightness distribution of both the lensed source and the lens galaxy, and two-dimensional kinematic maps of the latter), and is coherently embedded in the framework of Bayesian statistics (BK07). The current implementation of the method, the cauldron code — based on the assumptions of axial symmetry and two-integral stellar DF for the lens galaxy — has been used to conduct an in-depth study of a SLACS subsample of six systems representative of the survey in terms of redshifts and velocity dispersions (see Czoske et al. 2008 and Barnabè et al. 2009a, hereafter B09). As shown in those works, the more sophisticated approach makes it possible to extract much more information out of the data set, allowing to recover, in addition to the slope of the total density profile, several other important properties of the lens galaxies, including the flattening of the density distribution, lower limits for the dark matter fraction at different radii and insights on the dynamical structure (angular momentum, anisotropy, contribution of rotation and random motions). These quantities are all of relevance to the formation history of these galaxies.
In this paper we carry out a detailed combined lensing and dynamics analysis of the SLACS system SDSS J07283835, employing the cauldron algorithm. The lens is an early-type galaxy at , with an aperture averaged velocity dispersion km s-1 measured from SDSS spectroscopy and a half-light radius in the band. The background source is located at and the Einstein radius is . With respect to the systems considered in Czoske et al. (2008) and B09, all followed-up with VLT VIMOS integral-field unit, the main difference in the observables lies in the kinematic data set: the SDSS J0728 velocity moments maps are obtained from LRIS Keck long-slit spectroscopic observations, using three slits parallel to the major axis, and offset along the minor axis, in order to mimic integral-field capabilities. Remarkably, this kinematic data set extends significantly farther than those of the previously examined systems, reaching up to 1.7 , thus providing us important constraints beyond the inner regions of the galaxy. Moreover, for the first time, we use the stellar masses determined from stellar population analysis (Auger et al., 2009) to set the normalization of the luminous mass distribution of the lens galaxy, enabling us to disentangle the luminous and dark matter contributions and to compare different choices of the initial mass function (IMF).
The paper is organized as follows: after introducing the data set in Section 2, we present and discuss the results of the combined analysis in Section 3 and draw conclusions in Section 4.
Throughout this paper we adopt a concordance CDM model described by , and with , unless stated otherwise.
2 Observations
2.1 High-resolution imaging data
The lensing analysis requires deep high-resolution imaging data and this is provided by the SLACS survey’s Hubble Space Telescope (HST) imaging. In particular, SLACS has obtained one HST orbit ( 2200s) of data in the F814W filter. The data are processed as described in Bolton et al. (2008a); to briefly summarize, the four individual exposures are background subtracted, cosmic ray-cleaned, registered, resampled to an output grid with square pixels that are 005 on a side, and stacked with an additional cosmic ray-rejection step. Synthetic point-spread function (PSF) images created with TinyTim are likewise resampled and combined to create a composite model PSF for the output image.
The light distribution of the galaxy is then fit with a B-spline model (e.g., Bolton et al., 2008a) and this model, convolved with the seeing present during the spectroscopic observations, is used as the input surface brightness distribution for the dynamics modelling. The residual image (the B-spline model subtracted from the data image) contains the flux from the lensed background source and is used as lensing constraint on the mass model of the lens galaxy (see BK07 for details). The galaxy-subtracted image is shown in the bottom right-hand panel of Fig. 4.
2.2 Pseudo-IFU Spectroscopy
Our previous joint lensing and dynamics studies used VLT-VIMOS integral field unit (IFU) spectroscopy to generate resolved stellar kinematic maps. In this study we employ ‘pseudo-IFU’ spectroscopy, which consists of dithering a traditional longslit in the spectral direction over the target galaxy to provide spatially-resolved kinematic data perpendicular to the slit direction in addition to the spatial information that is obtained along each slit (see Figure 1). This technique yields significantly fewer spaxels per exposure than proper IFU spectroscopy but the throughput from the longslit is a factor of a few larger than the IFU throughput and we are therefore able to efficiently produce kinematic maps, despite the less efficient way of sampling the kinematic field. Additionally, we are more sensitive to the low-surface brightness outer regions of the galaxy and can therefore extend our kinematic maps to larger radii than is possible with the IFU data.
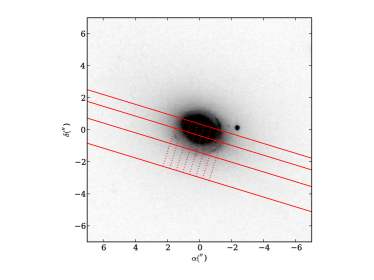
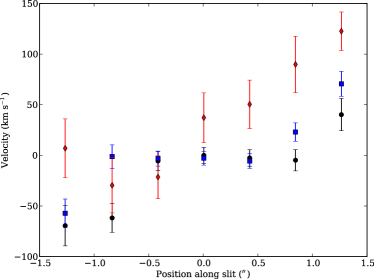
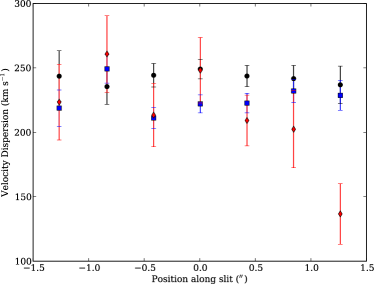
The spectroscopic data for SDSS J0728 were obtained with LRIS on Keck I during the nights of 22 and 23 December 2006. The observing conditions were clear with seeing, and we used the 460 dichroic to split the beam to the blue and red sides of the spectrograph. Here we only use data from the red side, which employed the 900/5500 grating with a dispersion scale of 0.85 Åpixel-1. Three slit positions aligned along the semi-major axis of the galaxy were observed, including: two 900s exposures with a 07 slit positioned on the center of the galaxy; four 1200s exposures with a 1″slit offset 085 from the center of the galaxy; and 4 1800s exposures with a 15 slit offset 21 from the center of the galaxy. The data were reduced using custom Python scripts (for details see Suyu et al., 2010) and one dimensional spectra were extracted from apertures of width 2 pixels () at seven points along each slit as indicated in Figure 1, yielding 21 spectra in total (e.g., Figure 2).
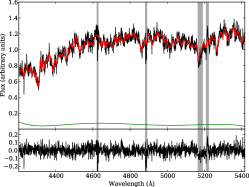
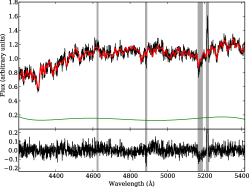
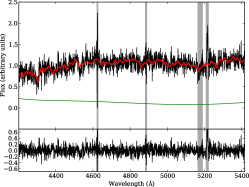
The stellar velocity dispersion and velocity offset was computed for each spectrum as in Suyu et al. (2010) using the rest-frame wavelength range 4200 Å to 5450 Å and errors were determined from Markov chain Monte Carlo simulations. The resulting velocity and velocity dispersion profiles for each slit position are shown in Figure 3. We compare our data with the velocity dispersion derived from the SDSS spectrum by combining the 14 spectra from the inner two slits and determining a composite velocity dispersion. This is found to be 236 km s-1, rather larger than the value of 214 km s-1 found for the SDSS spectrum. We have re-analysed the SDSS spectrum and find km s-1, but if we mask the O II lines (as is done in the analysis of the Keck spectra) we find km s-1. This is still somewhat lower than, although consistent within the errors with, the central velocity dispersion derived from the composite Keck spectrum. However, we might expect the SDSS value to be lower due to poor seeing pushing more flux from large radii (where the velocity dispersion is lower) into the SDSS fibre aperture.
3 Analysis and results
3.1 Joint gravitational lensing and stellar dynamics analysis
Here we briefly recall the general features of the cauldron code, the tool employed to carry out the combined self-consistent gravitational lensing and stellar dynamics analysis for the galaxy in exam, SDSS J0728. The reader is referred to BK07 for a detailed description of the algorithm.
We characterize the lens galaxy by means of its total density distribution , where is a set of parameters describing the density profile. Via the Poisson equation, we calculate the total gravitational potential and we use it simultaneously for both the gravitational lensing and the stellar dynamics modelling of the data set, which typically includes the surface brightness and velocity moments maps of the lens galaxy and the surface brightness map of the lensed image. Both these modelling problems can be formalized as a set of regularized linear equations, for which standard solving techniques are readily available. Thus — given a combined data set — for each choice of the parameters we can calculate the surface brightness distribution of the unlensed source, and the weights of the elementary stellar dynamics building blocks. In order to determine the “best” (in an Occam’s razor sense) density model given the data, this linear optimization scheme has been embedded within the framework of Bayesian statistics. This allows to objectively quantify (and therefore rank) the plausibility of each model by means of the evidence merit function (see e.g. MacKay, 1999, 2003). In this way, by maximizing the evidence, one recovers the set of non-linear parameters corresponding to the best density model, i.e. the model which maximizes the joint posterior probability density function (PDF), hence called maximum a posteriori (MAP) model.
The method as described is extremely flexible and can in principle support any density profile, by adopting for example a completely general pixelized density distribution. However, its current practical implementation, the cauldron algorithm, is more restricted in order to make it computationally efficient and assumes axial symmetry (i.e. a density distribution of the form ) and a two-integral stellar DF , where and denote the two classical integrals of motion, i.e., respectively, energy and angular momentum along the rotation axis. As shown in BK07, under these assumptions it is possible to take advantage of a fast Monte Carlo numerical implementation of the two-integral Schwarzschild method described by Cretton et al. (1999) and Verolme & de Zeeuw (2002), which allows a dynamical model to be built in a matter of seconds and, therefore, makes it possible to explore large regions of the parameter space. The distinguishing feature of this method is that the building blocks employed for the construction of the dynamical model are constituted by two-integral components (TICs) rather than stellar orbits as in the classical Schwarzschild method (Schwarzschild 1979; see e.g. Thomas et al. 2007b and van den Bosch et al. 2008 for modern implementations). A TIC can be visualized as an elementary toroidal system, completely specified by a particular choice of and . TICs have simple radial density distributions and analytic unprojected velocity moments, and by superposing them one can build models for arbitrary spheroidal potentials (cf. Cretton et al., 1999): all these characteristics contribute to make TICs particularly valuable and inexpensive building blocks when compared to orbits.
Notwithstanding these restrictions, Barnabè et al. (2009b) have shown that cauldron works robustly even when applied to simulated systems which depart significantly from the method’s assumptions (including the assumption of axial symmetry), reliably recovering several important global properties of such systems, in particular the slope of the total mass density profile, which is determined within less than 10 per cent of the correct value. When the system displays rotation in the kinematical maps, as is the case for SDSS J0728, the main dynamical quantities (such as the global anisotropy parameter , the angular momentum and the ordered to random motions ratio, see Sect. 3.5) are recovered with an accuracy of 10 to 25 per cent.
3.2 The galaxy model
Stellar dynamics (e.g. Gerhard et al., 2001), strong and weak gravitational lensing (e.g. Koopmans et al., 2009; Gavazzi et al., 2007) and X-ray studies (see e.g. Humphrey & Buote, 2010, and references therein) all concur in indicating that the total mass profile of elliptical galaxies is remarkably well described by a single power-law model over a large radial range.
As our model for the total mass density profile of the analyzed lens galaxy we adopt, therefore, an axially symmetric power-law distribution
| (1) |
with being a density scale, the logarithmic slope of the density profile, and the elliptical radius, i.e.
| (2) |
where and are length-scales and the axial ratio . The corresponding (inner) gravitational potential associated with the distribution can be obtained straightforwardly by means of the classical Chandrasekhar (1969) formula, which entails the computation of a single integral.
In case the assumption of a power-law density profile is an oversimplified description of the true mass distribution of the galaxy, this is expected to have visibly disrupting effects on the reconstructed observables, in particular for the lensing ones. As illustrated in the Barnabè et al. (2009b) tests, these can include a strongly irregular reconstructed source, with sharp transitions in intensity between close pixels (despite the usual adoption of a regularization term), and the presence of recognizable arc-like features in the lens image residuals. We emphasize, however, that such clear discrepancies have never surfaced in previous analyses of the SLACS systems (Czoske et al. 2008, B09), which supports instead the effectiveness of the simple power-law model.
With this choice, the galaxy model is therefore characterized by three non-linear physical parameters, i.e. the slope , the axial ratio and the dimensionless lens strength , which is directly related to the normalization of the three dimensional potential (see Appendix B of BK07). To these, we must add the four “geometrical” parameters defining the configuration of the system in the sky, i.e. the position angle , the inclination and the coordinates of the lens galaxy centre. The latter, as well as the angle , are typically strongly constrained by the lens image brightness distribution and can be accurately determined by means of fast preliminary explorations and, therefore, kept fixed afterwards in order to decrease the number of free non-linear parameters during the more computationally expensive optimization and error analysis runs. If necessary, external shear can be also accounted for, by introducing shear strength and shear angle as additional parameters.
Finally, we have three so-called hyperparameters which control the level of the regularization in the reconstructed quantities: one for the surface brightness distribution of the unlensed source, and two for the TIC weights map. Their values are set by optimizing the Bayesian posterior probability.
3.3 Uncertainties
In order to correctly assess the model uncertainties within the framework of Bayesian statistics, one needs to evaluate the posterior probability distribution of the parameters, i.e., by denoting the data set as and the considered model or hypothesis as ,
| (3) |
where is the likelihood and is the prior. The individual parameter confidence intervals can be obtained by marginalizing the posterior over each of them.
Sampling a multidimensional distribution such as is in general a challenging and computationally expensive task. An effective technique to tackle this problem is the nested sampling Monte Carlo method introduced by Skilling (2004) which, in calculating the evidence, produces posterior inferences as valuable by-products. For our error analysis, we make use of the MultiNest algorithm developed by Feroz & Hobson (2008) and Feroz, Hobson, & Bridges (2009), which provides an efficient and robust implementation of the nested sampling method, and has been shown to yield reliable posterior inferences even in presence of multi-modal and degenerate multivariate distributions.
The model parameters that we consider are the ones introduced in the previous Section, i.e. the inclination , the lens strength , the slope and the axial ratio (the additional parameters which can be estimated by means of preliminary runs, such as the lens center and the position angle, however, are kept fixed here in order to reduce the computational load), to which we must add the three hyper-parameters. We formalize our ignorance by adopting flat priors (or flat in logarithm for the hyper-parameters), constructed around the MAP value of each parameter, and taken wide enough to include the bulk of posterior probability distribution. Finally, we conduct a thorough exploration of this 7-dimensional surface by launching MultiNest with 400 live points111The live points (sometimes also called active points) are the initial samples drawn from the full prior distribution , from which the nested sampling exploration of the posterior is started. Our choice of 400 live points for the relatively well-behaved 7-dimensional distribution at hand is very conservative. In fact, as shown by the test problems examined in Feroz et al. (2009), 1000 or 2000 active points are sufficient for the application of MultiNest even to, respectively, highly dimensional problems (with up to 30 parameters) or pathologically multimodal distributions (e.g. the egg-box likelihood presented in their Section 6.1). Moreover, if one is more interested in determining the marginalized posterior distribution of the parameters rather than in accurately calculating the value of the total evidence, a much smaller number of live points (of order 50) is shown to be already enough to obtain a reliable estimate., from which the individual marginalized posterior probability distributions are obtained. In the following, we quote the 99 per cent confidence interval calculated from these distributions as our error.
| parameter | ||||
|---|---|---|---|---|
| 2.082 | 2.055 | 2.077 | 2.119 | |
| 0.325 | 0.317 | 0.323 | 0.331 | |
| 0.602 | 0.574 | 0.603 | 0.681 | |
| 68.1 | 67.8 | 68.6 | 73.6 |
Note. The listed parameters are: the logarithmic slope ; the dimensionless lens strength ; the axial ratio and the inclination (in degrees) with respect to the line-of-sight. The second column presents the MAP parameters, i.e. the parameters that maximize the joint posterior distribution. Columns 3 to 5 encapsulate a description of the one-dimensional marginalized posterior distributions, plotted in Fig. 6. The parameter corresponding to the maximum of that distribution is listed in column 4, while and are, respectively, the lower and upper limits of the 99 per cent confidence interval.
3.4 Results for the best model reconstruction
The cauldron code has been applied to the combined data set described in Section 2. In order to avoid possible spurious effects in the lensing reconstruction, we have masked out the central regions of the lensed image map, where the residuals of the galaxy subtraction are still appreciable. We use the best-fitting B-spline model of the lens galaxy as our data set for its surface brightness distribution, to avoid “contamination” from the background galaxy lensed images, which is particularly bright and could bias the reconstructed model. A similar approach had been followed in the analysis of lens system SDSS J2321 (Czoske et al., 2008).
The recovered non-linear parameters for the best reconstructed model, i.e. the maximum a posteriori model, are presented in Table 1. The uncertainties on the individual parameters are quantified by marginalizing, over each of them, the joint posterior distribution (see Fig. 6). The parameter values corresponding to the maximum of the one-dimensional marginalized posterior and the limits of the 99 per cent confidence interval are also listed in Table 1.
We find for SDSS J0728 a logarithmic slope (errors indicate the 99% confidence level), very close to the so-called isothermal (i.e. ) profile which appears to be a characterizing feature of early-type galaxies, and in general agreement with previous combined lensing and dynamics studies of the SLACS sample (Koopmans et al. 2009, B09). For this specific system — by using the 3-arcsec aperture averaged SDSS velocity dispersion measure as the only kinematic constraint — Koopmans et al. (2009) determine a slightly different slope (68% CL), which, however, we find here to be too shallow to correctly reproduce the kinematic maps. One reason for this discrepancy is that the velocity dispersion derived from the SDSS is lower (typically of km s-1) than the value obtained from Keck spectroscopy, as discussed in Sect. 2.2. Moreover, Koopmans et al. (2009) adopt a simpler dynamical model, based on solving spherical Jeans equations, which might have difficulties in describing a system characterized by a significant flattening like SDSS J0728.
The recovered lens strength is . The axial ratio of the total density distribution is found to be , slightly flatter than the intrinsic axial ratio of the luminous distribution, calculated by deprojecting the observed isophotal axial ratio by making use of the best model value obtained for the inclination. Moreover, the position angle is found to be extremely close to the value inferred from the light distribution, indicating alignment between the dark and luminous mass components in the inner regions of the galaxy.
The marginalized posterior probability distributions of these parameters (with the exception of the position angle, which, as previously described, is kept fixed after the preliminary run), as well as those of the regularization hyper-parameters, obtained as described in Section 3.3, are shown in Fig. 6. We note that these represent the statistical errors on the considered power-law model, and do not take into account the potential systematic uncertainties due to issues in the generation of the data sets (e.g. the procedure for galaxy subtraction, as pointed out by Marshall et al. 2007) or to incorrect model assumptions (as in the case of, e.g., non axially symmetric density distribution or flattening that varies with radius). In the latter case, a quantitative estimate of the upper limits of the systematic errors can be obtained by looking at the findings of the Barnabè et al. (2009b) ‘crash-test’ where the cauldron code is applied to a non-symmetric simulated galaxy. As mentioned in Sect. 3.1, the error on the logarithmic slope is less than 10 per cent even in this quite extreme case. Since real early-type galaxies are unlikely to depart from axisymmetry as drastically as this simulated system, we expect systematic uncertainties to remain within a few per cent level.

There is no evidence that any significant external shear effect needs to be included in order to model this system: when the external shear angle and strength are allowed to vary, the MAP model value of the latter is found to be negligibly small. This is consistent with the absence of massive structures near the lens galaxies found in Treu et al. (2009). We also explored the possibility of introducing a core radius in the density profile, without finding any improvement to justify the inclusion of this additional parameter.
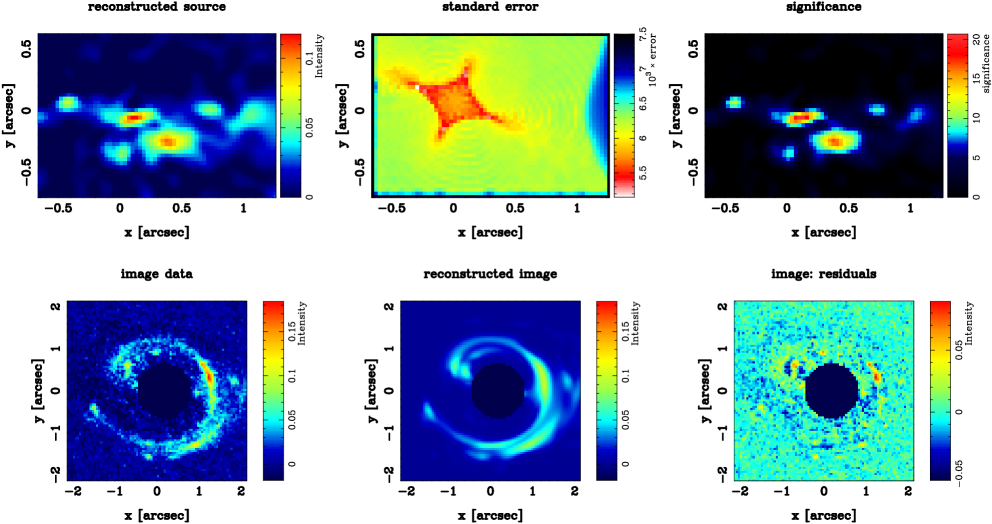
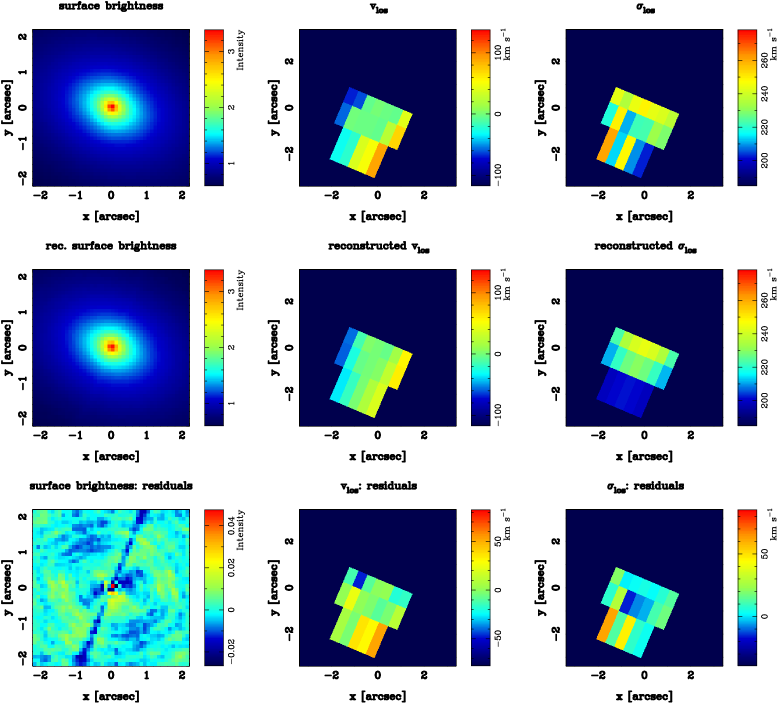
In Figure 4 and 5 we present — respectively for lensing and dynamics — the SDSS J0728 data set, the reconstructed observables obtained for the MAP model, and the corresponding residuals. This system displays an unusually structured lensed image, which we find to be produced by the presence of multiple components in the source plane. The reconstructed background source is shown in the top-left panel of Fig. 4; the top-middle and top-right panels show, respectively, the standard errors and the significance of the reconstructed source.
The surface brightness map is reconstructed very accurately. Since the adopted data set is a B-spline model and therefore noiseless, the small residuals (at the 1 per cent level) are dominated by the discreteness effects of the TIC superposition, which determines the concentric ripples, while the structure aligned with the galaxy minor axis is caused by the toroidal shape of the building blocks. These undesired effects have been kept under control by increasing both the number of TIC employed in the dynamical model (of almost a factor of four, from elements adopted in the previous studies conducted with cauldron to elements) and the number of particles populating each TIC. An additional and more compelling motivation for this improvement of the TIC library, which further justifies the increased computational burden, is that it proves to be important for the reconstruction of the kinematic observables (particularly the velocity dispersion map) at larger distances from the galaxy major axis, i.e. that part of our data set which best allows us to probe the system under study beyond the effective radius.
3.5 Global dynamical quantities
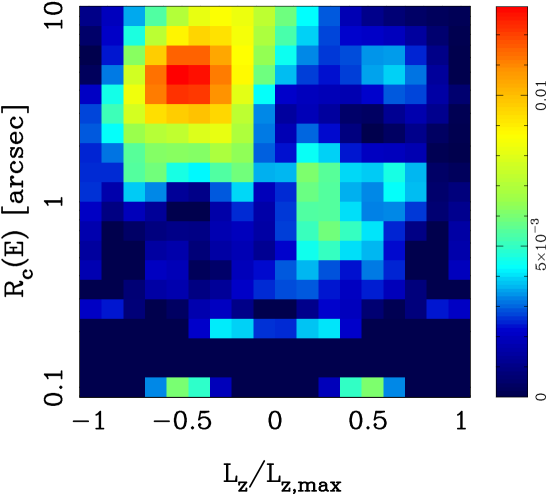
The recovered weighted stellar DF for the best combined model is presented in Fig. 7 as a map of the relative TIC weights over the integral space (the grid in the radial coordinate is related to a grid in energy as explained in BK07). This representation encodes, in a very compact way, much of the information on the dynamical structure of the galaxy that can be obtained under the assumptions of the adopted two-integral model. However, it is often useful to distill such information into quantities that allow for a more straightforward physical interpretation.
The global properties of the stellar velocity dispersion tensor are customarily encapsulated in the three anisotropy parameters
| (4) |
where we indicate with
| (5) |
the total unordered kinetic energy in the coordinate direction and is the velocity dispersion along the direction (see Cappellari et al., 2007; Binney & Tremaine, 2008).
For SDSS J0728, we compute the integral of Eq. (5) within a cylinder of radius and height equal to , i.e. inside a region which is very well constrained by the data, finding a mild anisotropy , which falls within the typical range of values for early-type galaxies both in the local Universe (Cappellari et al., 2007; Thomas et al., 2009) and up to redshift (see B09). Since we make use of a two-integral DF dynamical model, the velocity dispersion tensor is isotropic in the meridional plane (i.e. for each ) and therefore by construction, and is univocally linked to by the relation . For the analyzed system, we have .
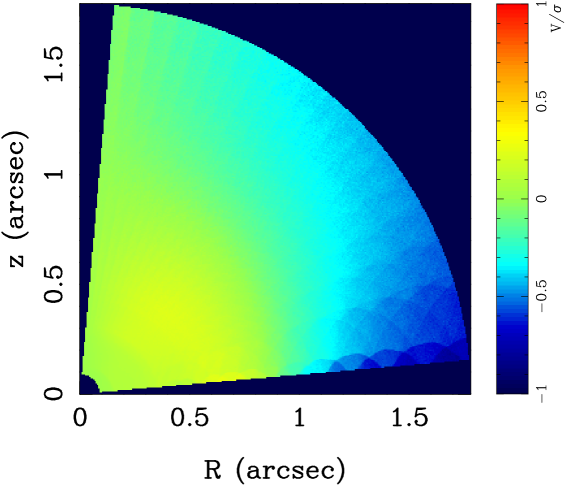
The importance of rotation with respect to random motions is among the most defining aspects of the dynamical structure of a stellar system. In order to explore how this property varies with the position in the meridional plane, we calculate the local ratio between the mean rotation velocity around the -axis and the mean velocity dispersion and we plot it in Fig. 8 up to one effective radius. The inner regions — within approximately — are dominated by random motions, while rotation becomes more important at large radii, a trend somewhat reminiscent of what is found, in B09, for the fast rotator SDSS J0959 (although it should be remembered that the map of the latter only extends up to ). Not surprisingly, therefore, the presence of large-scale ordered motions is reflected also in the quite high value obtained for the intrinsic rotation parameter, which is a dimensionless proxy for the galaxy angular momentum (refer to B09 for the definition).
3.6 Dark and luminous mass distribution
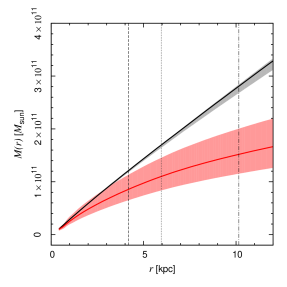
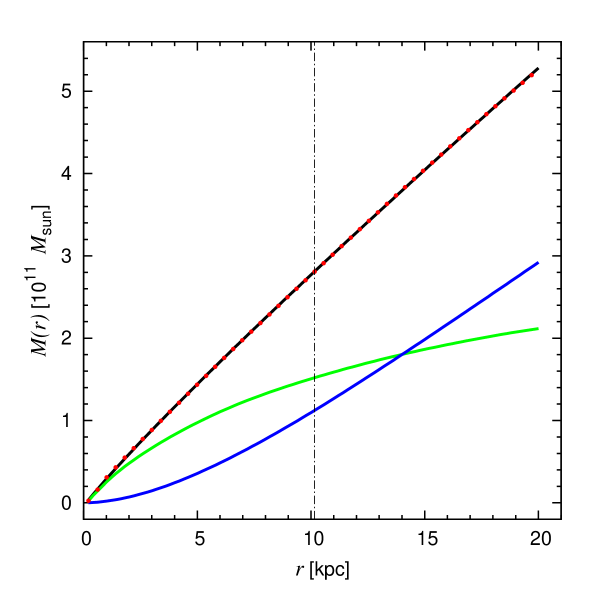
The spherically averaged profile of the galaxy total mass corresponding to the best reconstructed model (solid black curve in Fig. 9) can be calculated straightforwardly from Eq. (1), while the radial profile of the luminous component is obtained from the recovered stellar DF. However, since within our method stars are treated as tracers of the total potential, the normalization of the luminous profile is not fixed, and must be constrained by means of an independent determination of the stellar mass-to-light ratio or by introducing additional assumptions.
One particularly informative assumption, known as the “maximum bulge” approach, consists in maximally rescaling the luminous mass distribution without exceeding the total mass profile at any radius. This provides a consistent and robust way to assess a lower limit for the dark matter fraction in the analyzed system (under the hypothesis that the stellar mass-to-light ratio does not change too drastically with the position in the galaxy). By applying this procedure to SDSS J0728, we determine a value for the total stellar mass. With this normalization of the luminous mass profile, one finds a dark matter fraction of 16 per cent of the total mass within the (three-dimensional) spherical radius , which rises to 28 per cent at — corresponding to about kpc — and up to almost 40 per cent at kpc, which is approximately the outer limit of the region over which we have direct information from the stellar kinematic maps. This result is consistent with the findings of purely dynamical studies of the inner regions of early-type galaxies in the local Universe (e.g. Gerhard et al., 2001; Cappellari et al., 2006; Thomas et al., 2007b). It is also in good agreement with the conclusions of our previous analysis of six SLACS lens systems (where the same maximum bulge prescription was adopted), for which, however, the kinematic data set does not extend beyond , with the exception of galaxy SDSS J0959 (see B09). The corresponding upper limit for the stellar mass-to-light ratio in the band of SDSS J0728 is , which is in the lower end of the typical values reported for slow-rotating elliptical galaxies in the local Universe (Kronawitter et al., 2000; Gerhard et al., 2001; Trujillo et al., 2004). This is not too surprising, since the is expected to increase by a significant amount (a factor of according to Treu et al. 2002) between and , simply due to passive evolution of stellar populations. Moreover, the evidence of rotation at large radii (cf. § 3.5) might indicate the presence of a disk component, typically characterized by a lower mass-to-light ratio.
.
It is interesting to compare this maximum bulge upper limit with the stellar masses determined from stellar population analysis. By applying a novel Bayesian stellar population analysis code to multi-band imaging data, Auger et al. (2009) determine for galaxy SDSS J0728 — without including any priors from lensing — a value for a Chabrier (2003) IMF and a value for a Salpeter (1955) IMF (quoted errors are 1-sigma). We note that, since the thermally pulsing asymptotic giant branch stars do not dominate the luminosity of old stellar populations, the Bruzual & Charlot (2003) models used by Auger et al. (2009) should not be biased by ignoring them. In fact, the stellar masses for SLACS galaxies are found to be consistent with the masses determined from Maraston (2005) models (see Treu et al., 2010).
By using these stellar mass values to rescale the (spherically averaged) luminous profile, one obtains the red curves shown in Fig. 9. It can be clearly seen that the Salpeter IMF produces a stellar mass distribution which (unphysically) overshoots the total mass profile up to and beyond the effective radius. The Chabrier IMF, on the other hand, yields a physically acceptable luminous profile, which, interestingly, is also very close to the one determined through the maximum bulge assumption.
Treu et al. (2010) argue – based on the mass determinations from lensing, dynamics and stellar populations synthesis models for 56 SLACS systems – that early-type galaxies cannot have both universal IMF and dark matter profiles. In fact, if a universal Navarro, Frenk & White (NFW, Navarro, Frenk, & White 1996, 1997) halo is assumed, the IMF shows a trend with velocity dispersion: a Chabrier-like normalization is more appropriate for less massive systems with of the order of km s-1, while more massive galaxies are better described with a Salpeter-like IMF. The results of our detailed analysis of SDSS J0728 are consistent with this general picture. With a SDSS velocity dispersion km s-1, this system definitely belongs to the lower mass end of the SLACS sample, and its halo profile is consistent with NFW (as discussed in the next Section). Clearly, since this conclusion is based on only one system, a full analysis of the sample still needs to be done to further strengthen this tentative trend.
3.7 Is the isothermal profile consistent with a NFW halo?
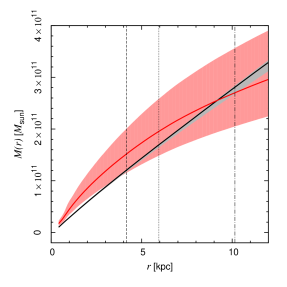
The combined analysis of SDSS J0728 has provided us with the total mass density profile of this galaxy within its inner regions. As discussed in the previous Section, and visualized in Fig. 9, the luminous component alone cannot account for this mass profile over the entire radial range, even if its contribution is maximized (unless the stellar mass-to-light ratio changes with radius in a very fine-tuned manner). One, therefore, needs to invoke an additional mass component characterized by the specific profile that complements the luminous distribution. Interestingly, we find that the mass distribution of this dark component can be consistent with a NFW halo profile.
To show this, we attempt to describe the (spherically-averaged) total mass distribution of the galaxy as the sum of the luminous component, calculated as before from the recovered stellar DF, and a dark component modelled as a standard NFW halo, i.e.
| (6) |
where is the critical density, the characteristic overdensity of the halo is a dimensionless parameter connected to the halo concentration by the relation
| (7) |
and denotes the break radius. We adopt kpc, based on the Gavazzi et al. (2007) weak lensing analysis of the SLACS sample and the consideration that SDSS J0728 is slightly less massive than the average SLACS system (for which km s-1).
We then determine the (non-negative) normalization coefficients for the dark and luminous distribution which allow to best reproduce (in a least-square sense) the total mass profile of the galaxy. Remarkably — despite the fact that the only two free parameters here are the rescaling factors — the superposition of these two simple components proves to be enough to reproduce the total profile with great accuracy over the whole radial range covered by the observations, as shown in Fig. 10. Moreover, the combined profile remains consistent with the one predicted by a nearly isothermal density distribution even beyond kpc and up to the break radius.
The luminous profile obtained in this way almost coincides with the one determined by means of the maximum bulge approach, with , while the normalization for the dark halo profile translates into a concentration parameter , from which one infers a virial radius kpc and a halo mass . This is a mildly high value for the concentration when compared with the range obtained from numerical simulations of relaxed dark matter haloes of corresponding mass (see in particular Macciò, Dutton, & van den Bosch, 2008). However, concentrations higher than the theoretical predictions are found in dynamical studies of slow-rotating early-type galaxies (see e.g. Romanowsky, 2010, and references therein). We note that, in our case, lower concentrations are obtained by setting a larger value for the break radius, e.g. for kpc, while the fit to the total mass profile becomes only slightly worse, with discrepancy of a few percent.
4 Conclusions
We have carried out a detailed study of the mass profile and dynamical structure of the inner regions of the early-type lens galaxy SDSS J0728, located at a redshift , using a composite data set consisting of HST/ACS high-resolution imaging and two-dimensional kinematic maps constructed from long-slit spectroscopic observations obtained with the Keck instrument LRIS (the slit — aligned with the galaxy major axis — has been positioned at three different heights along the minor axis, allowing to mimic integral-field spectroscopy). We have modelled the system by making use of the cauldron code for combined gravitational lensing and stellar dynamics analysis, which operates under the assumptions of axial symmetry and two-integral stellar DF. With respect to sample studies of the SLACS lens galaxies such as Koopmans et al. (2009), the approach used here presents a number of improvements: it employs a self-consistent framework where the same total potential is used for both lensing and dynamics; it allows one to construct genuine axisymmetric dynamical models (albeit restricted to two integrals of motions); it extracts much more information from the data set, making use — in addition to the lensed image — of the lens galaxy surface brightness and velocity moments maps rather than being limited to a single measure of SDSS velocity dispersion. This permits a much greater level of detail to be recovered when modelling the system.
SDSS J0728 is the first galaxy for which it has been possible to conduct this kind of in-depth combined analysis by taking advantage of a kinematic data set that extends well past the effective radius: the outermost pixels of the velocity moments maps probe a region up to a distance of about arcsec from the center, corresponding to . For comparison, in the sample of six SLACS lens galaxies examined in B09, the outermost boundary of the kinematic maps (obtained with VLT VIMOS integral-field spectroscopy) is in the range , with the single exception of system SDSS J0959 for which exceeds the effective radius of about per cent.
The main results of the analysis are summarized and discussed below:
-
1.
The total mass density profile of the galaxy inner regions, up to a radius of 1.7 , is found to be satisfactorily described by a simple axisymmetric distribution , with a logarithmic slope (99 % CL). This is very close to the isothermal profile (i.e. ), which seems to be an ubiquitous characteristic of early-type galaxies at least up to redshift , as revealed by a number of dynamics, X-ray and combined lensing and dynamics studies (see e.g. Kronawitter et al. 2000, Gerhard et al. 2001, Humphrey & Buote 2010, Koopmans et al. 2009 and references therein). Moreover, weak lensing studies show that the total density profile remains consistent with being isothermal also well beyond the galaxy inner regions, up to radial distances of about 100 effective radii (Gavazzi et al., 2007).
The physical mechanisms which cause the total density distribution to be shaped into this particular structure, with little but non negligible intrinsic scattering ( per cent in , see B09 and Koopmans et al. 2009), are not well understood. The apparent “conspiracy” between the luminous and dark components to generate a nearly isothermal combined profile appears even more surprising when considering that numerical simulations including gas dynamics find dark matter density profiles which depend both on the amount of baryons and on the details of the assembly processes (see e.g. Tissera et al., 2009; Abadi et al., 2009).
Interestingly, despite the predicted complications, for SDSS J0728 we find that it is possible to reproduce very accurately the (spherically averaged) total mass distribution by combining two very intuitive and simple building blocks: (1) the luminous mass profile obtained from the stellar DF, almost maximally rescaled and (2) a NFW dark matter halo (with a break radius kpc and a concentration parameter ).
-
2.
We find the total density distribution to be quite flattened within the probed region, with an axial ratio , which is flatter than the axial ratio of the luminous distribution (obtained by using the best model recovered inclination to deproject the two-dimensional isophotal axial ratio). This characteristic differentiates SDSS J0728 from the six lens galaxies studied in B09, for which .
-
3.
The system is characterized by a very mild anisotropy . On examining the dynamical structure of the galaxy by means of the map, one notices that the contribution of ordered motions becomes more important outside the inner regions, which determines the moderately high value for the dimensionless angular momentum parameter. This result is obtained by integrating within a cylindrical region of radius and height equal to . If the integration is limited to , in order to allow a direct comparison with results of B09, one finds a lower , fully consistent with the typical values obtained for the galaxies in that sample (with the exception of the clearly fast-rotating SDSS J0959).
-
4.
Under the assumptions of maximum bulge and position-independent stellar mass-to-light ratio, we determine for the dark matter fraction a lower limit of 28 per cent within the spherical radius . Within kpc, i.e. the approximate extension of the area directly probed by the kinematic data, the contribution of the dark matter to the total cumulative mass is about 40 per cent, almost matching the luminous component. This is in agreement with the findings of dynamical studies of nearby ellipticals (Gerhard et al., 2001; Cappellari et al., 2006; Thomas et al., 2007a) as well as with the combined lensing and dynamics analysis of six SLACS galaxies at (Czoske et al. 2008, B09). Interestingly, numerical simulations of early-type galaxy formation from cosmological initial conditions also predict a dark matter fraction of about per cent within this radius (Naab et al., 2007).
In alternative to the previous approach, we have also rescaled the luminous profile by using the stellar masses calculated from the Auger et al. (2009) stellar population analysis. The obtained luminous mass distribution is too high in the case of a Salpeter IMF, exceeding the total mass in places, while for a Chabrier IMF it remains lower than and, moreover, close to the profile predicted under the maximum bulge hypothesis. This suggests, in agreement with the conclusions of Treu et al. (2010), that a Chabrier functional form might be more suited to describe the IMF for less massive early-type galaxies such as SDSS J0728.
In order to further test if this description is correct, we plan to extend this study to a wider sample of SLACS lens galaxies, covering a broad range of velocity dispersions km s-1, for which two-dimensional kinematic data sets are available.
In conclusion, despite being located at a redshift greater than , the system SDSS J0728 shows structural characteristics — namely nearly isothermal total density profile, dark matter fraction, anisotropy parameter , local ratio of ordered to random motions — broadly consistent with what is observed in the nearby Universe for early-type galaxies of comparable luminosity and velocity dispersion (e.g. Gerhard et al. 2001, Thomas et al. 2007a, Cappellari et al. 2007). The upper limit for the B-band stellar mass-to-light ratio, obtained from the maximum bulge assumption, is also in line with the values determined for local ellipticals (e.g. Kronawitter et al., 2000), once the ageing of the stellar populations is taken into account. This study, therefore, provides an indication that the density profile as well as the global dynamical structure of the inner regions of massive ellipticals did not undergo any dramatic change or significant evolution across the last two billion years.
Acknowledgments
M.B. is grateful to Phil Marshall and Simona Vegetti for useful discussion and to Farhan Feroz for his help with MultiNest. M.B. acknowledges support from the Department of Energy contract DE-AC02-76SF00515. T.T. acknowledges support from the NSF through CAREER award NSF-0642621, and from the Packard Foundation through a Packard Fellowship. L.K. is supported through an NWO-VIDI program subsidy (project number 639.042.505). Some of the data presented herein were obtained at the W.M. Keck Observatory, which is operated as a scientific partnership among the California Institute of Technology, the University of California and the National Aeronautics and Space Administration. The Observatory was made possible by the generous financial support of the W.M. Keck Foundation. The authors wish to recognize and acknowledge the very significant cultural role and reverence that the summit of Mauna Kea has always had within the indigenous Hawaiian community. We are most fortunate to have the opportunity to conduct observations from this mountain. This paper is also based on observations made with the NASA/ESA Hubble Space Telescope, obtained from the data archive at the Space Telescope Institute. STScI is operated by the association of Universities for Research in Astronomy, Inc. under the NASA contract NAS 5-26555. This work was supported by NASA through HST grants GO-10886 and 11202.
References
- Abadi et al. (2009) Abadi, M. G., Navarro, J. F., Fardal, M., Babul, A., & Steinmetz, M. 2009, arXiv:astro-ph/0902.2477
- Auger et al. (2009) Auger, M. W., Treu, T., Bolton, A. S., Gavazzi, R., Koopmans, L. V. E., Marshall, P. J., Bundy, K., & Moustakas, L. A. 2009, ApJ, 705, 1099
- Barnabè et al. (2009a) Barnabè, M., Czoske, O., Koopmans, L. V. E., Treu, T., Bolton, A. S., & Gavazzi, R. 2009a, MNRAS, 399, 21
- Barnabè & Koopmans (2007) Barnabè, M., & Koopmans, L. V. E. 2007, ApJ, 666, 726
- Barnabè et al. (2009b) Barnabè, M., Nipoti, C., Koopmans, L. V. E., Vegetti, S., & Ciotti, L. 2009b, MNRAS, 393, 1114
- Binney & Tremaine (2008) Binney, J., & Tremaine, S. 2008, Galactic Dynamics (Princeton University Press)
- Bolton et al. (2008a) Bolton, A. S., Burles, S., Koopmans, L. V. E., Treu, T., Gavazzi, R., Moustakas, L. A., Wayth, R., & Schlegel, D. J. 2008a, ApJ, 682, 964
- Bolton et al. (2006) Bolton, A. S., Burles, S., Koopmans, L. V. E., Treu, T., & Moustakas, L. A. 2006, ApJ, 638, 703
- Bolton et al. (2008b) Bolton, A. S., Treu, T., Koopmans, L. V. E., Gavazzi, R., Moustakas, L. A., Burles, S., Schlegel, D. J., & Wayth, R. 2008b, ApJ, 684, 248
- Borriello et al. (2003) Borriello, A., Salucci, P., & Danese, L. 2003, MNRAS, 341, 1109
- Bruzual & Charlot (2003) Bruzual, G., & Charlot, S. 2003, MNRAS, 344, 1000
- Cappellari et al. (2006) Cappellari, M. et al. 2006, MNRAS, 366, 1126
- Cappellari et al. (2007) —. 2007, MNRAS, 379, 418
- Chabrier (2003) Chabrier, G. 2003, PASP, 115, 763
- Chandrasekhar (1969) Chandrasekhar, S. 1969, Ellipsoidal Figures of Equilibrium (Yale University Press)
- Côté et al. (2003) Côté, P., McLaughlin, D. E., Cohen, J. G., & Blakeslee, J. P. 2003, ApJ, 591, 850
- Cretton et al. (1999) Cretton, N., de Zeeuw, P. T., van der Marel, R. P., & Rix, H.-W. 1999, ApJS, 124, 383
- Czoske et al. (2008) Czoske, O., Barnabè, M., Koopmans, L. V. E., Treu, T., & Bolton, A. S. 2008, MNRAS, 384, 987
- de Lorenzi et al. (2008) de Lorenzi, F., Gerhard, O., Saglia, R. P., Sambhus, N., Debattista, V. P., Pannella, M., & Méndez, R. H. 2008, MNRAS, 385, 1729
- Falco et al. (1985) Falco, E. E., Gorenstein, M. V., & Shapiro, I. I. 1985, ApJ, 289, L1
- Feroz & Hobson (2008) Feroz, F., & Hobson, M. P. 2008, MNRAS, 384, 449
- Feroz et al. (2009) Feroz, F., Hobson, M. P., & Bridges, M. 2009, MNRAS, 398, 1601
- Franx et al. (1994) Franx, M., van Gorkom, J. H., & de Zeeuw, T. 1994, ApJ, 436, 642
- Fukazawa et al. (2006) Fukazawa, Y., Botoya-Nonesa, J. G., Pu, J., Ohto, A., & Kawano, N. 2006, ApJ, 636, 698
- Fukugita et al. (1998) Fukugita, M., Hogan, C. J., & Peebles, P. J. E. 1998, ApJ, 503, 518
- Gavazzi et al. (2008) Gavazzi, R., Treu, T., Koopmans, L. V. E., Bolton, A. S., Moustakas, L. A., Burles, S., & Marshall, P. J. 2008, ApJ, 677, 1046
- Gavazzi et al. (2007) Gavazzi, R., Treu, T., Rhodes, J. D., Koopmans, L. V. E., Bolton, A. S., Burles, S., Massey, R. J., & Moustakas, L. A. 2007, ApJ, 667, 176
- Gerhard et al. (2001) Gerhard, O., Kronawitter, A., Saglia, R. P., & Bender, R. 2001, AJ, 121, 1936
- Gerhard (1993) Gerhard, O. E. 1993, MNRAS, 265, 213
- Grillo et al. (2010) Grillo, C., Eichner, T., Seitz, S., Bender, R., Lombardi, M., Gobat, R., & Bauer, A. 2010, ApJ, 710, 372
- Humphrey & Buote (2010) Humphrey, P. J., & Buote, D. A. 2010, MNRAS, 135
- Humphrey et al. (2006) Humphrey, P. J., Buote, D. A., Gastaldello, F., Zappacosta, L., Bullock, J. S., Brighenti, F., & Mathews, W. G. 2006, ApJ, 646, 899
- Jiang & Kochanek (2007) Jiang, G., & Kochanek, C. S. 2007, ApJ, 671, 1568
- Kochanek (1991) Kochanek, C. S. 1991, ApJ, 373, 354
- Koopmans et al. (2009) Koopmans, L. V. E. et al. 2009, ApJ, 703, L51
- Koopmans & Treu (2002) Koopmans, L. V. E., & Treu, T. 2002, ApJ, 568, L5
- Koopmans & Treu (2003) —. 2003, ApJ, 583, 606
- Koopmans et al. (2006) Koopmans, L. V. E., Treu, T., Bolton, A. S., Burles, S., & Moustakas, L. A. 2006, ApJ, 649, 599
- Kronawitter et al. (2000) Kronawitter, A., Saglia, R. P., Gerhard, O., & Bender, R. 2000, A&AS, 144, 53
- Loewenstein & White (1999) Loewenstein, M., & White, R. E. 1999, ApJ, 518, 50
- Łokas & Mamon (2003) Łokas, E. L., & Mamon, G. A. 2003, MNRAS, 343, 401
- Macciò et al. (2008) Macciò, A. V., Dutton, A. A., & van den Bosch, F. C. 2008, MNRAS, 391, 1940
- MacKay (1999) MacKay, D. J. C. 1999, Neural Comp, 11, 1035
- MacKay (2003) —. 2003, Information Theory, Inference and Learning Algorithms (Cambridge University Press)
- Maraston (2005) Maraston, C. 2005, MNRAS, 362, 799
- Marshall et al. (2007) Marshall, P. J. et al. 2007, ApJ, 671, 1196
- Matsushita et al. (1998) Matsushita, K., Makishima, K., Ikebe, Y., Rokutanda, E., Yamasaki, N., & Ohashi, T. 1998, ApJ, 499, L13
- Naab et al. (2007) Naab, T., Johansson, P. H., Ostriker, J. P., & Efstathiou, G. 2007, ApJ, 658, 710
- Navarro et al. (1996) Navarro, J. F., Frenk, C. S., & White, S. D. M. 1996, ApJ, 462, 563
- Navarro et al. (1997) —. 1997, ApJ, 490, 493
- Oke et al. (1995) Oke, J. B. et al. 1995, PASP, 107, 375
- Padmanabhan et al. (2004) Padmanabhan, N. et al. 2004, New Astronomy, 9, 329
- Rix et al. (1997) Rix, H.-W., de Zeeuw, P. T., Cretton, N., van der Marel, R. P., & Carollo, C. M. 1997, ApJ, 488, 702
- Romanowsky (2010) Romanowsky, A. J. 2010, arXiv:astro-ph/1001.3138
- Romanowsky et al. (2003) Romanowsky, A. J., Douglas, N. G., Arnaboldi, M., Kuijken, K., Merrifield, M. R., Napolitano, N. R., Capaccioli, M., & Freeman, K. C. 2003, Science, 301, 1696
- Rusin & Kochanek (2005) Rusin, D., & Kochanek, C. S. 2005, ApJ, 623, 666
- Saglia et al. (1992) Saglia, R. P., Bertin, G., & Stiavelli, M. 1992, ApJ, 384, 433
- Salpeter (1955) Salpeter, E. E. 1955, ApJ, 121, 161
- Schwarzschild (1979) Schwarzschild, M. 1979, ApJ, 232, 236
- Skilling (2004) Skilling, J. 2004, in American Institute of Physics Conference Series, Vol. 735, American Institute of Physics Conference Series, ed. R. Fischer, R. Preuss, & U. V. Toussaint, 395–405
- Suyu et al. (2010) Suyu, S. H., Marshall, P. J., Auger, M. W., Hilbert, S., Blandford, R. D., Koopmans, L. V. E., Fassnacht, C. D., & Treu, T. 2010, ApJ, 711, 201
- Thomas et al. (2007a) Thomas, J., Jesseit, R., Naab, T., Saglia, R. P., Burkert, A., & Bender, R. 2007a, MNRAS, 381, 1672
- Thomas et al. (2009) Thomas, J. et al. 2009, MNRAS, 393, 641
- Thomas et al. (2007b) Thomas, J., Saglia, R. P., Bender, R., Thomas, D., Gebhardt, K., Magorrian, J., Corsini, E. M., & Wegner, G. 2007b, MNRAS, 382, 657
- Tissera et al. (2009) Tissera, P. B., White, S. D. M., Pedrosa, S., & Scannapieco, C. 2009, MNRAS, submitted
- Tortora et al. (2009) Tortora, C., Napolitano, N. R., Romanowsky, A. J., Capaccioli, M., & Covone, G. 2009, MNRAS, 396, 1132
- Treu et al. (2010) Treu, T., Auger, M. W., Koopmans, L. V. E., Gavazzi, R., Marshall, P. J., & Bolton, A. S. 2010, ApJ, 709, 1195
- Treu et al. (2009) Treu, T., Gavazzi, R., Gorecki, A., Marshall, P. J., Koopmans, L. V. E., Bolton, A. S., Moustakas, L. A., & Burles, S. 2009, ApJ, 690, 670
- Treu & Koopmans (2002a) Treu, T., & Koopmans, L. V. E. 2002a, MNRAS, 337, L6
- Treu & Koopmans (2002b) —. 2002b, ApJ, 575, 87
- Treu & Koopmans (2004) —. 2004, ApJ, 611, 739
- Treu et al. (2006) Treu, T., Koopmans, L. V. E., Bolton, A. S., Burles, S., & Moustakas, L. 2006, ApJ, 640, 662
- Treu et al. (2002) Treu, T., Stiavelli, M., Casertano, S., Møller, P., & Bertin, G. 2002, ApJ, 564, L13
- Trott et al. (2010) Trott, C. M., Treu, T., Koopmans, L. V. E., & Webster, R. L. 2010, MNRAS, 401, 1540
- Trujillo et al. (2004) Trujillo, I., Burkert, A., & Bell, E. F. 2004, ApJ, 600, L39
- Turner et al. (1984) Turner, E. L., Ostriker, J. P., & Gott, III, J. R. 1984, ApJ, 284, 1
- van de Ven et al. (2008) van de Ven, G., Falcon-Barroso, J., McDermid, R. M., Cappellari, M., Miller, B. W., & de Zeeuw, P. T. 2008, arXiv:astro-ph/0807.4175
- van den Bosch et al. (2008) van den Bosch, R. C. E., van de Ven, G., Verolme, E. K., Cappellari, M., & de Zeeuw, P. T. 2008, MNRAS, 385, 647
- van der Marel & Franx (1993) van der Marel, R. P., & Franx, M. 1993, ApJ, 407, 525
- Verolme & de Zeeuw (2002) Verolme, E. K., & de Zeeuw, P. T. 2002, MNRAS, 331, 959
- Warren & Dye (2003) Warren, S. J., & Dye, S. 2003, ApJ, 590, 673
- Weijmans et al. (2009) Weijmans, A. et al. 2009, MNRAS, 398, 561
- Weijmans et al. (2008) Weijmans, A., Krajnović, D., van de Ven, G., Oosterloo, T. A., Morganti, R., & de Zeeuw, P. T. 2008, MNRAS, 383, 1343
- Wucknitz (2002) Wucknitz, O. 2002, MNRAS, 332, 951