0059
Irina Marinova;
Barred disks in dense environments
Abstract
We investigate the properties of bright () barred and unbarred disks in the Abell 901/902 cluster system at 0.165 with the STAGES HST ACS survey. To identify and characterize bars, we use ellipse-fitting. We use visual classification, a Sérsic cut, and a color cut to select disk galaxies, and find that the latter two methods miss 31% and 51%, respectively of disk galaxies identified through visual classification. This underscores the importance of carefully selecting the disk sample in cluster environments. However, we find that the global optical bar fraction in the clusters is 30% regardless of the method of disk selection. We study the relationship of the optical bar fraction to host galaxy properties, and find that the optical bar fraction depends strongly on the luminosity of the galaxy and whether it hosts a prominent bulge or is bulgeless. Within a given absolute magnitude bin, the optical bar fraction increases for galaxies with no significant bulge component. Within each morphological type bin, the optical bar fraction increases for brighter galaxies. We find no strong trend (variations larger than a factor of 1.3) for the optical bar fraction with local density within the cluster between the core and virial radius ( 0.25 to 1.2 Mpc). We discuss the implications of our results for the evolution of bars and disks in dense environments.
keywords:
galaxies: clusters: individual: Abell 901/902 – galaxies: evolution – Galaxies: spiral – galaxies: structure1 Introduction
Mounting evidence suggests that a dominant fraction of bulges in fairly massive ( M⊙) 0 galaxies (e.g., Weinzirl et al. 2009) as well as the bulk of the cosmic star formation rate density since 1 in intermediate and high mass galaxies, are not triggered by ongoing major mergers (Hammer et al., 2005; Wolf et al., 2005; Bell et al., 2005; Jogee, 2009; Jogee et al., 2009) but are likely related to a combination of minor mergers and internally-driven secular processes
Barred disks have been studied extensively in the nearby universe. Quantitative methods show that approximately 45% of disk galaxies are barred in the optical at 0 (Marinova & Jogee, 2007; Reese et al., 2007; Barazza et al., 2008; Aguerri et al., 2009). Bars drive gas to the centers of galaxies, where powerful starbursts can be ignited (Schwarz, 1981; Kormendy & Kennicutt, 2004; Jogee et al., 2005; Sheth et al., 2005). These starbursts caused by bar-driven inflow may help build up central, high , stellar concentrations called disky bulges or pseudobulges (Kormendy, 1982, 1993; Jogee et al., 2005; Weinzirl et al., 2009). Bars can also create boxy/peanut bulges through vertical buckling (Bureau & Freeman, 1999; Athanassoula, 2005; Martinez-Valpuesta et al., 2006) and resonance scattering (Combes & Sanders, 1981; Combes et al., 1990).
But what is the relationship between bar-driven secular evolution and environmental effects? Little is known about barred galaxies in dense environments, as the situation is complicated by the relative importance of processes such as ram pressure stripping, galaxy tidal interactions, mergers, and galaxy harassment. In addition, further complications are introduced by the fact that the bar fraction and properties in clusters depend on the epoch of bar formation and the evolutionary history of clusters. We explore these questions using the Space Telescope Abell 901/902 Galaxy Evolution Survey (STAGES; Gray et al., 2009).
2 Data and sample
The main data for this study comes from the STAGES survey degree HST/ACS F606W mosaic of the Abell 901/902 cluster system at 0.165. Spectro-photometric redshifts for all galaxies are available from the COMBO-17 survey (Wolf et al., 2004), with an accuracy of 0.01 for the sample used in this study. In addition, X-ray maps of the intra-cluster medium (ICM) density from XMM-Newton, UV from GALEX, Spitzer 24m coverage, dark matter maps from weak lensing (Heymans et al., 2008), and stellar masses (Borch et al., 2006) are available for this field.
We use the spectro-photometric redshifts to select a sample of 785 bright (), cluster galaxies. The point spread function (PSF) for the ACS images is , corresponding to 282 pc at 0.165111We assume in this paper a flat cosmology with and =70 km s-1 Mpc-1.. While this resolution is sufficient for detecting primary bars in spiral galaxies, bars in dwarf galaxies may often be smaller than the detection limit (Sect. 3). Therefore, in this study we focus on galaxies brighter than to avoid dwarf galaxies, to keep field contamination low ( 10%; Wolf et al., 2005), and to maintain adequate resolution for bar detection through ellipse-fitting. From the 785 bright cluster galaxies we are able to ellipse-fit 762 (97%; Sect. 3.2). This is the total sample from which all other subsamples are derived in the subsequent analysis.
3 Method
3.1 Selecting disk galaxies
Because bars are a disk phenomenon, the bar fraction is defined as the number of barred disk galaxies over the total number of disk galaxies:
| (1) |
For this reason, it is necessary to select a sample of disk galaxies from our total cluster sample.
We compare three widely used methods of selecting disk galaxies: visual classification, blue-cloud cut, and Sérsic cut. We visually classify all galaxies in the sample into broad bins of : ‘pure bulge’, ‘bulge+disk’, and ‘pure disk’. For the blue-cloud cut, only galaxies on the blue cloud in color-magnitude space are selected as disks. For the Sérsic cut, only galaxies with single-component Sérsic index are selected as disks.
3.2 Identifying and characterizing bars
We use ellipse-fitting to identify and characterize bars (e.g., Wozniak et al., 1995; Friedli et al., 1996; Jogee et al., 2004; Knapen et al., 2000; Sheth et al., 2003; Marinova & Jogee, 2007). We use the standard IRAF task ‘ellipse’ to fit isophotes to each galaxy out to a radius where the surface brightness reaches sky level. We generate radial profiles of the surface brightness, ellipticity (), and position angle (PA), as well as overlays of the fitted ellipses onto the galaxy images. We use the radial profiles and overlays (as an extra check) to classify galaxies as highly inclined (), unbarred, or barred. A galaxy is classified as barred if (a) the profile rises to a global maximum () while the PA stays constant and (b) after the global maximum near the bar end, drops and the PA changes indicating the outer disk region. We do not attempt to classify highly inclined () galaxies as barred or unbarred with ellipse-fitting. However, morphological features such as bars and spiral arms are classified regardless of inclination during visual classification of the sample.
After excluding highly inclined galaxies (226 or 37%) and those with poor fits (32 or 5%), we are left with 350 moderately inclined (), bright (), ellipse-fitted, visually-identified disk galaxies. To ensure adequate resolution for bar identification, we make a cut in disk size of 3 kpc. This reduces our sample by 10 galaxies, leaving us with 340 bright, moderately inclined, ellipse-fitted, visually-identified disk galaxies.
4 Results
4.1 Disk selection
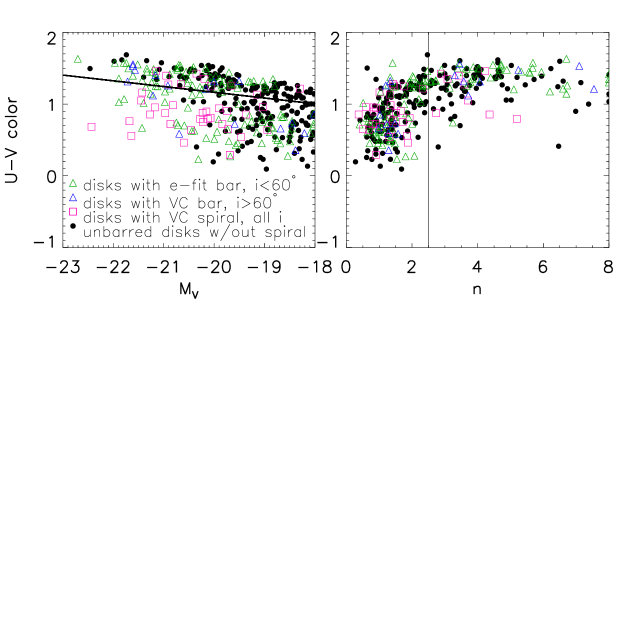
We compare three widely used methods of disk selection: Sérsic cut, blue-cloud cut, and visual classification. The three methods pick out 467, 341, and 608 ellipse-fitted disk galaxies, respectively. Fig. 1a shows that when a Sérsic cut is used, 31% of disk galaxies are missed compared to visual classification. This underscores the difficulty in selecting disks using Sérsic and color cuts, because of the prevalence of S0s and red spirals in low-z cluster environments. When a blue-cloud cut is used (Fig. 1b), 51% of visually-identified disk galaxies are missed. There is inherent difficulty in distinguishing unbarred disk galaxies without spiral arms from spheroids using visual classification. We can obtain a lower limit to how many galaxies are disks in the red sample or with , by only considering galaxies exhibiting unambiguous disk signatures such as bars and spiral arms. We find that at least 25% (67/267) of galaxies with and 22% (84/390) of galaxies on the red sample exhibit such features.
4.2 Optical bar fraction
For moderately inclined disks, the three methods of disk selection yield a similar global optical bar fraction () of 34%, 31%, and 30%, respectively. However, the global optical bar fraction may not reveal the full picture, as there is evidence that in the field, the optical bar fraction is a function of , and possibly color (Barazza et al., 2008; Aguerri et al., 2009). We therefore explore how the optical bar fraction varies as a function of and qualitative measures of in the Abell 901/902 cluster system. We note that while we did not quantitatively measure in the sample, we visually classified the extreme ends of the distribution into the broad classes described above. Table 1 shows that in the cluster, the optical bar fraction is a strong function of and absolute magnitude. At a given morphological type, rises for brighter galaxies. At a given , rises for ‘pure disk’ galaxies.
| range | Bulge+Disk | Pure Disk |
|---|---|---|
| 13% (8/63) | 39% (16/41) | |
| 19% (17/88) | 59% (16/27) | |
| 40% (29/73) | 63% (5/8) | |
| 63% (22/35) | — |

The result that rises toward disk-dominated galaxies may be interpreted in the context of bar formation models. If bars form and grow through the swing amplification, a large bulge that leads to an inner Lindblad resonance (ILR) may inhibit bar formation by cutting off the feedback loop. Early simulations with rigid halos suggested that a hot DM halo component can inhibit the formation of a bar (e.g., Ostriker & Peebles, 1973). However, more recent simulations with live halos show that bars grow through the exchange of angular momentum with the DM halo (Debattista & Sellwood, 1998, 2000; Athanassoula, 2003). These studies suggest that the evolution of the bar is intimately tied to the mass distribution of the DM halo within the radius of the galaxy disk. If fainter galaxies have more dominant DM halos (e.g., Persic et al., 1996; Kassin et al., 2006), bars may develop and grow more slowly in these galaxies, however in the end, they may be stronger.
4.3 Bars as a function of local density
How does the optical bar fraction vary as a function of local density in the cluster? We use four available measures of local density: projected distance to nearest cluster center, , , and ICM density. is line-of-sight projected surface mass density, and is the local galaxy number density. Figure 2 shows that the optical bar fraction varies at most by a factor of 1.3 between the core and virial radius of the clusters. Our results agree with Aguerri et al. (2009) who find no dependence of the optical bar fraction on local environment density, over a wide range of environments comparable to the outer region and outskirt of our cluster sample. Theoretical models of bar formation in a cosmological context, suggest that interaction with the halo sub-structure induces bars (Romano-Díaz et al., 2008). Because this substructure is present in all environments, these models imply a similar bar fraction across a large range of environment densities, which is consistent with our results.
In the core, our data does not allow a firm conclusion, because the four tracers of local density show opposing trends, projection effects become severe, and number statistics are low. Previous studies using visual identification of bars have argued that the optical bar fraction increases in the Coma and Virgo cluster cores (Thompson, 1981; Andersen, 1996). If this trend is real, it could be caused by competing effects. Our results suggest that because bulge-dominated galaxies, which are prevalent in cluster cores, host a lower fraction of bars, the bar fraction should decrease there. However, the high velocity dispersion in the core regions favors numerous, short-lived, tidal interactions, which may increase the bar fraction, while preserving intact the galaxy disk.
Acknowledgements.
IM, SJ, and AH acknowledge support from NSF grant AST 06-07748, NASA LTSA grant NAG5-13063, as well as HST G0-10395.References
- Aguerri et al. (2009) Aguerri, J. A. L., Mendez-Abreu, J., & Corsini, E. M. 2009, A&A, 495, 491
- Andersen (1996) Andersen, V. 1996, AJ, 111, 1805
- Athanassoula (2003) Athanassoula, E. 2003, MNRAS, 341, 1179
- Athanassoula (2005) Athanassoula, E. 2005, MNRAS, 358, 1477
- Barazza et al. (2008) Barazza, F. D., Jogee, S., & Marinova, I. 2008, ApJ, 675, 1194
- Bell et al. (2005) Bell, E. F., Papovich, C. Wolf, C., et al. 2005, ApJ, 625, 23
- Borch et al. (2006) Borch, A., Meisenheimer, K., Bell, E. F., et al. 2006, A&A, 453, 869
- Bureau & Freeman (1999) Bureau, M., & Freeman, K. C. 1999, AJ, 118, 126
- Combes & Sanders (1981) Combes, F., & Sanders, R. H. 1981, A&A, 96, 164
- Combes et al. (1990) Combes, F., Debbasch, F., Friedli, D., & Pfenniger, D. 1990, A&A, 233, 82
- Debattista & Sellwood (1998) Debattista, V. P., & Sellwood, J. A. 1998, ApJ, 493, L5
- Debattista & Sellwood (2000) Debattista, V. P., & Sellwood, J. A. 2000, ApJ, 543, 704
- Friedli et al. (1996) Friedli, D., Wozniak, H., Rieke, M., Martinet, L., & Bratschi, P. 1996, A&AS, 118, 461
- Gray et al. (2009) Gray, M. E. Wolf, C. Barden, M., et al. 2009, MNRAS, 393, 1275
- Hammer et al. (2005) Hammer, F., Flores, H., Elbaz, D., Zheng, X. Z., Liang, Y. C., & Cesarsky, C. 2005, A&A, 430, 115
- Heymans et al. (2008) Heymans, C., Gray, M. E., Peng, C. Y., et al. 2008, MNRAS, 385, 1431
- Jogee (2009) Jogee, S., in The Galaxy Disk in a Cosmological Context, IAU Symp. 254, ed. J. Andersen, J. Bland-Hawthorn, & B. Nordstrom (Cambridge Univ. Press, Cambridge), 67
- Jogee et al. (2004) Jogee, S., Barazza, F., Rix, H.-W., Shlosman, I. et al. 2004a, ApJ, 615, L105
- Jogee et al. (2005) Jogee, S., Scoville, N., & Kenney, J. D. P. 2005, ApJ, 630, 837
- Jogee et al. (2009) Jogee, S., Miller, S. H., Penner, K., et al. 2009, ApJ, 697, 1971
- Kassin et al. (2006) Kassin, S. A., de Jong, R. S., & Weiner, B. J. 2006, ApJ, 643, 804
- Knapen et al. (2000) Knapen, J. H., Shlosman, I., & Peletier, R. F. 2000, ApJ, 529, 93
- Kormendy (1982) Kormendy, J. 1982, ApJ, 257, 75
- Kormendy (1993) Kormendy, J. 1993, in Galactic Bulges, IAU Symp. 153, ed. H. De Jonghe, & H. J. Habing (Kuwler, Dordrecht), 209
- Kormendy & Kennicutt (2004) Kormendy, J., & Kennicutt, R. C. 2004, ARA&A, 42, 603
- Marinova & Jogee (2007) Marinova, I., & Jogee, S. 2007, ApJ, 659, 1176
- Martinez-Valpuesta et al. (2006) Martinez-Valpuesta, I., Shlosman, I., & Heller, C. 2006, ApJ, 637, 214
- Ostriker & Peebles (1973) Ostriker, J. P., & Peebles, P. J. E. 1973, ApJ, 186, 467
- Persic et al. (1996) Persic, M., Salucci, P., & Stel, F. 1996, MNRAS, 281, 27
- Reese et al. (2007) Reese, A. S., Williams, T. B., Sellwood, J. A., Barnes, E. I., & Powell, B. A. 2007, AJ, 133, 2846
- Schwarz (1981) Schwarz, M. P. 1981, ApJ, 247, 77
- Sheth et al. (2003) Sheth, K., Regan, M. W., Scoville, N. Z., & Strubbe, L. E. 2003, ApJ, 592, L13
- Sheth et al. (2005) Sheth, K., Vogel, S. N., Regan, M. W., Thornley, M. D., & Teuben, P. J. 2005, ApJ, 632, 217
- Romano-Díaz et al. (2008) Romano-Díaz, E., Shlosman, I., Heller, C., & Hoffman, Y. 2008, ApJ, 687, L13
- Thompson (1981) Thompson, L. A. 1981, ApJ, 244, L43
- Weinzirl et al. (2009) Weinzirl, T., Jogee, S., Khochfar, S., Burkert, A., & Kormendy, J. 2009, ApJ, 696, 411
- Wolf et al. (2004) Wolf, C., Meisenheimer, K., Kleinheinrich, M., et al. 2004, A&A, 421, 913
- Wolf et al. (2005) Wolf, C., Bell, E. F., McIntosh, D. H., et al. 2005, ApJ, 630, 771
- Wolf et al. (2005) Wolf, C., Gray, M. E., & Meisenheimer, K. 2005, A&A, 443, 435
- Wozniak et al. (1995) Wozniak, H., Friedli, D., Martinet, L., Martin, P., & Bratschi, P. 1995, A&AS, 111, 115