All-sky search for gravitational-wave bursts in the first joint LIGO-GEO-Virgo run
Abstract
We present results from an all-sky search for unmodeled gravitational-wave bursts in the data collected by the LIGO, GEO 600 and Virgo detectors between November 2006 and October 2007. The search is performed by three different analysis algorithms over the frequency band 50 – 6000 Hz. Data are analyzed for times with at least two of the four LIGO-Virgo detectors in coincident operation, with a total live time of 266 days. No events produced by the search algorithms survive the selection cuts. We set a frequentist upper limit on the rate of gravitational-wave bursts impinging on our network of detectors. When combined with the previous LIGO search of the data collected between November 2005 and November 2006, the upper limit on the rate of detectable gravitational-wave bursts in the 64–2048 Hz band is 2.0 events per year at 90% confidence. We also present event rate versus strength exclusion plots for several types of plausible burst waveforms. The sensitivity of the combined search is expressed in terms of the root-sum-squared strain amplitude for a variety of simulated waveforms and lies in the range Hz-1/2 to Hz-1/2. This is the first untriggered burst search to use data from the LIGO and Virgo detectors together, and the most sensitive untriggered burst search performed so far.
pacs:
04.80.Nn, 07.05.Kf, 95.30.Sf, 95.85.Sz∗The LIGO Scientific Collaboration and †The Virgo Collaboration
]Dated:
I Introduction
The LIGO Scientific Collaboration (LSC) and the Virgo Collaboration operate a network of interferometric gravitational-wave (GW) detectors with the goal of detecting gravitational waves from astrophysical sources. Some of these sources may produce transient “bursts” of GW radiation with relatively short duration (1 s). Plausible burst sources Cutler and Thorne (2002) include merging compact binary systems consisting of black holes and/or neutron stars Pretorius (2009); Etienne et al. (2008), core-collapse supernovae Ott (2009), neutron star collapse Baiotti et al. (2007), starquakes associated with magnetar flares Mereghetti (2008) or pulsar glitches Andersson and Comer (2001), cosmic string cusps Damour and Vilenkin (2001), and other violent events in the Universe.
During the most recent data-taking run five GW detectors were operational. The three LIGO detectors Abbott et al. (2009a) started their Science Run 5 (S5) in November 2005, and the GEO 600 detector Grote (2008) joined the S5 run in January 2006. The Virgo detector Acernese et al. (2008) began its Virgo Science Run 1 (VSR1) in May 2007. All five instruments took data together until the beginning of October 2007.
An all-sky search for GW burst signals has already been conducted on the first calendar year of the LIGO S5 data (referred to as “S5y1”) in a wide frequency band of Hz Abbott et al. (2009b, c). In this paper, we report on a search for GW burst signals in the frequency band Hz for the rest of the S5/VSR1 run, referred to as “S5y2/VSR1”. It includes data collected by the LIGO and Virgo detectors, which had comparable sensitivities, and uses three different search algorithms. In comparison with the S5y1 analysis, the network of LIGO and Virgo detectors, spread over three sites, provides better sky coverage as well as improved capabilities to reject spurious signals. S5y2/VSR1 is also the first long-term observation with the world-wide network of interferometric detectors. This is a major step forward with respect to previous observations led by the network of resonant detectors Astone et al. (2003, 2007), since, as we will show in this paper, the performance is improved by more than one order of magnitude both in the analyzed frequency bandwidth and the level of instrumental noise.
This paper is organized as follows. In Section II we describe the LSC and Virgo instruments. In Section III we give a brief overview of the search procedure. In Section IV we present the search algorithms. Simulations are described in Section V, and the error analysis in Section VI. The results of the search are presented in Section VII, and astrophysical implications are discussed in Section VIII. The appendices provide additional details on data characterization and the analysis pipelines.
II Detectors
II.1 LIGO
LIGO consists of three detectors at two observatories in the United States. Each detector is a large Michelson-type interferometer with additional mirrors forming Fabry-Perot cavities in the arms and a power-recycling mirror in the input beam path. Interferometric sensing and feedback is used to “lock” the mirror positions and orientations to keep all of the optical cavities on resonance. A gravitational wave is sensed as a quadrupolar strain, measured interferometrically as an effective difference between the lengths of the two arms. The LIGO Hanford Observatory, in Washington, houses independent detectors with the arm lengths of 4 km and 2 km, called H1 and H2 respectively. The LIGO Livingston Observatory, in Louisiana, has a single detector with 4-km arms, called L1. The detector instrumentation and operation are described in detail elsewhere Abbott et al. (2009a), and the improvements leading up to the S5 run which are most relevant for GW burst searches have been described in the first-year search Abbott et al. (2009b).
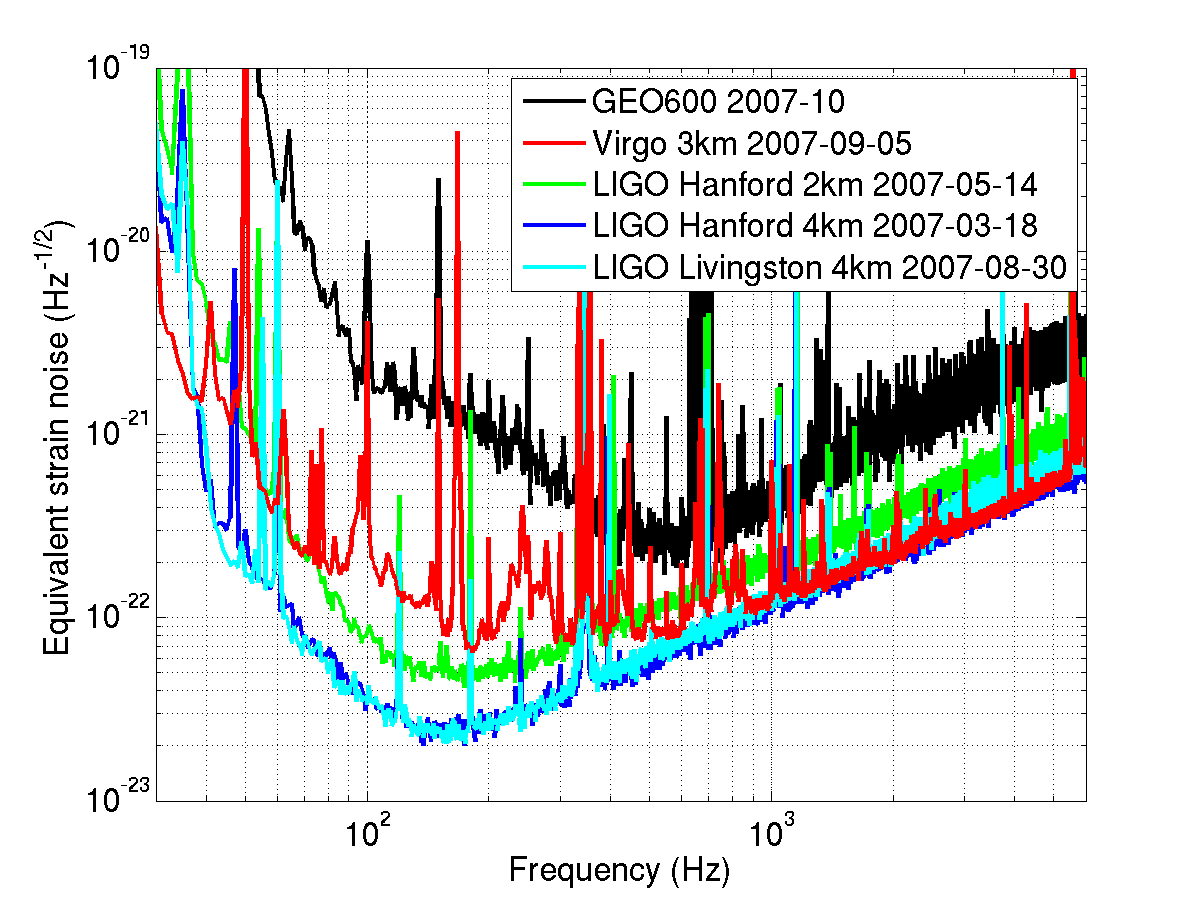
The best achieved sensitivities of the LIGO detectors during the second year of S5, as a function of signal frequency, are shown in Fig. 1. The detectors are most sensitive over a band extending from about 40 Hz to a few kHz. Seismic noise dominates at lower frequencies since the effectiveness of the seismic isolation system is a very strong function of frequency. Above 200 Hz, laser shot noise corrected for the Fabry-Perot cavity response yields an effective strain noise that rises linearly with frequency. The sensitivity at intermediate frequencies is determined mainly by thermal noise, with contributions from other sources. The peaks at 350 Hz and harmonics are the thermally-excited vibrational modes of the wires from which the large mirrors are suspended. Smaller peaks are due to other mechanical resonances, power line harmonics, and calibration signals.
Commissioning periods during the second year of S5 led to incremental improvements in the detector sensitivities. The most significant of these were in January 2007, when the seismic isolation systems at both sites were improved to reduce the coupling of microseismic noise to the mirror suspensions, thereby mitigating noise from the nonlinear Barkhausen effect Alessandro et al. (1990) in the magnets used to control the mirror positions; and in August 2007, when the L1 frequency stabilization servo was re-tuned. Overall, the average sensitivities of the H1 and L1 detectors during the second year were about 20% better than the first-year averages, while the H2 detector (less sensitive to begin with by a factor of 2) had about the same average sensitivity in both years. The operational duty cycles for all three detectors also improved as the run progressed, from (72.8%, 76.7%, 61.0%) averaged over the first year to (84.0%, 80.6%, 73.6%) averaged over the second year for H1, H2, and L1, respectively.
II.2 GEO 600
The GEO 600 detector, located near Hannover, Germany, also operated during S5, though with a lower sensitivity than the LIGO and Virgo detectors. The GEO 600 data are not used in the initial search stage of the current study as the modest gains in the sensitivity to GW signals would not offset the increased complexity of the analysis. The GEO 600 data are held in reserve, and used to follow up any detection candidates from the LIGO-Virgo analysis.
GEO 600 began its participation in S5 on January 21 2006, acquiring data during nights and weekends. Commissioning work was performed during the daytime, focussing on gaining a better understanding of the detector and improving data quality. GEO switched to full-time data taking from May 1 to October 6, 2006, then returned to night-and-weekend mode through the end of the S5 run. Overall GEO 600 collected about 415 days of science data during S5, for a duty cycle of 59.7% over the full S5 run.
II.3 Virgo
The Virgo detector Acernese et al. (2008), also called V1, is an interferometer with 3 km arms located near Pisa in Italy. One of the main instrumental differences with respect to LIGO is the seismic isolation system based on super-attenuators Braccini et al. (2005), chains of passive attenuators capable of filtering seismic disturbances in 6 degrees of freedom with sub-Hertz corner frequencies. For VSR1, the Virgo duty cycle was 81% and the longest continuous period with the mirror positions interferometrically controlled was more than hours. Another benefit from super-attenuators is a significant reduction of the detector noise at very low frequency ( Hz) where Virgo surpasses the LIGO sensitivity.
Above Hz, the spectral sensitivity achieved by Virgo during VSR1 is comparable to that of LIGO (see Figure 1). Above Hz the Virgo sensitivity is dominated by shot noise. Below Hz there is excess noise due to environmental and instrumental noise sources, and below 300 Hz these produce burst-like transients.
Due to the different orientation of its arms, the antenna pattern (angular sensitivity) of Virgo is complementary to that of the LIGO detectors, with highest response in directions of low LIGO sensitivity. Virgo therefore significantly increases the sky coverage of the network. In addition, simultaneous observations with the three LIGO-Virgo sites improve rejection of spurious signals and allow reconstruction of the sky position and waveforms of detected GW sources.
III Search Overview
The analysis described in this paper uses data from the LIGO detectors collected from 14 November 2006 through 1 October 2007 (S5y2), and Virgo data from VSR1, which started on 18 May 18 2007 and ended at the same time as S5 111This search includes several hours of data collected on 1 October 2007, after the official end of the S5 and VSR1 runs at 0:00 UTC on that day.. The procedure used for this S5y2/VSR1 search is the same as that used for S5y1 Abbott et al. (2009b). In this section we briefly review the main stages of the analysis.
III.1 Data quality flags
The detectors are occasionally affected by instrumental or data acquisition artifacts as well as by periods of degraded sensitivity or an excessive rate of transient noise due to environmental conditions such as bad weather. Low-quality data segments are tagged with Data Quality Flags (DQFs). These DQFs are divided into three categories depending on their seriousness. Category 1 DQFs are used to define the data segments processed by the analysis algorithms. Category 2 DQFs are unconditional data cuts applied to any events generated by the algorithms. Category 3 DQFs define the clean data set used to calculate upper limits on the GW rates.
We define DQFs for S5y2/VSR1 following the approach used for S5y1 Abbott et al. (2009b). More details are given in Appendix A. After category 2 DQFs have been applied, the total available time during this period is 261.6 days for H1, 253.4 days for H2, 233.7 days for L1 and 106.2 days for V1 222For reference, a list of all time intervals included in the search may be found at https://dcc.ligo.org/cgi-bin/DocDB/ShowDocument?docid=T1000099&version=1 ..
III.2 Candidate Event Generation
As discussed in Section IV, three independent search algorithms are used to identify possible GW bursts: Exponential Gaussian Correlator (EGC), -pipeline (), and coherent WaveBurst (cWB). We analyze data from time intervals when at least two detectors were operating in coincidence. Altogether, eight networks, or sets of detectors, operating during mutually exclusive time periods are analyzed by at least one algorithm. Table 1 shows the time available for analysis (“live time”) for the different network configurations after application of category 1 and 2 DQFs. The actual times searched by each algorithm for each network (“observation times”) reflect details of the algorithms, such as the smallest analyzable data block, as well as choices about which networks are most suitable for each algorithm. The three- and two-detector network configurations not shown in Table 1 have negligible live time and are not considered in this search.
| network | live time | cWB | EGC | |
| H1H2L1V1 | 68.9 | 68.2 | 68.7 | 66.6 |
| H1H2L1 | 124.6 | 123.2 | 123.4 | 16.5 |
| H1H2V1 | 15.8 | 15.7 | 15.1 | 15.3 |
| H1L1V1 | 4.5 | 4.2 | - | 4.4 |
| H1H2 | 35.4 | 35.2 | 34.8 | - |
| H1L1 | 7.2 | 5.9 | - | - |
| L1V1 | 6.4 | - | 6.3 | - |
| H2L1 | 3.8 | 3.5 | - | - |
LIGO and GEO 600 data are sampled at 16384 Hz, yielding a maximum bandwidth of 8192 Hz, while Virgo data are sampled at 20000 Hz. Because of the large calibration uncertainties at high frequency, only data below 6000 Hz are used in the search. Also, because of high seismic noise, the frequency band below 50 Hz is excluded from the analysis. Furthermore, the EGC search was limited to the 300–5000 Hz band over which Virgo’s sensitivity was comparable to LIGO’s. In Section VI we describe the influence of the calibration uncertainties on the results of the search.
III.3 Vetoes
After gravitational-wave candidate events are identified by the search algorithms, they are subject to additional “veto” conditions to exclude events occurring within certain time intervals. These vetoes are based on statistical correlations between transients in the GW channel (data stream) and the environmental and interferometric auxiliary channels.
III.4 Background Estimation and Tuning
To estimate the significance of candidate GW events, and to optimize event selection cuts, we need to measure the distribution of events due to background noise. With a multi-detector analysis one can create a sample of background noise events and study its statistical properties. These samples are created by time-shifting data of one or more detectors with respect to the others by “un-physical” time delays (i.e. much larger than the maximum time-of-flight of a GW signal between the detectors). Shifts are typically in the range from 1 s to a few minutes. Any triggers that are coincident in the time-shifted data cannot be due to a true gravitational-wave signal; these coincidences therefore sample the noise background. Background estimation is done separately for each algorithm and network combination, using hundreds to thousands of shifts. To take into account possible correlated noise transients in the H1 and H2 detectors, which share a common environment and vacuum system, no time-shifts are introduced between these detectors for any network combination including another detector.
The shifted and unshifted data are analyzed identically. A portion of the background events are used together with simulations (see below) to tune the search thresholds and selection cuts; the remainder is used to estimate the significance of any candidate events in the unshifted data after the final application of the selection thresholds. All tuning is done purely on the time shifted data and simulations prior to examining the unshifted data-set. This “blind” tuning avoid any biases in our candidate selection. The final event thresholds are determined by optimizing the detection efficiency of the algorithms at a fixed false alarm rate.
III.5 Hardware and software injections
At pseudo-random times during the run, simulated burst signals were injected (added) into the interferometers by sending pre-calculated waveforms to the mirror position control system. These “hardware injections” provided an end-to-end verification of the detector instrumentation, the data acquisition system and the data analysis software. The injection times were clearly marked in the data with a DQF. Most of hardware injections were incoherent, i.e., performed into a single detector with no coincident injection into the other detectors. Some injections were performed coherently by taking into account a simulated source location in the sky and the angle-dependent sensitivity of the detectors to the two wave polarization states.
In addition to the flagged injections, a “blind injection challenge” was undertaken in which a small number (possibly zero) of coherent hardware injections were performed without being marked by a DQF. Information about these blind injections (including whether the number was nonzero) was hidden from the data analysis teams during the search, and revealed only afterward. This challenge was intended to test our data analysis procedures and decision processes for evaluating any candidate events that might be found by the search algorithms.
To determine the sensitivity of our search to gravitational waves, and to guide the tuning of selection cuts, we repeatedly re-analyze the data with simulated signals injected in software. The same injections are analyzed by all three analysis pipelines. See Section V for more details.
IV Search algorithms
Anticipated sources of gravitational wave bursts are usually not understood well enough to generate waveforms accurate and precise enough for matched filtering of generic signals. While some sources of GW bursts are being modeled with increasing success, the results tend to be highly dependent on physical parameters which may span a large parameter space. Indeed, some burst signals, such the white-noise burst from turbulent convection in a core-collapse supernova, are stochastic in nature and so are inherently not templatable. Therefore usually more robust excess-power algorithms Anderson et al. (2001); Chatterji (2005); McNabb et al. (2004); Klimenko et al. (2004) are employed in burst searches. By measuring power in the data as a function of time and frequency, one may identify regions where the power is not consistent with the anticipated fluctuations of detector noise. To distinguish environmental and instrumental transients from true GW signals, a multi-detector analysis approach is normally used, in which the event must be seen in more than one detector to be considered a candidate GW.
The simplest multi-detector analysis strategy is to require that the events identified in the individual detectors are coincident in time. The time coincidence window which should be chosen to take into account the possible time delays of a GW signal arriving at different sites, calibration and algorithmic timing biases, and possible signal model dependencies. Time coincidence can be augmented by requiring also an overlap in frequency. One such time-frequency coincidence method used in this search is the EGC algorithm Beauville et al. (2008) (see also Appendix C). It estimates the signal-to-noise ratio (SNR) in each detector and uses the combined SNR to rank candidate events.
A modification of the time-frequency coincidence approach is used in the search algorithm Chatterji et al. (2004) (also see Appendix D). In , the identification of the H1H2 network events is improved by coherently combining the H1 and H2 data to form a single pseudo-detector data stream H+. This algorithm takes an advantage of the fact that the co-located and co-aligned H1 and H2 detectors have identical responses to a GW signal. The performance of the algorithm is further enhanced by requiring that no significant power is left in the H1H2 null stream, H-, where GW signals cancel. This veto condition helps to reduce the false alarm rate due to random coincidences of noise transients, which typically leave significant power in the null stream. Network events identified by are characterized by the strength of the individual detector events, and by the correlated H1H2 energy .
A different network analysis approach is used in the cWB search algorithm Klimenko et al. (2008) (see also Abbott et al. (2009b) and Appendix E). The cWB algorithm performs a least-squares fit of a common GW signal to the data from the different detectors using the constrained likelihood method Klimenko et al. (2005). The results of the fit are estimates of the and waveforms, the most probable source location in the sky, and various likelihood statistics used in the cWB selection cuts. One of these is the maximum likelihood ratio , which is an estimator of the total SNR detected in the network. A part of the statistic depending on pairwise combinations of the detectors is used to construct the network correlated amplitude , which measures the degree of correlation between the detectors. Random coincidences of noise transients typically give low values of , making this statistic useful for background rejection. The contribution of each detector to the total SNR is weighted depending on the variance of the noise and angular sensitivity of the detectors. The algorithm automatically marginalizes a detector with either elevated noise or unfavorable antenna patterns, so that it does not limit the sensitivity of the network.
V Simulated signals and efficiencies
The detection efficiencies of the search algorithms depend on the network configuration, the selection cuts used in the analysis, and the GW morphologies which may span a wide range of signal durations, frequencies and amplitudes. To evaluate the sensitivity of the search and verify that the search algorithms do not have a strong model dependency, we use several sets of ad-hoc waveforms. These include
-
Sine-Gaussian waveforms:
(1) (2) We use a discrete set of central frequencies from 70 Hz to 6000 Hz and quality factors of 3, 9, and 100; see Table 2 and Fig. 2 (top). The amplitude factor is varied to simulate GWs with different strain amplitudes. For definition of the polarizations, see Eq. (8) and text below it.
-
Gaussian waveforms:
(3) (4) where the duration parameter is chosen to be one of (0.1, 1.0, 2.5, 4.0) ms; see Fig. 2 (middle).
-
Harmonic ringdown signals:
(5) (6) We use several central frequencies from 1590 Hz to 3067 Hz, one long decay time, ms, and two short decay times, 1 ms and 0.65 ms; see Table 3 and Fig. 2 (bottom). Two polarization states are used: circular (), and linear (). The quarter-cycle delay in is to avoid starting the waveform with a large jump.
-
Band-limited white noise signals:
These are bursts of Gaussian noise which are white over a frequency band and which have a Gaussian time profile with standard deviation decay time ; see Table 4. These signals are unpolarized in the sense that the two polarizations and have equal RMS amplitudes and are uncorrelated with each other.
The strengths of the ad hoc waveform injections are characterized by the root-square-sum amplitude ,
| (7) |
The parameters of these waveforms are selected to coarsely cover the frequency range of the search from 50 Hz to 6 kHz, and duration of signals up to a few hundreds of milliseconds. The Gaussian, sine-Gaussian and ringdown waveforms explore the space of GW signals with small time-frequency volume, while the white noise bursts explore the space of GW signals with relatively large time-frequency volume. Although the simulated waveforms are not physical, they may be similar to some waveforms produced by astrophysical sources. For example, the sine-Gaussian waveforms with few cycles are qualitatively similar to signals produced by the mergers of two black holes Pretorius (2009). The long-timescale ringdowns are similar to signals predicted for excitation of neutron-star fundamental modes Benhar et al. (2004). Some stellar collapse and core-collapse supernova models predict signals that resemble short ringdown waveforms (in the case of a rapidly rotating progenitor star) or band-limited white-noise waveforms with random polarizations. In the context of the recently proposed acoustic mechanism for core-collapse supernova explosions, quasi-periodic signals of 500 ms duration have been proposed Ott (2009).
To test the range for detection of gravitational waves from neutron star collapse, two waveforms were taken from simulations by Baiotti et al. Baiotti et al. (2007), who modeled neutron star gravitational collapse to a black hole and the subsequent ringdown of the black hole using collapsing polytropes deformed by rotation. The models whose waveform we chose were D1, a nearly spherical 1.67 neutron star, and D4, a 1.86 neutron star that is maximally deformed at the time of its collapse into a black hole. These two specific waveforms represent the extremes of the parameter space in mass and spin considered in Baiotti et al. (2007). They are linearly polarized (), with the waveform amplitude varying with the inclination angle (between the wave propagation vector and symmetry axis of the source) as .
The simulated detector responses are constructed as
| (8) |
Here and are the detector antenna patterns, which depend on the direction to the source () and the polarization angle . (The latter is defined as in Appendix B of Anderson et al. (2001).) These parameters are chosen randomly for each injection. The sky direction is isotropically distributed, and the random polarization angle is uniformly distributed on . The injections are distributed uniformly in time across the S5y2/VSR1 run, with an average separation of 100 s. Note that for the ad-hoc waveforms no is used.
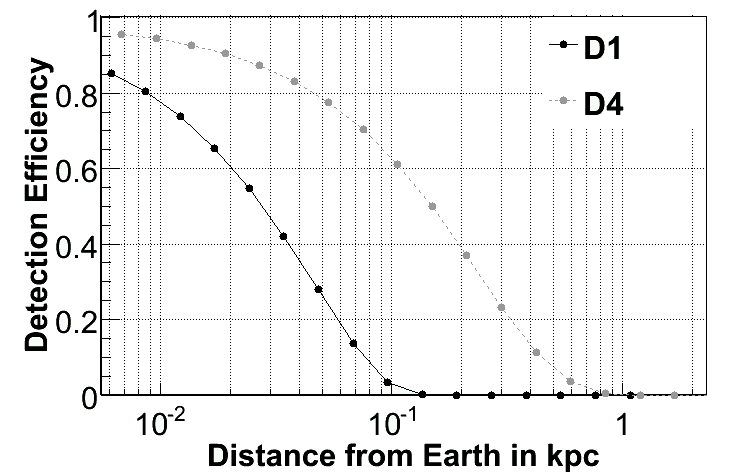
The detection efficiency after application of all selection cuts was determined for each waveform type. All waveforms were evaluated using cWB, while subsets were evaluated using and EGC, due mainly to the limited frequency bands covered by those algorithms as they were used in this search (48–2048 Hz and 300–5000 Hz, respectively). Figure 2 shows the combined efficiency curves for selected sine-Gaussian, Gaussian and ringdown simulated signals as a function of the amplitude. Figure 3 shows the detection efficiency for the astrophysical signals D1 and D4 as a function of the distance to the source.
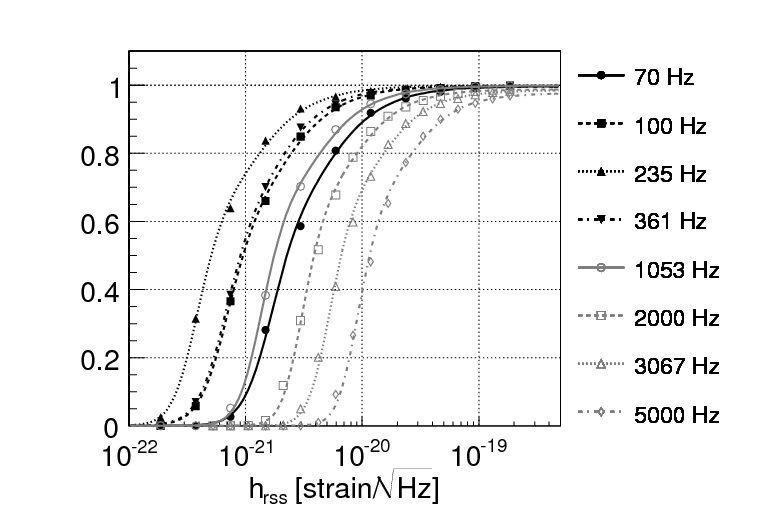
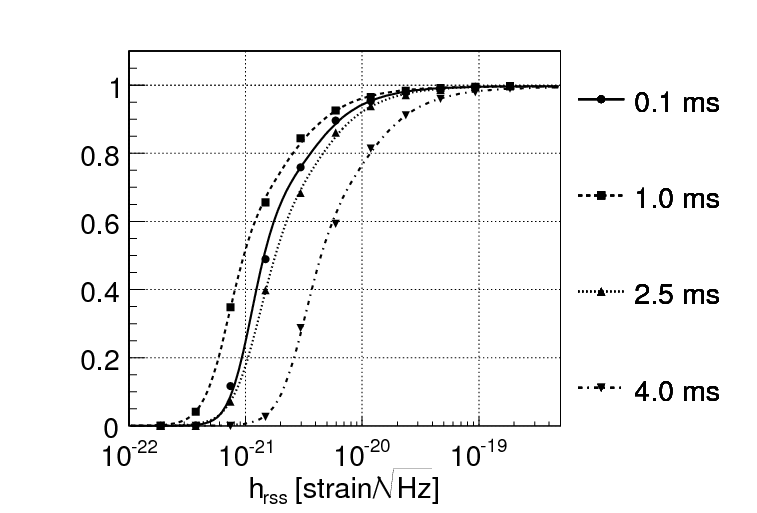
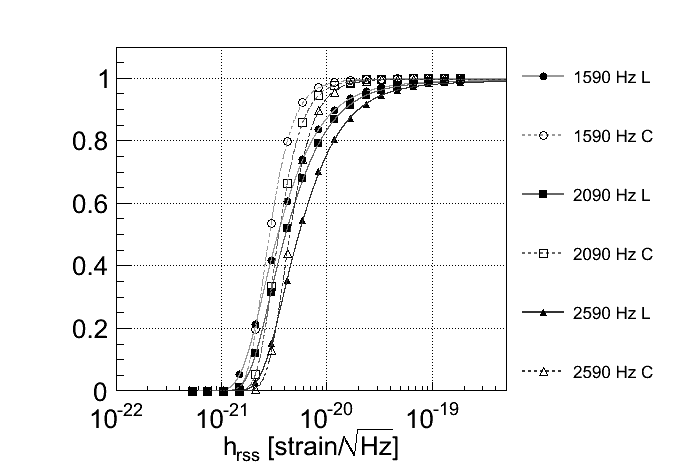
Each efficiency curve is fitted with an empirical function and the injection amplitude for which that function equals 50% is determined. This quantity, , is a convenient characterization of the sensitivity of the search to that waveform morphology. Tables 2, 3, and 4 summarize the sensitivity of the search to the sine-Gaussian, ringdown, and band-limited white noise burst signals. Where possible, we also calculate the sensitivity of the logical OR of the cWB and algorithms (since those two are used for the upper limit calculation as described in Sec. VII), and for the appropriately weighted combination of all networks (some of which are less sensitive) contributing to the total observation time. In general, the efficiency of the combination of the search algorithms is slightly more sensitive than the individual algorithms.
| H1H2L1V1, | all networks | ||||||
|---|---|---|---|---|---|---|---|
| cWB | EGC | cWB or | |||||
| 70 | 3 | 17.9 | 26.7 | - | 17.6 | 20.4 | 96.6 |
| 70 | 9 | 20.6 | 34.4 | - | 20.6 | 25.0 | 120 |
| 70 | 100 | 20.5 | 35.0 | - | 20.0 | 25.1 | 121 |
| 100 | 9 | 9.2 | 14.1 | - | 9.1 | 10.6 | 49.7 |
| 153 | 9 | 6.0 | 9.1 | - | 6.0 | 6.5 | 29.3 |
| 235 | 3 | 6.5 | 6.6 | - | 5.9 | 6.1 | 28.8 |
| 235 | 9 | 6.4 | 5.8 | - | 5.6 | 5.6 | 26.8 |
| 235 | 100 | 6.5 | 6.7 | - | 6.2 | 6.0 | 26.1 |
| 361 | 9 | 10.5 | 10.2 | 60.1 | 9.5 | 10.0 | 42.0 |
| 554 | 9 | 11.1 | 10.5 | 18.8 | 9.9 | 10.9 | 47.1 |
| 849 | 3 | 19.2 | 15.8 | 30.0 | 15.3 | 15.8 | 73.8 |
| 849 | 9 | 17.7 | 15.3 | 28.5 | 14.6 | 15.8 | 71.5 |
| 849 | 100 | 16.0 | 16.2 | 31.3 | 14.5 | 15.3 | 66.7 |
| 1053 | 9 | 22.4 | 19.0 | 33.8 | 18.3 | 19.4 | 86.9 |
| 1304 | 9 | 28.1 | 23.6 | 41.0 | 22.6 | 24.7 | 115 |
| 1451 | 9 | 28.6 | - | 43.3 | 28.6 | 30.2 | 119 |
| 1615 | 3 | 39.6 | 32.1 | 48.4 | 31.7 | 33.8 | 146 |
| 1615 | 9 | 33.7 | 28.1 | 51.1 | 27.3 | 29.5 | 138 |
| 1615 | 100 | 29.6 | 30.6 | 53.8 | 27.6 | 28.6 | 126 |
| 1797 | 9 | 36.5 | - | 57.8 | 36.5 | 38.3 | 146 |
| 2000 | 3 | 42.6 | - | - | 42.6 | 47.1 | 191 |
| 2000 | 9 | 40.6 | - | 58.7 | 40.6 | 44.0 | 177 |
| 2000 | 100 | 34.9 | - | - | 34.9 | 38.4 | 153 |
| 2226 | 9 | 46.0 | - | 68.6 | 46.0 | 51.1 | 187 |
| 2477 | 3 | 61.9 | - | - | 61.9 | 65.6 | 262 |
| 2477 | 9 | 53.5 | - | 76.7 | 53.5 | 56.1 | 206 |
| 2477 | 100 | 44.5 | - | - | 44.5 | 48.9 | 201 |
| 2756 | 9 | 60.2 | - | 82.2 | 60.2 | 64.4 | 248 |
| 3067 | 3 | 86.9 | - | - | 86.9 | 87.0 | 343 |
| 3067 | 9 | 69.0 | - | 96.6 | 69.0 | 75.0 | 286 |
| 3067 | 100 | 55.4 | - | - | 55.4 | 61.1 | 273 |
| 3413 | 9 | 75.9 | - | 108 | 75.9 | 82.9 | 323 |
| 3799 | 9 | 89.0 | - | 116 | 89.0 | 97.7 | 386 |
| 4225 | 9 | 109 | - | 138 | 109 | 115 | 575 |
| 5000 | 3 | 207 | - | - | 207 | 187 | 1160 |
| 5000 | 9 | 126 | - | 155 | 126 | 130 | 612 |
| 5000 | 100 | 84.7 | - | - | 84.7 | 100 | 480 |
| 6000 | 9 | 182 | - | - | 182 | 196 | 893 |
| all networks, | all networks, | ||||
| Lin. | Circ. | Lin. | Circ. | ||
| 1590 | 200 | 34.7 | 30.0 | 131 | 60.0 |
| 2000 | 1.0 | 49.5 | 43.8 | 155 | 81.1 |
| 2090 | 200 | 43.3 | 36.5 | 155 | 72.9 |
| 2590 | 200 | 58.6 | 46.0 | 229 | 88.8 |
| 3067 | 0.65 | 88.2 | 73.3 | 369 | 142 |
| H1H2L1V1, | all networks | ||||||
|---|---|---|---|---|---|---|---|
| cWB | cWB or | ||||||
| 100 | 100 | 0.1 | 7.6 | 13.6 | 7.6 | 8.4 | 19.6 |
| 250 | 100 | 0.1 | 9.1 | 10.2 | 8.8 | 8.6 | 18.7 |
| 1000 | 10 | 0.1 | 20.9 | 28.6 | 21.0 | 21.8 | 52.6 |
| 1000 | 1000 | 0.01 | 36.8 | 38.2 | 35.0 | 36.3 | 74.7 |
| 1000 | 1000 | 0.1 | 60.3 | 81.7 | 60.7 | 63.5 | 140 |
| 2000 | 100 | 0.1 | 40.4 | - | 40.4 | 44.1 | 94.4 |
| 2000 | 1000 | 0.01 | 60.7 | - | 60.7 | 62.4 | 128 |
| 3500 | 100 | 0.1 | 74.3 | - | 74.3 | 84.8 | 182 |
| 3500 | 1000 | 0.01 | 103 | - | 103 | 109 | 224 |
| 5000 | 100 | 0.1 | 101 | - | 101 | 115 | 255 |
| 5000 | 1000 | 0.01 | 152 | - | 152 | 144 | 342 |
VI Uncertainties
The amplitude sensitivities presented in this paper, i.e. the values at 50% and 90% efficiency, have been adjusted upward to conservatively reflect statistical and systematic uncertainties. The statistical uncertainty arises from the limited number of simulated signals used in the efficiency curve fit, and is typically a few percent. The dominant source of systematic uncertainty comes from the amplitude calibration: the single detector amplitude calibration uncertainties is typically of order 10%. Neglegible effects are due to phase and timing uncertainties.
The amplitude calibration of the interferometers is less accurate at high frequencies than at low frequencies, and therefore two different approaches to handling calibration uncertainties are used in the S5y2/VSR1 search. In the frequency band below 2 kHz, we use the procedure established for S5y1 (Abbott et al., 2009c). We combine the amplitude uncertainties from each interferometer into a single uncertainty by calculating a combined root-sum-square amplitude SNR and propagating the individual uncertainties assuming each error is independent: as a conservative result, the detection efficiencies are rigidly shifted towards higher by 11.1%. In the frequency band above 2 kHz, a new methodology, based on MonteCarlo simulations has been adopted to marginalize over calibration uncertainties: basically, we inject signals whose amplitude has been jittered according to the calibration uncertainties. The effect of miscalibration resulted in the increase of the combined by 3 % to 14%, depending mainly on the central frequency of the injected signals.
VII Search Results
In Section III we described the main steps in our search for gravitational-wave bursts. In the search all analysis cuts and thresholds are set in a blind way, using time-shifted (background) and simulation data. The blind cuts are set to yield a false-alarm rate of approximately 0.05 events or less over the observation time of each search algorithm, network configuration and target frequency band. Here we describe the results.
VII.1 Candidate events
After these cuts are fixed, the unshifted events are examined and the various analysis cuts, DQFs, and vetoes are applied. Any surviving events are considered as candidate gravitational-wave events and subject to further examination. The purpose of this additional step is to go beyond the binary decision of the initial cuts and evaluate additional information about the events which may reveal their origin. This ranges from “sanity checks” to deeper investigations on the background of the observatory, detector performances, environmental disturbances and candidate signal characteristics.
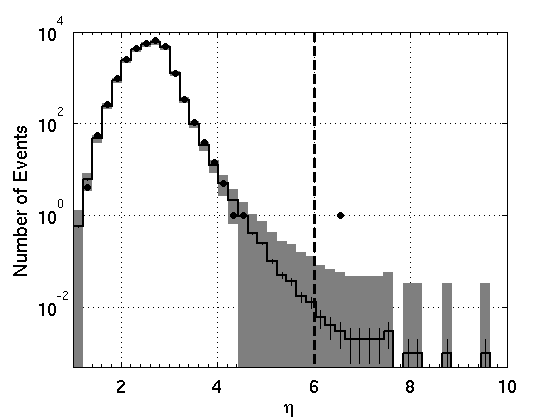
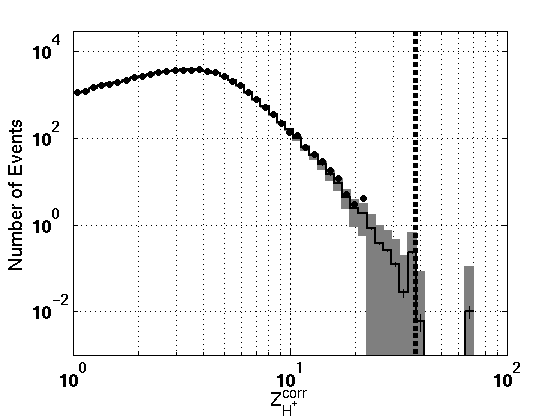
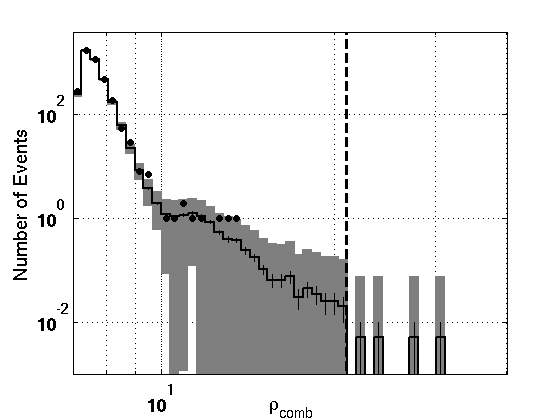
Examining the unshifted data, we found one foreground event among all the different search algorithms and detector combinations that survives the blind selection cuts. It was produced by cWB during a time when all five detectors were operating simultaneously. As the possible first detection of a gravitational-wave signal, this event was examined in great detail according to our follow-up checklist. We found no evident problem with the instruments or data, and no environmental or instrumental disturbance detected by the auxiliary channels. The event was detected at a frequency of 110 Hz, where all detectors are quite non-stationary, and where both the GEO 600 and Virgo detectors had poorer sensitivity (see Fig. 1). Therefore, while the event was found in the H1H2L1V1 analysis, we also re-analyzed the data using cWB and the H1H2L1 network. Figure 4 (top) shows the event above the blind selection cuts and the comparison with the measured H1H2L1 background of cWB in the frequency band below 200 Hz.
No foreground event passes the blind selection cuts in the H1H2L1 analysis (see Figure 4 (bottom)); moreover, there is no visible excess of foreground events with respect to the expected background. The cWB event is well within the tail of the foreground and does not pass the final cut placed on correlated energy of the Hanford detectors. Furthermore, the event is outside of the frequency band (300-5000 Hz) processed by the EGC algorithm. Figure 5 (top) shows the corresponding EGC foreground and background distributions for the H1H2L1V1 network. For comparison, Figure 5 (bottom) shows similar distributions from cWB, with no indication of any excess of events in the frequency band 1200–6000 Hz.
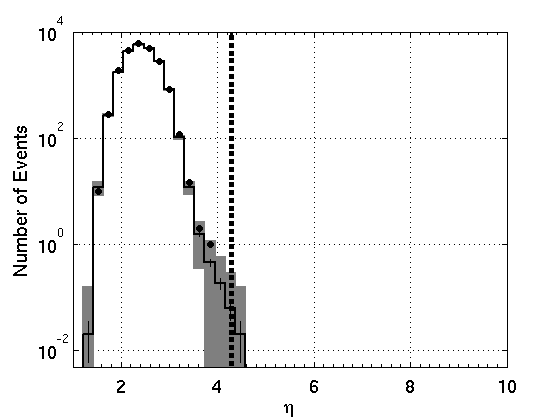
To better estimate the significance of the surviving cWB event, we performed extensive background studies with cWB for the H1H2L1 network, accumulating a background sample with effective observation time of approximately 500 years. These studies indicate an expected false alarm rate for similar events of once per 43 years for the cWB algorithm and the H1H2L1 network. The statistical significance of the event must take into account a “trials factor” arising from multiple analyses using different search algorithms, networks and frequency bands. Neglecting a small correlation among the backgrounds, this factor can be estimated by considering the total effective analyzed time of all the independent searches, which is 5.1 yr. The probability of observing one event at a background rate of once per 43 years or less in any of our searches is then on the order of . This probability was considered too high to exclude a possible accidental origin of this event, which was neither confirmed nor ruled out as a plausible GW signal. This event was later revealed to be a hardware injection with Hz-1/2. It was the only burst injection within the “blind injection challenge.” Therefore it was removed from the analysis by the cleared injection data quality flag. We can report that cWB recovered the injection parameters and waveforms faithfully, and the exercise of treating the event as a real GW candidate was a valuable learning experience.
Although no other outstanding foreground events were observed in the search, we have additionally examined events in the data set with relaxed selection cuts, namely, before applying category 3 DQFs and vetoes. In this set we find a total of three foreground events. One of these is produced by the EGC algorithm (0.16 expected from the background) and the other two are from the -pipeline (1.4 expected). While an exceptionally strong event in the enlarged data set could, in principle, be judged to be a plausible GW signal, none of these additional events is particularly compelling. The EGC event occurred during a time of high seismic noise and while the H2 interferometer was re-acquiring lock (and thus could occasionally scatter light into the H1 detector), both of which had been flagged as category 3 data quality conditions. The -pipeline events fail the category 3 vetoes due to having corresponding glitches in H1 auxiliary channels. None of these three events passes the cWB selection cuts. For these reasons, we do not consider any of them to be a plausible gravitational-wave candidate. Also, since these events do not pass the predefined category 3 data quality and vetoes, they do not affect the calculation of the upper limits presented below.
VII.2 Upper limits
The S5y2/VSR1 search includes the analysis of eight network configurations with three different algorithms. We use the method presented in Sutton (2009) to combine the results of this search, together with the S5y1 search Abbott et al. (2009b), to set frequentist upper limits on the rate of burst events. Of the S5y2 results, we include only the networks H1H2L1V1, H1H2L1 and H1H2, as the other networks have small observation times and their contribution to the upper limit would be marginal. Also, we decided a priori to use only the two algorithms which processed the data from the full S5y2 run, namely cWB and . (EGC only analyzed data during the 5 months of the run when Virgo was operational.) We are left therefore with six analysis results to combine with the S5y1 results to produce a single upper limit on the rate of GW bursts for each of the signal morphologies tested.
As discussed in Sutton (2009), the upper limit procedure combines the sets of surviving triggers according to which algorithm(s) and/or network detected any given trigger, and weights each trigger according to the detection efficiency of that algorithm and network combination. For the special case of no surviving events, the 90% confidence upper limit on the total event rate (assuming a Poisson distribution of astrophysical events) reduces to
| (9) |
where , is the detection efficiency of the union of all search algorithms and networks, and is the total observation time of the analyzed data sets.
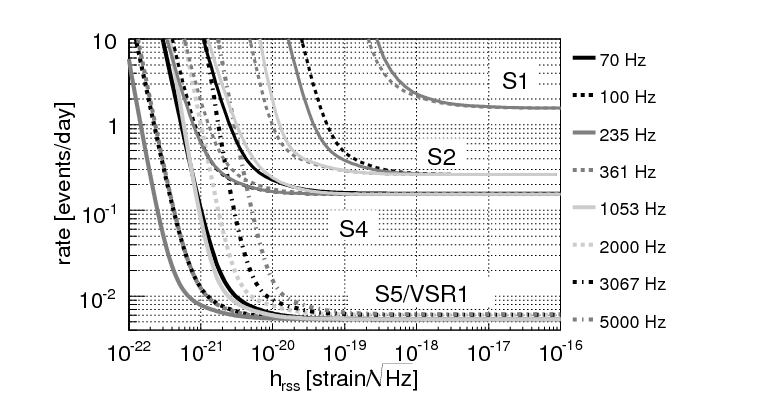
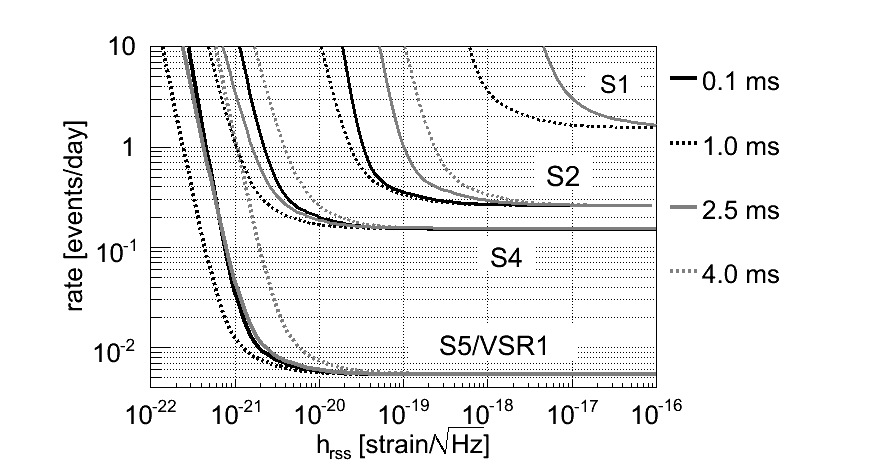
In the limit of strong signals in the frequency band below 2 kHz, the product is 224.0 days for S5y1 and 205.3 days for S5y2/VSR1. The combined rate limit for strong GW signals is thus . For the search above 2 kHz, the rate limit for strong GW signals is . This slightly weaker limit is due to the fact that less data was analyzed in the S5y1 high-frequency search than in the S5y1low-frequency search (only 161.3 days of H1H2L1 data Abbott et al. (2009c)). Figure 6 shows the combined rate limit as a function of amplitude for selected Gaussian and sine-Gaussian waveforms.
The results can also be interpreted as limits on the rate density (number per time per volume) of GWBs assuming a standard-candle source. For example, given an isotropic distribution of sources with amplitude at a fiducial distance , and with rate density , the rate of GWBs at the Earth with amplitudes in the interval is
| (10) |
(Here we have neglected the inclination angle ; equivalently we can take to be averaged over .) The expected number of detections given the network efficiency (for injections without any dependence) and the observation time is
| (11) | |||||
For linearly polarized signals distributed uniformly in , the efficiency is the same with rescaled by a factor divided by that factor’s appropriately averaged value . Thus the above expression is multiplied by . The lack of detection candidates in the S5/VSR1 data set implies a 90% confidence upper limit on rate density of
| (12) |
Assuming that a standard-candle source emits waves with energy , where is the solar mass, the product is
| (13) |
Figure 7 shows the rate density upper limits as a function of frequency. This result can be interpreted in the following way: given a source with a characteristic frequency and energy , the corresponding rate limit is . For example, for sources emitting at 150 Hz with , the rate limit is approximately .

The bump at Hz reflects the effect of the “violin modes” (resonant frequencies of the wires suspending the mirrors) on the sensitivity of the detector.
VIII Summary and Discussion
In this paper we present results of new all-sky untriggered searches for gravitational wave bursts in data from the first Virgo science run (VSR1 in 2007) and the second year of the fifth LIGO science run (S5y2 in 2006–2007). This data set represented the first long-term operation of a worldwide network of interferometers of similar performance at three different sites. Data quality and analysis algorithms have improved since similar searches of the previous LIGO run (S4 in 2004) Abbott et al. (2007) and even since the first year of S5 (S5y1 in 2005–2006) Abbott et al. (2009b, c). This is reflected in an improved strain sensitivity with as low (good) as Hz-1/2 for certain waveforms (see Table 2), compared to best values of Hz-1/2 and Hz-1/2 for S4 and S5y1 respectively. The new searches also cover an extended frequency band of 50–6000 Hz.
No plausible gravitational wave candidates have been identified in the S5y2/VSR1 searches. Combined with the S5y1 results, which had comparable observation time, this yields an improved upper limit on the rate of bursts (with amplitudes a few times larger than ) of 2.0 events per year at 90% confidence for the 64–2048 Hz band, and 2.2 events per year for higher-frequency bursts up to 6 kHz. Thus the full S5/VSR1 upper limit is better than the S5y1 upper limits of 3.75 per year (64–2000 Hz) and 5.4 per year (1–6 kHz), and is more than an order of magnitude better than the upper limit from S4 of 55 events per year.
We note that the IGEC network of resonant bar detectors set a slightly more stringent rate limit, events per year at 95% confidence level Astone et al. (2003). However, those detectors were sensitive only around their resonant frequencies, near 900 Hz, and achieved that rate limit only for signal amplitudes (in units) of a few times or greater, depending on the signal waveform. (See Sec. X of Abbott et al. (2005) for a discussion of this comparison.) Further IGEC observations during 6 months of 2005 Astone et al. (2007) improved the rate limit to 8.4 per year for bursts as weak as a few times but did not change the more stringent rate limit for stronger bursts. The current LIGO-Virgo burst search is sensitive to bursts with one to two orders of magnitude weaker than those which were accessible to the IGEC detectors.
To characterize the astrophysical sensitivity achieved by the S5y2/VSR1 search, we calculate the amount of mass, converted into GW burst energy at a given distance , that would be sufficient to be detected by the search with 50% efficiency (). Inverting Eq. (13), we obtain a rough estimate assuming an average source inclination angle (i.e. is averaged over ):
| (14) |
For example, consider a sine-Gaussian signal with Hz and , which (from Table 2) has for the four-detector network. Assuming a typical Galactic distance of 10 kpc, that corresponds to . For a source in the Virgo galaxy cluster, approximately 16 Mpc away, the same would be produced by a mass conversion of roughly . These figures are slightly better than for the S5y1 search and a factor of 5 better than the S4 search.
We also estimate in a similar manner a detection range for GW signals from core-collapse supernovae and from neutron star collapse to a black hole. Such signals are expected to be produced at a much higher frequency (up to a few kHz) and also with a relatively small GW energy output (). For a possible supernova scenario, we consider a numerical simulation of core collapse by Ott et al. Ott et al. (2006). For the model s25WW, which undergoes an acoustically driven explosion, as much as may be converted to gravitational waves. The frequency content produced by this particular model peaks around Hz and the duration is of order one second. Taking this to be similar to a high- sine-Gaussian or a long-duration white noise burst, from our detection efficiency studies we estimate of 17–22 Hz-1/2, i.e. that such a signal could be detected out to a distance of around kpc. The axisymmetric neutron star collapse signals D1 and D4 of Baiotti et al. Baiotti et al. (2007) have detection ranges (at 50% confidence) of only about 25 pc and 150 pc (see Fig. 3, due mainly to their lower energy () and also to emitting most of that energy at 2–6 kHz, where the detector noise is greater.
The Advanced LIGO and Virgo detectors, currently under construction, will increase the detection range of the searches by an order of magnitude, therefore increasing by 1000 the monitored volume of the universe. With that sensitivity, GW signals from binary mergers are expected to be detected regularly, and other plausible sources may also be explored. Searches for GW burst signals, capable of detecting unknown signal waveforms as well as known ones, will continue to play a central role as we increase our understanding of the universe using gravitational waves.
Acknowledgements.
The authors gratefully acknowledge the support of the United States National Science Foundation for the construction and operation of the LIGO Laboratory, the Science and Technology Facilities Council of the United Kingdom, the Max-Planck-Society and the State of Niedersachsen/Germany for support of the construction and operation of the GEO 600 detector, and the Italian Istituto Nazionale di Fisica Nucleare and the French Centre National de la Recherche Scientifique for the construction and operation of the Virgo detector. The authors also gratefully acknowledge the support of the research by these agencies and by the Australian Research Council, the Council of Scientific and Industrial Research of India, the Istituto Nazionale di Fisica Nucleare of Italy, the Spanish Ministerio de Educación y Ciencia, the Conselleria d’Economia Hisenda i Innovació of the Govern de les Illes Balears, the Foundation for Fundamental Research on Matter supported by the Netherlands Organisation for Scientific Research, the Polish Ministry of Science and Higher Education, the FOCUS Programme of Foundation for Polish Science, the Royal Society, the Scottish Funding Council, the Scottish Universities Physics Alliance, the National Aeronautics and Space Administration, the Carnegie Trust, the Leverhulme Trust, the David and Lucile Packard Foundation, the Research Corporation, and the Alfred P. Sloan Foundation. This document has been assigned LIGO Laboratory document number LIGO-P0900108-v6.Appendix A Data Quality Flags
The removal of poor-quality LIGO data uses the data quality flag (DQF) strategy described in the first year analysis Abbott et al. (2009b). For the second year there are several new DQFs. New category 2 flags mark high currents in the end test-mass side coils, discontinuous output from a tidal compensation feed-forward system, periods when an optical table was insufficiently isolated from ground noise, and power fluctuations in lasers used to thermally control the radius of curvature of the input test masses. A flag for overflows of several of the main photodiode readout sensors that was used as a category 3 flag in the first year was promoted to category 2. New category 3 flags mark noise transients from light scattered from H1 into H2 and vice versa, large low-frequency seismic motions, the optical table isolation problem noted above, periods when the roll mode of an interferometer optic was excited, problems with an optical level used for mirror alignment control, and one period when H2 was operating with degraded sensitivity. The total “dead time” (fraction of live time removed) during the second year of S5 due to category 1 DQFs was 2.4%, 1.4%, and 0.1% for H1, H2, and L1, respectively. Category 2 DQF dead time was 0.1%, 0.1%, and 0.6%, and category 3 DQF dead time was 4.5%, 5.5%, and 7.7%. Category 4 flags, used only as additional information for follow-ups of candidate events (if any), typically flag one-time events identified by Collaboration members on duty in the observatory control rooms, and thus are quite different between the first and second years.
Virgo DQFs are defined by study of the general behavior of the detector, daily reports from the control room, online calibration information, and the study of loud transient events generated online from the uncalibrated Virgo GW channel by the Qonline Blackburn et al. (2008) program. Virgo DQFs include out-of-science mode, hardware injection periods, and saturation of the current flowing in the coil drivers. Most of them concern a well identified detector or data acquisition problem, such as the laser frequency stabilization process being off, photodiode saturation, calibration line dropouts, and loss of synchronization of the longitudinal and angular control. Some loud glitches and periods of higher glitch rate are found to be due to environmental conditions, such as increased seismic noise (wind, sea, and earthquakes), and 50 Hz power line ground glitches seen simultaneously in many magnetic probes. In addition, a faulty piezo-electric driver used by the beam monitoring system generated glitches between 100 and 300 Hz, and a piezo controlling a mirror on a suspended bench whose cabling was not well matched caused glitches between 100 and 300 Hz and between 600 and 700 Hz. The total dead time in VSR1 due to category 1 DQFs was 1.4%. Category 2 DQF dead time was 2.6%, and category 3 DQF dead time was 2.5% Leroy et al. (2009).
Appendix B Event-by-event vetoes
Event-by-event vetoes discard gravitational-wave channel noise events using information from the many environmental and interferometric auxiliary channels which measure non-GW degrees of freedom. Our procedure for identifying vetoes in S5y2 and VSR1 follows that used in S5y1 Abbott et al. (2009b). Both the GW channels and a large number of auxiliary channels are processed by the KleineWelle (KW) Blackburn et al. (2005) algorithm, which looks for excess power transients. Events from the auxiliary channels which have a significant statistical correlation with the events in the corresponding GW channel are used to generate the veto time intervals. Candidate events identified by the search algorithms are rejected if they fall inside the veto time intervals.
Veto conditions belong to one of two categories which follow the same notation used for data quality flags. Category 2 vetoes are a conservative set of vetoes targeting known electromagnetic and seismic disturbances at the LIGO and Virgo sites. These are identified by requiring a coincident observation of an environmental disturbance across several channels at a particular site. The resulting category 2 data selection cuts are applied to all analyses described in this paper, and remove 0.2% of analyzable coincident live time. Category 3 vetoes make use of all available auxiliary channels shown not to respond to gravitational waves. An iterative tuning method is used to maximize the number of vetoed noise events in the gravitational-wave channel while removing a minimal amount of time from the analysis. The final veto list is applied to all analyses below 2048 Hz, removing 2% of total analyzable coincident live time.
An additional category 3 veto condition is applied to Virgo triggers, based on the ratio of the amplitude of an event as measured in the in-phase (P) and quadrature (Q) dark port demodulated signals. Since the Q channel should be insensitive to a GW signal, large Q/P ratio events are vetoed. This veto has been verified to be safe using hardware signal injections Ballinger et al. (2009), with a loss of live time of only 0.036%.
Appendix C EGC burst search
The Exponential Gaussian Correlator (EGC) pipeline is based on a matched filter using exponential Gaussian templates Clapson et al. (2008); Acernese et al. (2009),
| (15) |
where is the central frequency and is the duration. Assuming that real GWBs are similar to sine-Gaussians, EGC cross-correlates the data with the templates,
| (16) |
Here and are the Fourier transforms of the data and template, and is the two-sided noise power spectral density. is a template normalization factor, defined as
| (17) |
We tile the parameter space using the algorithm of Arnaud et al. (2003). The minimal match is 72%, while the average match between templates is 96%. The analysis covers frequencies from 300 Hz to 5 kHz, where LIGO and Virgo have comparable sensitivity. varies from 2 to 100, covering a large range of GW burst durations.
The quantity is the signal-to-noise ratio (SNR), which we use to characterize the strength of triggers in the individual detectors. The analysis is performed on times when at least three of the four detectors were operating. Triggers are generated for each of the four detectors and kept if the SNR is above 5. In order to reduce the background, category 2 DQFs and vetoes are applied, followed by several other tests. First, triggers must be coincident in both time and frequency between a pair of detectors. The time coincidence window is the light travel time between the interferometers plus a conservative 10 ms allowance for the EGC timing accuracy. The frequency coincidence window is selected to be 350 Hz. Second, events seen in coincidence in H1 and H2 with a unexpected ratio in SNR are discarded (the SNR in H1 should be approximately 2 times that in H2). Surviving coincident triggers are ranked according to the combined SNR, defined as
| (18) |
where and are the SNR in the two detectors. Third, a threshold is applied on and to reduce the trigger rate in the noisier detector. This lowers the probability that a detector with a large number of triggers will generate many coincidences with a few loud glitches in the other detector. Finally, for each coincident trigger we compute the SNR disbalance measure
| (19) |
This variable is useful in rejecting glitches in a pair of co-aligned detectors with similar sensitivity, and so is used primarily for pairs of triggers from the LIGO detectors.
The background is estimated for each detector pair by time shifting the trigger lists. 200 time slides are done for H1H2L1V1, and more for the three-detector networks due to their shorter observation times (see Table 5). The thresholds applied to , and are tuned for each detector pair to maximize the average detection efficiency for sine-Gaussian waveforms at a given false alarm rate. Once the , and thresholds are applied, all trigger pairs from the network are considered together and is used as the final statistic to rank the triggers. A threshold is placed on , chosen to give a low false alarm rate. More precisely, as we observe an excess of loud glitches with Hz, we use different thresholds depending on the frequency of the coincident triggers. Below 400 Hz, the false alarm rate is tuned to 1 event per 10 years. Above, the threshold for each network is set to give a maximum of 0.05 events expected from background for that network. An exception is made for H1L1V1, where the maximum number is chosen to be 0.01 events because of its shorter observation time. The final thresholds for each network are given in Table 5.
| Network | Obs. time | # lags | FAR | |
|---|---|---|---|---|
| [days] | ||||
| H1H2L1V1 | 66.6 | 200 | 400 Hz: 1 event in 10 years | 69.8 |
| 400 Hz: 0.05 events | 21.0 | |||
| H1H2L1 | 18.3 | 1000 | 400 Hz: 1 event in 10 years | 80.9 |
| 400 Hz: 0.05 events | 10.0 | |||
| H1H2V1 | 15.9 | 1000 | 400 Hz: 1 event in 10 years | 89.6 |
| 400 Hz: 0.05 events | 15.4 | |||
| H1L1V1 | 4.5 | 2000 | 400 Hz: 1 event in 10 years | 67.9 |
| 400 Hz: 0.01 events | 24.2 |
Appendix D -Pipeline burst search
The -Pipeline is essentially identical to QPipeline, which was used in previous LIGO S5 searches Abbott et al. (2009b, c). QPipeline has since been integrated into a larger software suite, with a change in nomenclature but no significant change in methodology. Since this approach is discussed in detail in Abbott et al. (2009b); Chatterji (2005), we provide only a summary here.
The -Pipeline, like EGC, functions as a matched-filter search on a single-interferometer basis. The data stream is whitened by linear predictive filtering Makhoul (1975), then projected onto a template bank of complex exponentials. These templates are similar to those used by EGC, parametrized by central time , central frequency , and quality factor , but use bisquare windows rather than Gaussian windows. The template spacing is also different, selected for computational speed, rather than for strict mathematical optimization as in EGC. The template bank has a minimal match of 80%, and covers a frequency range from 48 Hz to 2048 Hz and a range from 2.35 to 100.
The significance of a single-interferometer trigger is given by its normalized energy , defined as the ratio of the squared magnitude of (the projection onto the best-matched template) for that trigger to the mean-squared magnitude of other templates with the same and . For Gaussian white noise, is exponentially distributed and related to the matched filter SNR by
| (20) |
is used to rank L1 and V1 triggers.
For H1 and H2, -Pipeline takes advantage of their co-located nature to form two linear combinations of the data streams. The first of these, the coherent stream H+, is the sum of the strains in the two interferometers weighted by their noise power spectral densities. We define the coherent energy following (20). We also define the correlated energy , which is obtained by removing the contribution to from H1 and H2 individually and leaving only the cross-correlation term333This statement is actually only approximately correct due to complications related to normalization. See Abbott et al. (2009b) for more details.. The H1H2 cuts are based on , because it is less susceptible than to instrumental glitches, so providing better separation between signal and noise. The second stream, the null stream H-, is the difference between the strains in H1 and H2. The normalized energy should be small for a gravitational wave, but generally much larger for an instrumental glitch. We therefore veto coherent stream triggers which are coincident in time and frequency with null stream triggers.
We require triggers to be coincident in at least two detectors. The interferometer combinations analyzed are shown in Table 6. (Note that because of the coherent analysis of H1 and H2, both must be operating for data from either to be analyzed.) Triggers are required to be coincident in both time and frequency as follows:
| (21) | |||||
| (22) |
Here and are the central time and frequency of the triggers, and are their duration and bandwidth, and is the light travel time between the interferometers.
The background for each detector pair is determined by time-shifting the triggers from one detector. We use 1000 shifts for each pair, except H1-H2. Only 10 shifts between H1 and H2 are used because the coherent analysis requires each shift to be processed independently, substantially increasing the computational cost. Also, time shifts between H1 and H2 are less reliable because they miss correlated background noise from the common environment. For all pairs, triggers below and above 200 Hz are treated separately because of the different characteristics of the glitch populations at these frequencies.
Normalized energy thresholds are set separately for each detector combination and frequency range such that there is less than a 5% probability of a false alarm after category 3 DQFs and vetoes. Table 6 shows the thresholds and surviving events in timeslides for each combination. Fig. 8 shows background and injection triggers and the energy thresholds for one interferometer pair.
| Detector combination | threshold | events in 1000 |
| and frequency band | timeslides | |
| H1H2L1 200 Hz | , | 14 |
| H1H2L1 200 Hz | , | 16 |
| H1H2V1 200 Hz | , | 9 |
| H1H2V1 200 Hz | , | 0 |
| L1V1 200 Hz | and | 4 |
| L1V1 200 Hz | and | 5 |
| H1H2 200 Hz | 0 (10 slides) | |
| H1H2 200 Hz | 0 (10 slides) | |
| total events | 48 |
Appendix E Coherent WaveBurst Search
Coherent WaveBurst (cWB) is a coherent algorithm for detecting gravitational-wave bursts. It constructs a least-squares fit of the two GW polarizations to the data from the different detectors using the constraint likelihood method Klimenko et al. (2005). The cWB algorithm was first used in search for gravitational wave bursts in the LIGO-GEO network Abbott et al. (2008). More recently it has been used in the LIGO S5 first-year low-frequency search Abbott et al. (2009b), and detailed descriptions of the algorithm can be found there and in Klimenko et al. (2005, 2008).
The cWB analysis in this search covers frequencies from 64 Hz to 6.0 kHz, with the data processing split into two bands. The low-frequency (LF) band (64 Hz to 2.0 kHz) contains the most sensitive (but also the most non-stationary) data. The high-frequency (HF) band (1.28 kHz to 6.0 kHz) is dominated by the shot noise of the detectors and is much less polluted by environmental and instrumental transients. Splitting the analysis into two bands is convenient for addressing the different noise characteristics in these bands. It also eases the computational cost. The overlap of the bands is used to cross-check the results and to preserve the sensitivity to wide-band signals near the boundary between the bands.
The cWB analysis is performed in several steps. First, the data are decomposed into Meyer wavelets. Time-frequency resolutions of (, , , , , [Hz s]) are used for the low-frequency search and (, , , , , [Hz s]) for the high-frequency search. The data are processed with a linear predictor error filter to remove power lines, violin modes and other predictable data components. Triggers are identified as sets of wavelet pixels among the detectors containing excess power at time delays consistent with a gravitational wave from a physical sky position. For each trigger, trial incoming sky locations are sampled with resolution, and various coherent statistics are computed. These include the maximum likelihood ratio (a measure of the sum-squared matched-filter SNR detected in the network), the network correlated amplitude , the network correlation coefficient (), the energy disbalance statistics , and the penalty factor . (Each of these statistics is described in detail in Abbott et al. (2009b).) The trial sky position giving the largest is selected as the best-guess incident direction, and the coherent statistics for this position are recorded. Finally, several post-production selection cuts are applied to the triggers to reduce the background.
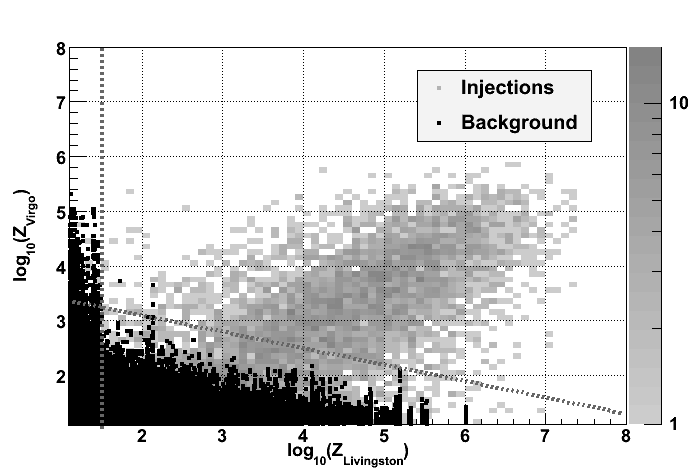
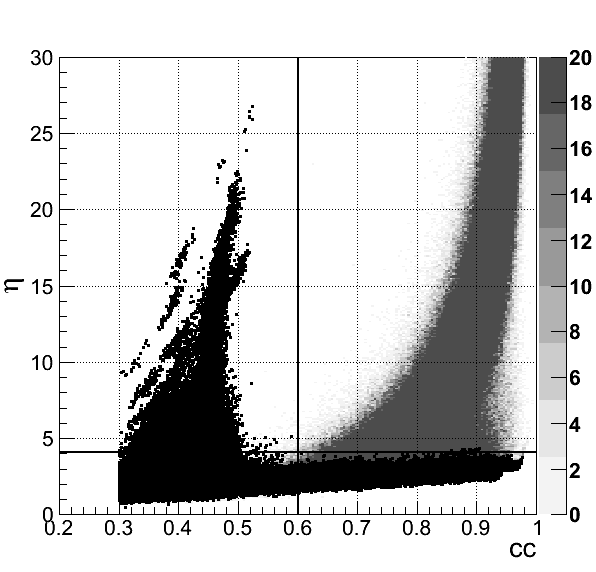
Two groups of selection cuts are used in cWB. First, cuts on , , and are used to distinguish noise outliers from genuine GW signals. The most powerful consistency cut is based on the network correlation coefficient . For example, Figure 9 shows a scatter plot of background triggers as a function of and . Strong outliers (with large values of ) are characterized by low values of and are well separated from simulated signals. Additional selection cuts are based on the energy disbalance statistics , , and . They are used to reject specific types of background events, such as H1-H2 correlated transients.
The second, final cut is on the network correlated amplitude , which characterizes the significance of the triggers. Due to different characteristics of the background noise during the run and in the different frequency bands, the threshold on is selected separately for each network configuration and frequency band to give false alarm probabilities of a few percent. In particular, in the low-frequency search separate thresholds are used for triggers below and above 200 Hz. Table 7 shows the thresholds used in the analysis.
| cWB LF | cWB HF | ||||||||
|---|---|---|---|---|---|---|---|---|---|
| H1H2L1V1 | 0.5 | 4.5 | 4.1 | 0.3 | 0.35 | 0.6 | 0.6 | 4.3 | 0.6 |
| H1H2L1 | 0.6 | 6.0 | 4.2 | 0.3 | 0.35 | 0.6 | 0.6 | 4.1 | 0.6 |
| H1H2V1 | - | - | - | - | - | - | 0.7 | 4.6 | 0.6 |
| H1L1V1 | 0.5 | 5.0 | 5.0 | - | 0.7 | 0.6 | 0.6 | 6.0 | 0.6 |
| H1H2 | 0.6 | 6.0 | 4.1 | 0.3 | 0.35 | 0.6 | 0.5 | 5.0 | 0.6 |
| H1L1 | 0.6 | 9.0 | 5.5 | - | 0.35 | 0.6 | - | - | - |
| H2L1 | 0.6 | 6.5 | 5.5 | - | 0.35 | 0.6 | - | - | - |
The background is estimated separately on each segment of data processed. The cWB algorithm forms circular data buffers and shifts one detector with respect to the others, repeating the analysis hundreds of times on the time-shifted data. Table 8 shows the number of lags and accumulated background observation time for the various cWB searches and network configurations. The background data sets are used for tuning of the cWB selection cuts and also for estimation of the significance of the foreground events. For example, to estimate the significance of the blind injection identified by cWB, we generated a background sample with observation time equivalent to approximately 1000 H1H2L1 S5y2/VSR1 data sets.
| cWB LF Background | cWB HF Background | |||||
| # lags | Obs time | FAR | # lags | Obs time | FAR | |
| [] | [] | [] | [] | |||
| H1H2L1V1 | 200 | 34.8 | 0.3 | 96 | 17.6 | 0.17 |
| H1H2L1 | 1000 | 499.9 | 0.1 | 96 | 31.7 | 0.09 |
| H1H2V1 | - | - | - | 96 | 3.7 | 0.27 |
| H1L1V1 | 200 | 1.8 | 3.3 | 288 | 3.0 | 0.33 |
| H1H2 | 200 | 28.2 | 0.04 | 192 | 17.2 | 0.06 |
| H1L1 | 200 | 4.6 | 2.0 | - | - | - |
| H2L1 | 200 | 1.6 | 0.6 | - | - | - |
References
- Cutler and Thorne (2002) C. Cutler and K. S. Thorne, in Proc. of GR16 (2002), edited by N. T. Bishop and S. D. Maharaj (World Scientific, Singapore), eprint gr-qc/0204090.
- Pretorius (2009) F. Pretorius, in Physics of Relativistic Objects in Compact Binaries: from Birth to Coalescence, edited by M. Colpi et al. (Springer Verlag, Canopus Publishing Limited, 2009), eprint arXiv:0710.1338.
- Etienne et al. (2008) Z. B. Etienne et al., Phys. Rev. D 77, 084002 (2008).
- Ott (2009) C. D. Ott, Class. Quantum Grav. 26, 063001 (2009).
- Baiotti et al. (2007) L. Baiotti et al., Class. Quantum Grav. 24, S187 (2007).
- Mereghetti (2008) S. Mereghetti, Astron. Astrophys. Rev. 15, 225 (2008).
- Andersson and Comer (2001) N. Andersson and G. L. Comer, Phys. Rev. Lett. 87, 241101 (2001).
- Damour and Vilenkin (2001) T. Damour and A. Vilenkin, Phys. Rev. D 64, 064008 (2001).
- Abbott et al. (2009a) B. P. Abbott et al., Rep. Prog. Phys. 72, 076901 (2009a).
- Grote (2008) H. Grote (for the LIGO Scientific Collaboration), Class. Quantum Grav. 25, 114043 (2008).
- Acernese et al. (2008) F. Acernese et al., Class. Quant. Grav. 25, 114045 (2008).
- Abbott et al. (2009b) B. P. Abbott et al., Phys. Rev. D 80, 102001 (2009b).
- Abbott et al. (2009c) B. P. Abbott et al., Phys. Rev. D 80, 102002 (2009c).
- Astone et al. (2003) P. Astone et al., Phys. Rev. D 68, 022001 (2003).
- Astone et al. (2007) P. Astone et al., Phys. Rev. D 76, 102001 (2007).
- Alessandro et al. (1990) B. Alessandro, C. Beatrice, G. Bertotti, and A. Montorsi, J. Appl. Phys. 68, 2908 (1990).
- Braccini et al. (2005) S. Braccini et al., Astroparticle Physics 23, 557 (2005).
- Anderson et al. (2001) W. G. Anderson, P. R. Brady, J. D. Creighton, and É. É. Flanagan, Phys. Rev. D 63, 042003 (2001).
- Chatterji (2005) S. K. Chatterji, Ph.D. thesis, Massachusetts Institute of Technology (2005).
- McNabb et al. (2004) J. W. C. McNabb et al., Class. Quantum Grav. 21, 1705 (2004).
- Klimenko et al. (2004) S. Klimenko, I. Yakushin, M. Rakhmanov, and G. Mitselmakher, Class. Quantum Grav. 21, S1685 (2004).
- Beauville et al. (2008) F. Beauville et al., Class. Quantum Grav. 25, 045002 (2008).
- Chatterji et al. (2004) S. Chatterji, L. Blackburn, G. Martin, and E. Katsavounidis, Class. Quantum Grav. 21, S1809 (2004).
- Klimenko et al. (2008) S. Klimenko et al., Class. Quantum Grav. 25, 114029 (2008).
- Klimenko et al. (2005) S. Klimenko, S. Mohanty, M. Rakhmanov, and G. Mitselmakher, Phys. Rev. D 72, 122002 (2005).
- Benhar et al. (2004) O. Benhar, V. Ferrari, and L. Gualtieri, Phys. Rev. D 70, 124015 (2004).
- Sutton (2009) P. J. Sutton (2009), eprint arXiv:0905.4089 [physics.data-an].
- Abbott et al. (2007) B. Abbott et al., Class. Quantum Grav. 24, 5343 (2007).
- Abbott et al. (2005) B. Abbott et al., Phys. Rev. D 72, 062001 (2005).
- Ott et al. (2006) C. D. Ott, A. Burrows, L. Dessart, and E. Livne, Phys. Rev. Lett. 96, 201102 (2006).
- Blackburn et al. (2008) L. Blackburn et al., Class. Quantum Grav. 25, 184004 (2008).
- Leroy et al. (2009) N. Leroy et al., Class. Quantum Grav. 26, 204007 (2009).
- Blackburn et al. (2005) L. Blackburn et al., LIGO-G050158-00-Z (2005), URL http://www.ligo.caltech.edu/docs/G/G050158-00.
- Ballinger et al. (2009) T. Ballinger et al., Class. Quantum Grav. 26, 204003 (2009).
- Clapson et al. (2008) A. C. Clapson et al., Class. Quantum Grav. 25, 035002 (2008).
- Acernese et al. (2009) F. Acernese et al., Class. Quantum Grav. 26, 085009 (2009).
- Arnaud et al. (2003) N. Arnaud et al., Phys. Rev. D 67, 102003 (2003).
- Makhoul (1975) J. Makhoul, in Proc. IEEE (1975), vol. 63 of Institute of Electrical and Electronics Engineers, Inc. Conference, pp. 561–580.
- Abbott et al. (2008) B. Abbott et al., Class. Quant. Grav. 25, 245008 (2008).