Scattered X-rays in Obscured Active Galactic Nuclei and their Implications for Geometrical Structure and Evolution
Abstract
We construct a new sample of 32 obscured active galactic nuclei (AGNs) selected from the Second XMM-Newton Serendipitous Source Catalogue to investigate their multiwavelength properties in relation to the “scattering fraction”, the ratio of the soft X-ray flux to the absorption-corrected direct emission. The sample covers a broad range of the scattering fraction (0.1%10%). A quarter of the 32 AGNs have a very low scattering fraction (%), which suggests that they are buried in a geometrically thick torus with a very small opening angle. We investigate correlations between the scattering fraction and multiwavelength properties. We find that AGNs with a small scattering fraction tend to have low [O III]5007/X-ray luminosity ratios. This result agrees with the expectation that the extent of the narrow-line region is small because of the small opening angle of the torus. There is no significant correlation between scattering fraction and far-infrared luminosity. This implies that a scale height of the torus is not primarily determined by starburst activity. We also compare scattering fraction with black hole mass or Eddington ratio and find a weak anti-correlation between the Eddington ratio and scattering fraction. This implies that more rapidly growing supermassive black holes tend to have thicker tori.
Subject headings:
galaxies: active, galaxies: Seyfert, X-rays: galaxies1. Introduction
Understanding the cosmological evolution of active galactic nuclei (AGNs) is an important issue in modern astrophysics and is closely related to the evolution of galaxies. One piece of evidence for “co-evolution” of AGNs and galaxies is the strong correlation between a central black hole and its host galaxy (e.g., Magorrian et al. 1998; Marconi & Hunt 2003). In an early stage of galaxy evolution, the nuclear region may be hidden behind rich gas, which leads to active star formation. Indeed recent models predict that the central black holes in all galaxies experience a heavily obscured phase (Hopkins et al. 2006, 2008). Therefore, investigating obscured AGNs is of significant interest to study the co-evolution of black holes and galaxies. Moreover, previous observations have shown that obscured AGNs are a major population of the AGN. Finally, obscured AGN are predicted to be the main contributors to the unexplained cosmic X-ray background (CXB) in the hard X-rays (Comastri et al. 1995; Ueda et al. 2003; Gilli et al. 2007). Thus, obscured AGN population is a key class to understand the overall AGN population, AGN evolution, and relationship between black holes and their hosts.
According to a unified model of the AGN, obscuring matter referred to as a “torus” is surrounding a supermassive black hole and gas photoionized by the AGN is created in the opening part of the torus (Antonucci 1993). If we observe an AGN from the torus side, absorbed direct emission from the nucleus and emission scattered by the photoionized gas are observed in the X-ray spectra. A scattering fraction is calculated as the fraction of the scattered emission with respect to the direct emission and reflects the solid angle of the opening part of the torus and/or an amount of gas responsible for scattering. Suzaku’s follow-up observations of Swift BAT-detected AGNs found a new type of AGN with a very small scattering fraction ( 0.5%; Ueda et al. 2007; Eguchi et al. 2009; Winter et al. 2009). Assuming that the amount of scattering medium does not differ much from object to object, they would be buried in a geometrically thick torus with a small opening angle. Noguchi et al. (2009) found several buried AGN candidates with a very small scattering fraction from the Second XMM-Newton Serendipitous Source Catalogue () using hardness ratios (HRs) and showed that such type of AGNs tend to have a low relative [O III]5007 luminosity compared to the intrinsic X-ray luminosity. This implies that the AGN with a small scattering fraction could constitute the main class of optically elusive obscured AGNs.
In this paper, we construct a new sample of obscured AGNs covering a broad range of scattering fractions from Catalogue in the same way as Noguchi et al. (2009), and investigate multi-wavelength properties of a buried AGN in comparison with a classical type of AGN having a large scattering fraction. In Section 2, we describe the selection method of a new sample of obscured AGNs that covers a broad range of scattering fractions. Our results of X-ray and optical spectral analysis are briefly presented in Section 3, and their multiwavelength properties are discussed in Section 4. Finally, we summarize our results in Section 5. We adopt (H0, , ) (70 km s-1Mpc-1, 0.3, 0.7) throughout this paper.
2. Sample Selection
We used the Catalogue produced by the XMM-Newton Survey Science Centre, which contains 250,000 detections drawn from 3500 XMM-Newton EPIC observations made between 2000 and 2007 (Watson et al. 2009). The median flux in the full energy band (0.212 keV) is 2.510-14 erg cm-2 s-1, and about 20% of the sources have total fluxes below 110-14 erg cm-2 s-1.
We derived a sample that covers a wide range of scattering fractions (0.1%10%) from the Catalogue using the HRs in the same way as Noguchi et al. (2009) as briefly summarized below. We used HRs defined as
and
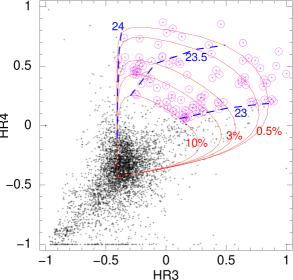
where CR(1.02.0 keV), CR(2.04.5 keV), and CR(4.512 keV) are count rates in the 1.02.0, 2.04.5, and 4.512 keV bands, respectively. Only 4627 sources, which have count rate for EPIC-pn in 0.212 keV 0.05 counts s-1, high Galactic latitude ( 20∘), and error of HRs 0.2 at a 90% confidence level, were targeted in this selection. The values and errors of HR3 and HR4 given in the Catalogue were calculated using count rates measured by the emldetect task in the XMM-Newton Science Analysis System (SAS). In Figure 1, their HR3 and HR4 are plotted. The five solid lines represent the scattering fractions of 10%, 5%, 3%, 1%, and 0.5% from inside to outside. The three dashed lines correspond to objects with log NH (cm-2) = 23, 23.5, and 24 from lower right to upper left. In calculating these lines, we assumed an intrinsic spectrum of a power law with a photon index of 1.9. The details on how to draw these lines are described in Noguchi et al. (2009). Based on the solid line for 10% and dashed lines for log NH = 23 and 24, we selected objects as shown by circles in this figure as our sample for which log NH and scattering fraction () are in the range 2324 and less than 10%, respectively.
We excluded low-luminosity AGNs with the intrinsic 210 keV luminosity lower than 1041 erg s-1 and Compton-thick AGNs with column densities of log NH 1.51024 cm-2 from our sample because of the following reasons. Soft X-rays of low-luminosity AGNs would be contributed by X-ray emission from hot gas and discrete sources in their host galaxies, and direct emission of Compton-thick AGNs is almost completely blocked below 10 keV. Therefore, scattering fractions of these classes of objects cannot be calculated correctly. We analyzed X-ray spectra obtained by XMM-Newton to identify Compton-thick and low-luminosity AGNs. If an X-ray continuum spectrum above 4 keV is fitted by a pure reflection component and the equivalent width of Fe-K with respect to the reflection component is greater than 1 keV (Matt et al. 1991), we classified such objects as a Compton-thick AGN. The absorption corrected 210 keV luminosities were calculated from the best-fit models obtained in the same ways as discussed in Section 3.1, and objects with the luminosity lower than 1041 erg s-1 were regarded as a low-luminosity AGN. Objects listed as a Seyfert 1, 1.5 or a star in NASA/IPAC Extragalactic Database (NED) were excluded. Objects with a scattering fraction more than 10%, which was calculated from a formula described in Section 4.1, were also removed from our sample. Furthermore, NGC 1052 was excluded from the sample because this object shows complicated spectrum requiring a double partial covering model, and a component absorbed by 21022 cm-2 is relatively strong, which makes it difficult to measure the scattering fraction. We finally selected 32 objects as members of our sample, of which 10 objects are newly selected AGNs and the others are included in Noguchi et al. (2009) sample.
A summary of the newly selected AGNs and their properties is found in Table 2. Most of the AGNs in our sample are at 0.1 because we assumed = 0 in the simulation of AGN spectra used to calculate the expected hardness ratios and our sample was selected from bright sources (count rate in 0.212 keV 0.05 counts s-1). The Galactic column densities are calculated from 21 cm measurements (Kalberla et al. 2005) using the nh tool at the NASA’s High Energy Astrophysics Science Archive Research Center. Since XMM-Newton results of some of the objects in our sample have been published, references for them are also listed in Table 2.
| Name | Other Name | Class | Referencea | Redshift | b | Start Date | Exposurec | Count Rated | Referencee |
|---|---|---|---|---|---|---|---|---|---|
| ( cm-2) | (s) | (counts s-1) | |||||||
| J030030.5112456 | MCG 0208039 | Sy2 | 1 | 0.030 | 5.13 | 2006 Jan 23 | 5335 | 0.14 | |
| J031000.0+170559 | 3C 79 | Sy2 | 1 | 0.256 | 8.72 | 2004 Feb 14 | 9302 | 0.035 | 3 |
| J033336.3360825 | NGC 1365 | Sy1.8 | 1 | 0.005 | 1.34 | 2003 Jan 17 | 15142 | 0.66 | 4 |
| J085537.7+781324 | NGC 2655 | Sy2 | 2 | 0.005 | 2.18 | 2005 Sep 04 | 3117 | 0.20 | 5 |
| J104943.4+583750 | 2MASX J10494334+5837501 | 0.115 | 0.667 | 2005 Oct 10 | 21908 | 0.044 | |||
| J113240.2+525701 | Mrk 176 | Sy2 | 1 | 0.027 | 1.09 | 2004 May 02 | 9639 | 0.053 | 6 |
| J134442.1+555312 | Mrk 273 | Sy2 | 1 | 0.038 | 0.890 | 2002 May 07 | 18018 | 0.067 | 7 |
| J135602.7+182218 | Mrk 463 | Sy2 | 1 | 0.051 | 2.03 | 2001 Dec 22 | 21081 | 0.12 | 8, 9 |
| J201657.3704459 | IC 4970 | 0.016 | 4.09 | 2002 Mar 31 | 19129 | 0.015 | |||
| J224937.0191627 | MCG 0358007 | Sy2 | 1 | 0.0315 | 2.06 | 2005 May 09 | 2024 | 0.13 |
References. — (1)Veron-Cetty & Veron 2006 (2) Ho et al. 1997; (3) Hardcastle et al. 2006; (4) Risaliti et al. 2005; (5) Akylas & Georgantopoulos 2009; (6) Guainazzi et al. 2005; (7) Balestra et al. 2005; (8) Awaki et al. 2006; (9) Bianchi et al. 2008.
3. Spectral Analysis
3.1. X-ray Spectra
We analyzed X-ray spectra of newly selected sources to calculate the scattering fraction. In the current analysis, the spectra were grouped to a minimum of 15 counts per bin and the minimization technique was used. The quoted errors are given at the 90% confidence level for one interesting parameter (i.e., = 2.71). We performed spectral fits for our sample in the 0.410 keV range with various models by using XSPEC version 11.2. First, all spectra were fitted with a baseline model consisting of absorbed and unabsorbed power laws, along with a Gaussian corresponding to an Fe-K line. zpowerlw and zgauss models in XSPEC were used to account for the power laws and the Gaussian line, respectively. All the components are modified by the Galactic absorption. Our baseline model is shown as phabs*(zpowerlw + zphabs*(zpowerlw + zgauss)) in XSPEC, where zphabs and phabs are models corresponding to photoelectric absorption by cold matter at the redshift of the source and in our Galaxy, respectively. The photon indices () of the two power laws were linked.
None of the spectra of the 10 objects were satisfactorily fitted with the baseline model. The spectrum of IC 4970 was explained by adding another absorption for the less absorbed power law to the baseline model. For the other objects, we used a complex model, in which an optically thin thermal plasma model (mekal model in XSPEC; Mewe et al. 1985, Kaastra. 1992, Liedahl et al. 1995) and/or a Compton reflection model (pexrav model in XSPEC) were added to the baseline model. For the mekal model, the abundance was fixed at 0.5 solar, where the solar abundance table by Anders and Grevesse (1989) was assumed. For the pexrav model, the inclination angle of the reflector and the high-energy cutoff of the incident power law were fixed at 60∘ (0∘ corresponds to face-on) and at 300 keV, respectively. The solar abundance table by Anders & Grevesse (1989) was assumed. rel_refl parameter was set to 1 to produce a reflection component only. The normalization and the photon index of pexrav were assumed to be the same as that of the heavily absorbed power law. Since the reflection component of NGC 1365 required further absorption, we applied a zphabs model to the pexrav model. Furthermore, if needed, we added another mekal component and/or Gaussian lines as many as required to model the soft part of the spectrum.
Table 2 shows the best-fit models. The spectra with the models are shown in Figure 2. The spectral parameters for the models are summarized in Tables 35. were distributed between 1.5 and 2.0, which is the range of values for Seyfert 2s (Smith & Done 1996), although we fixed the value at 1.9 for some objects since uncertainties of became large ( 20% at the 90% level of confidence for one interesting parameter) or was far from a typical range (about 1.42.4), if was left free. The obtained were in the range of 1023-24 cm-2. We calculated absorption-corrected luminosities for the power-law components in 210 keV and of soft components in 0.52 keV using the best-fit model. The 0.52 keV luminosities were calculated using all the components except for the heavily absorbed power law corresponding to direct emission. The calculated luminosities are summarized in Table 3.1. The luminosities for our sample are in the range of Seyferts (1041-44 erg s-1).


| Name | Modela |
|---|---|
| MCG 0208039 | BM + MEKAL + two lines |
| 3C 079 | BM + MEKAL |
| NGC 1365 | BM + MEKAL + nine lines + abs-Ref |
| NGC 2655 | BM + MEKAL |
| 2MASX J10494334+5837501 | BM + two MEKAL + Ref |
| Mrk 176 | BM + MEKAL + abs-Ref |
| Mrk 273 | BM + MEKAL |
| Mrk 463 | BM + MEKAL |
| IC 4970 | BMb |
| MCG 0358007 | BM + two MEKAL |
| Name | a | EW | b | c | (dof) | ||||
|---|---|---|---|---|---|---|---|---|---|
| ( cm-2) | (keV) | (eV) | (eV) | ||||||
| MCG 0208039 | 33 | 1.9(f) | 0.92 | 6.435 | 10(f) | 320 | 0.88 | 2.30 | 1.12(33) |
| 3C 79 | 48 | 1.9(f) | 0.69 | 6.4(f) | 10(f) | 0(110) | 0(0.28) | 1.18 | 0.93(17) |
| NGC 1365 | 65.3 | 2.056 | 12.4 | 6.390 | 0(124) | 83 | 1.7 | 10.09 | 1.08(186) |
| NGC 2655 | 31 | 1.9(f) | 1.11 | 6.4(f) | 10(f) | 65(280) | 0.21(0.90) | 3.19 | 0.79(36) |
| 2MASX J10494334+5837501 | 28.9 | 1.9(f) | 0.367 | 6.403 | 60(195) | 300 | 0.36 | 0.40 | 1.14(65) |
| Mrk 176 | 62.4 | 1.9(f) | 1.081 | 6.4(f) | 10(f) | 200 | 0.66 | 0.83 | 1.11(27) |
| Mrk 273 | 82 | 1.59 | 0.52 | 6.4(f) | 10(f) | 240 | 0.68 | 2.05 | 1.21(72) |
| Mrk 463 | 46.4 | 2.02 | 1.12 | 6.414 | 10(f) | 250 | 0.70 | 3.21 | 1.02(136) |
| IC 4970 | 32 | 1.9(f) | 0.34 | 6.410 | 0(100) | 470 | 0.47 | 1.13 | 0.65(20) |
| MCG 0358007 | 23.5 | 1.9(f) | 0.78 | 6.4(f) | 10(f) | 0(480) | 0(1.14) | 1.12 | 0.68(10) |
Note. — Photon index of the power law with only Galactic absorption was assumed to be the same value as power law absorbed by cold matter at the redshift of the source. (f) indicates fixed parameter.
| Additional | |||||
|---|---|---|---|---|---|
| MEKALa | MEKALa | Absorption | |||
| Name | kT | b | kT | b | |
| (keV) | (keV) | ( cm-2) | |||
| MCG 0208039 | 0.197 | 14.3 | |||
| 3C 79 | 0.35 | 1.14 | |||
| NGC 1365 | 0.635 | 22.26 | 0.63c | ||
| NGC 2655 | 0.535 | 9.7 | |||
| 2MASX J10494334+5837501 | 0.54 | 0.612 | 0.081(0.085) | 28.8 | |
| Mrk 176 | 0.61 | 1.66 | 0.081(0.095) | 18 | |
| Mrk 273 | 0.695 | 3.00 | |||
| Mrk 463 | 0.664 | 4.15 | |||
| IC 4970 | 0.13d | ||||
| MCG 0358007 | 0.36 | 5.2 | 0.081(0.11) | 125 | |
| Name | a | Identification | ||
|---|---|---|---|---|
| (keV) | (eV) | |||
| MCG 0208039 | 0.467 | 10(f) | 3.5 | N VI K, N VII K |
| 0.959 | 10(f) | 0.70 | Ne X K , Ne X K | |
| NGC 1365 | 0.544 | 10(f) | 2.42 | O VII K |
| 1.202 | 10(f) | 0.67 | Ne V Ly | |
| 1.354 | 10(f) | 0.61 | Mg IV K | |
| 1.820 | 10(f) | 0.37 | Si VIII | |
| 2.65 | 10(f) | 0.29 | S XVI Ly | |
| 6.687 | 10(f) | 2.66 | Fe XXV K | |
| 7.002 | 10(f) | 1.48 | Fe XXVI K | |
| 7.98 | 10(f) | 1.6 | Fe XXV K | |
| 8.287 | 10(f) | 1.63 | Fe XXVI K |
Note. — (f) indicates fixed parameter.
| Name | Harda | Softb | /c | d | Ref.e | f | Ref.g | h | i | j | |
|---|---|---|---|---|---|---|---|---|---|---|---|
| AGN in Noguchi et al. (2009) | |||||||||||
| Mrk 348 | 43.49 | 40.82 | 43.49 | 1.5 | 41.95 | 1 | 6.7 | 12 | 0.2 | 0.4 | 0.4 |
| 3C 33 | 44.07 | 41.55 | 42.52 | 2 | 0.3 | ||||||
| 2MASX J022813500315023 | 43.46 | 41.01 | 0.5 | ||||||||
| NGC 1142 | 43.51 | 41.25 | 44.77 | 8.4 | 41.87 | 3 | 8.2 | 12 | 1.3 | 0.8 | 0.3 |
| 3C 98 | 43.01 | 41.00 | 41.91 | 4 | 2.0 | ||||||
| B2 0857+39 | 44.12 | 41.77 | 0.6 | ||||||||
| IC 2461 | 41.83 | 38.93 | 43.00 | 40.85 | 5 | 0.2 | |||||
| 2MASX J10335255+0044033 | 43.75 | 41.77 | 43.62 | 6 | 1.4 | ||||||
| MCG +0821065 | 42.65 | 39.95 | 43.51 | 39.78 | 7 | 0.3 | 0.1 | ||||
| NGC 4074 | 42.88 | 40.88 | 42.05 | 8 | 7.9 | 13 | 1.6 | 1.4 | |||
| NGC 4138 | 41.21 | 38.88 | 38.75 | 9 | 7.6 | 14 | 3.0 | 1.2 | |||
| NGC 4388 | 42.89 | 40.63 | 43.94 | 2.9 | 41.77 | 1 | 7.0 | 13 | 0.7 | 1.4 | 0.8 |
| NGC 4507 | 43.09 | 41.19 | 43.81 | 3.1 | 41.69 | 1 | 7.5 | 12 | 1.0 | 3.1 | 2.9 |
| ESO 506G027 | 43.69 | 40.58 | 43.58 | 1.9 | k | 0.2 | 0.1 | ||||
| 2MASX J125441963019224 | 43.07 | 41.00 | 41.60 | 5 | 1.4 | ||||||
| NGC 4939 | 42.33 | 40.31 | 43.59 | 5.4 | 41.43 | 1 | 7.6 | 15 | 1.8 | 1.3 | 0.8 |
| ESO 383G18 | 42.60 | 40.27 | 1.4 | 40.36 | 5 | 1.3 | |||||
| ESO 103G035 | 43.33 | 40.35 | 43.54 | 1.0 | 41.65 | 1 | 7.0 | 15 | 0.3 | 0.1 | 0.1 |
| IC 4995 | 41.96 | 40.65 | 43.40 | 2.5 | 41.96 | 8 | 7.1 | 13 | 1.8 | 8.1 | 7.2 |
| NGC 7070A | 41.75 | 39.33 | 42.40 | l | 6.8 | 14 | 1.7 | 0.9 | 0.7 | ||
| NGC 7172 | 43.06 | 40.18 | 43.77 | 7.1 | 39.83 | 1 | 7.5 | 12 | 1.1 | 0.3 | 0.1 |
| NGC 7319 | 42.96 | 40.92 | 41.44 | 1 | 7.2 | 13 | 0.9 | 1.3 | |||
| Newly selected AGN | |||||||||||
| MCG 0208039 | 42.71 | 41.48 | 1.1 | 41.62 | 10 | 7.7 | 12 | 1.6 | 8.2 | ||
| 3C 079 | 44.45 | 42.69 | 2.8 | 2.4 | |||||||
| NGC 1365 | 42.29 | 40.58 | 44.53 | 6.6 | 40.97 | 1 | 2.1 | ||||
| NGC 2655 | 41.20 | 39.99 | 42.78 | 6.0 | 39.91 | 9 | 7.6 | 14 | 3.1 | 8.3 | 7.2 |
| 2MASX J10494334+5837501 | 43.49 | 41.83 | 3.0 | ||||||||
| Mrk 176 | 42.73 | 40.87 | 43.96 | 3.0 | 42.51 | 11 | 8.0 | 13 | 1.9 | 1.9 | 1.4 |
| Mrk 273 | 42.90 | 41.42 | 45.53 | 9.5 | 42.45 | 1 | 8.1 | 12 | 1.8 | 7.3 | |
| Mrk 463 | 43.18 | 41.84 | 44.76 | 1.4 | 42.87 | 1 | 5.3 | 4.4 | |||
| IC 4970 | 41.71 | 39.96 | l | 2.4 | |||||||
| MCG 0358007 | 42.70 | 41.39 | 44.44 | 3.0 | 41.78 | 10 | 6.6 | 5.1 | |||
References. — (1) Bassani et al. 1999; (2) Yee & Oke 1978; (3) Shu et al. 2007; (4) Costero & Osterbrock 1977; (5) This work; (6) Dong et al. 2005; (7) Line flux measurement based on the Sloan Digital Sky Survey data at MPA/JHU (http://www.mpa-garching.mpg.de/SDSS/); Kauffmann et al. 2003; (8) Polletta et al. 1996; (9) Ho et al. 1997; (10) de Grijp et al. 1992; (11) Mulchaey et al. 1994; (12) Garcia-Rissmann et al. 2005; (13) Nelson & Whittle 1995; (14) McElroy 1995; (15) Cid Fernandes et al. 2004
3.2. Optical Spectra
Optical spectroscopic observations of four targets in our sample, 2MASX J12544196–3019224, IC 4970, NGC 7070A, and ESO 383–G18, were performed during several nights between 2008 August 9 and 11 by using the South African Astronomical Observatory (SAAO) 1.9 m telescope with the Cassegrain spectrograph. The grating six, which has a spectral range of about 35005300 Å at a resolution around 4 Å, was used with 2 arcsec slit placed on the center of each galaxy, for a total integration time ranging from 750 to 3600 s. The data reduction and analysis was made in a standard manner with the IRAF package to derive the flux calibrated spectra. To obtain the sensitivity curve, we fitted the observed spectral energy distribution (SED) of standard stars with low-order polynomials. We detected [O III]5007 as well as H and H narrow lines from 2MASX J12544196–3019224 and ESO 383–G18. Their narrow lines and line intensity ratios indicate that 2MASX J12544196–3019224 and ESO 383–G18 are a Seyfert 2 and H II nucleus, respectively. For IC 4970 and NGC 7070A, we derived the 90% upper limits on the [O III] intensity, based on an estimated rms noise in the continuum flux around the corresponding wavelength. The fluxes were corrected for the slit loss, estimated from the image extent of the target or a nearby point-like source projected onto the spatial direction. We also analyzed calibrated optical spectrum of IC 2461 taken from the Sloan Digital Sky Survey (SDSS) Data Release 7. The narrow lines and line intensity ratios indicate a Seyfert 2. The line fluxes and the spectra of the five objects are shown in Table 7 and Figure 4, respectively.
| Name | [O III] | H | H | Class |
|---|---|---|---|---|
| IC 2461 | 4.2 | 3.9 | 0.50 | Sy2 |
| 2MASX J125441963019224 | 4.1 | 1.9 | 0.58 | Sy2 |
| ESO 383G18 | 14 | 6.5 | 2.8 | H II |
| NGC 7070A | 1 | |||
| IC 4970 | 2 |
Note. — Fluxes are in units of 10-14 erg cm-2 s-1. Upper limits are at a 90% confidence level.
4. Discussion
4.1. Scattering Fraction
We first calculated a scattering fraction (fscat) for our sample consisting 32 AGNs with the equation
where and are absorption corrected fluxes in the 0.52 keV band for the absorbed power law and all the components except for the heavily absorbed power law, respectively. The calculated values are shown in Table 3.1. Various components other than scattered emission, however, may contribute to the soft X-rays in obscured AGNs such as thermal emission originated from hot plasma collisionally heated by starburst activity. In fact, high-resolution images available with Chandra show that the soft X-ray emission is dominated by the starburst component in some cases (NGC 4945, Schurch et al. 2002), although the XMM-Newton Reflection Grating Spectrometer (RGS) high-resolution spectra show evidence that the soft X-ray emission appears to be dominated by AGN emission for most Seyfert 2 galaxies with high-quality data (Guainazzi & Bianchi 2007). Therefore, the value calculated from the above equation is regarded as an upper limit on the scattering fraction.
We examined the starburst contribution to the soft X-rays for our sample using far-infrared luminosities (LFIR), and calculated scattering fractions by subtracting the estimated contribution. LFIR is often used to estimate starburst activity although we cannot rule out the contribution of AGNs and host galaxies to LFIR. We calculated LFIR for our sample using the formula defined in Helou et al. (1985), based on flux densities at 60 m and 100 m. We collected infrared fluxes (60 m and 100 m) measured with Infrared Astronomical Satellite (IRAS) for 18 of 32 objects from NED. IRAS fluxes for the rest of the 14 objects are not available. Observations with upper limits were not used. LFIR for our sample is shown in Table 3.1. Ranalli et al. (2003) show that there is a strong correlation between LFIR and for starburst and normal galaxies as expressed by
We estimated a 0.52 keV luminosity created by starburst (L) using this correlation and calculated the scattering fraction as
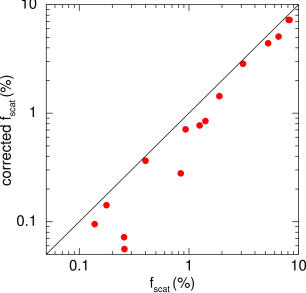
The calculated values are shown in Table 3.1. In Figure 5, values are compared with . IC 2461, NGC 1365, and Mrk 273 were not plotted in this figure since the values of are negative. This means that starburst contribution to their soft X-rays is substantial. In fact, recent XMM-Newton RGS spectra of NGC 1365 show soft X-ray emission dominated by collisionally ionized plasma (Guainazzi et al. 2009). Figure 5 shows a relatively tight correlation between and , although the values of are lower than and the scatter for objects with a small is larger than for a large . The tight correlation, particularly at large , is consistent with the idea that the soft X-rays dominated by emission from photoionized gas are likely to be a common characteristic of Seyfert 2 galaxies. Therefore, in the following discussions, we use since the values can be calculated for all objects in our sample.
From our spectral analysis combined with our previous results, we found that for our sample are in the range of 0.1%10%. In particular, those of eight objects are very small ( 0.5%) as reported in Noguchi et al. (2009), whereas a typical value for Seyfert 2s previously studied is about 3% (Bianchi & Guainazzi 2007; Turner et al. 1997). The scattering fraction is proportional to both the solid angle subtended by the scattering electrons and a scattering optical depth. Thus, such a very small implies that they would be a new type of AGN buried in a very geometrically thick torus with a small opening angle (Ueda et al. 2007; Winter et al. 2008, 2009; Eguchi et al. 2009; Noguchi et al. 2009) on the assumption that the optical depth of scatterer is nearly constant among the objects. Our sample that covers a broad range of allows us to investigate properties of buried AGNs with a small by comparing with those of a classical type of Seyfert 2s with a large .


4.2. Geometry of Obscuring Material
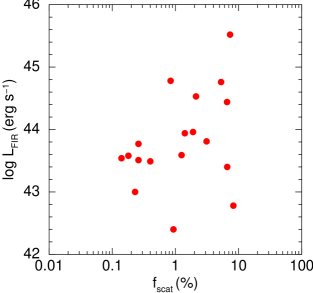
Fabian et al. (1998) proposed a model in which low-luminosity AGNs were obscured by starburst in the inner 100 pc of a central massive black hole and suggested that supernovae from nuclear starburst input the energy to the circumnuclear gas to create a torus-like structure. This suggestion was investigated in more detail using three-dimensional hydrodynamic simulations (Wada & Norman 2002, 2007). Seyfert galaxies with nuclear starburst within a few hundred pc from the center were indeed found observationally (Imanishi 2002, 2003; Rodriguez-Ardila & Viegas 2003). Therefore, nuclear starburst is considered as a key factor to keep the shape of a torus-like absorber either theoretically or observationally. If this is the case, the scale height of the torus would expand with an increase of the star-forming activity, and starburst activity in objects with a small should be stronger than those in objects with a large . To confirm this expectation, we investigated a relation between and LFIR as shown in Figure 6. We found no significant correlation between them, in contrast to our expectation that there is an anti-correlation. This means that the scale height of the torus seems not to be primarily determined by starburst activity and there are other contributing factors to support the shape of a torus-like absorber.
The absence of a correlation between and might in part be due to a selection bias against infrared luminous objects such as ultraluminous infrared galaxies (ULIRGs), which have most of their luminosity emerging in the infrared with (81000 m) 31045 erg s-1 and contain a substantially large amount of gas and dust in their nuclei compared with classical Seyferts (Sanders & Mirabel 1996). Imanishi et al. (2007) found buried AGNs signatures in a significant fraction of ULIRGs using Spitzer Infrared Spectrograph even though they are optically classified as non-Seyferts, and suggested that AGNs in ULIRGs are almost fully buried in surrounding gas and dust, for which 0 is expected. In our sample, however, only Mrk 273 and Mrk 463 are classified as a ULIRG. The paucity of infrared luminous objects in our sample is possibly due to our selection criteria since many of ULIRGs are heavily obscured by Compton-thick matter 1024 cm-2 (Risaliti et al. 2000; Teng et al. 2009). If we had plotted them in Figure 6, they would be located in the upper left portion since they have fscat 0 and are bright in the infrared, and the anti-correlation may appear in Figure 6 as expected.
4.3. Infrared Color
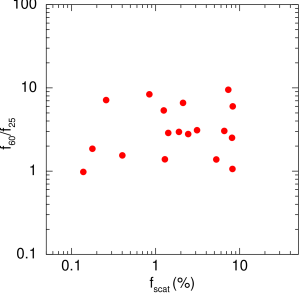
Warm infrared colors of AGNs are usually explained as emission from hot dust in the vicinity of a nucleus. For a buried AGN, the cooler component from the outer region of the torus dominates, since a geometrically thick torus almost covers the center region unless the viewing angle is near face-on. Hence, we predict that buried AGNs with a small scattering fraction show cooler infrared colors. 60 m to 25 m flux ratios (/) for our sample are shown in Table 3.1. Figure 7 compares with / and shows that there is no correlation between them. This result is inconsistent with above prediction. However, this may be explained by the effect of the difference of inclination of the torus to our line of sight because / depends also on the viewing angle (Heisler et al. 1997). If we view a Seyfert galaxy nearly face-on, the value of / becomes smaller because infrared emission from the hot dust near the nucleus can be seen. On the other hand, an edge-on view makes / larger since the hot dust is obscured and cooler component from the outer part dominates. Expected infrared SEDs are calculated by several authors for smooth (Pier & Krolik 1992, 1993; Granato & Danese 1994) and clumpy (Nenkova el al. 2008) distribution of torus. According to these calculations, objects with small may be viewed from a face-on angle, in spite of the fact that their absorption column densities along the line of sight is large (1023-24 cm-2). A similar situation is found in Swift BAT-selected AGNs (Ueda et al. 2007). If we observe them from an edge-on side, their direct emission would be completely blocked by Compton-thick matter ( 1024 cm-2). Thus, if our results are explained in terms of face-on geometry, this implies the existence of a yet to be discovered very Compton-thick AGN.
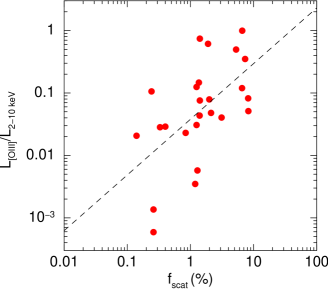
4.4. Scattering Fraction and [O III]
If a scattering fraction reflects the opening angle of the torus, objects with a small should have also a small narrow-line region (NLR), which is considered to exist in the opening region of the torus. We predicted that their [O III] 5007 emission luminosities produced in the NLR are weaker than those for objects with a large at a given X-ray luminosity (Ueda et al. 2007; Noguchi et al. 2009). To test this prediction, Noguchi et al. (2009) compared ratios of reddening corrected [O III] to intrinsic 210 keV luminosities (L/L) for a sample of the buried AGN consisting of 22 objects with a small with those for a large sample of Seyfert2s compiled by Bassani et al. (1999), and found that there is a clear difference in their distributions, with the buried AGNs having smaller ratios of L/L. This result is in good agreement with the above prediction. In this subsection, to confirm the result we examine whether there is a similar relationship between L/L and using our sample, which covers a broad range of .
We used [O III] luminosities collected from the literature as shown in Table 3.1. These values are corrected for the extinction by using the relation
assuming an intrinsic Balmer decrement (H/H)0 = 3.0, where and HH are an observed [O III] luminosity and a ratio between observed H and H line fluxes, respectively (Bassani et al. 1999). The calculated values are shown in Table 3.1.
In Figure 8, we plot L/L against . As expected, we find there is a positive correlation between them. The best-fit liner line (dashed line in Figure 8) is given as
We computed a Spearman’s rank correlation coefficient () and Kendall’s rank correlation coefficient () to determine a level of significance, and found 0.62 (p 0.0011) and 0.45 (p 0.0014), where p is null hypothesis probability. This correlation clearly supports the result obtained by Noguchi et al. (2009) showing L/L for buried AGNs tend to be smaller than other Seyfert 2s. Therefore, as suggested in Noguchi et al. (2009), estimation of intrinsic luminosities of buried AGNs based on [O III] luminosities would result in large uncertainties, and surveys using optical emission lines could be subject to biases against buried AGNs.
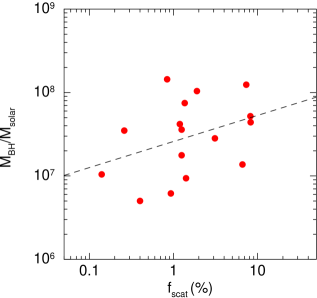
4.5. Black Hole Mass and Eddington Ratio
The black hole mass () is one of the most important pieces of information to represent properties of an AGN, and we compare with . Black hole masses for our sample were estimated from the relation found by Tremaine et al. (2002)
where is a stellar velocity dispersion. The values of for 16 among 32 objects are collected from the literature as shown in Table 3.1. The black hole masses for our sample are in the range 6.7 log() 8.2 (Table 3.1). In Figure 9, we plot against and found only a hint of very weak positive correlation between them ( 0.36 ( 0.17) and 0.25 ( 0.19)). If this trend is real, it is consistent with an X-ray absorption model for a compton-thin AGN described in Lamastra et al. (2006), in which a higher black hole mass leads to a larger opening angle.
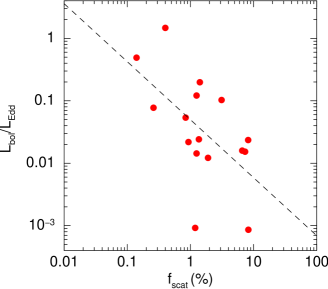
The Eddington ratio () is also an important parameter in studies of accretion and evolution of AGNs. Eddington luminosities () are calculated from the black hole mass as =1.261038(). Bolometric luminosities () are calculated as 30, where a typical bolometric correction factor for luminous AGNs ( 30) is applied (Elvis et al. 1994; Risaliti & Elvis 2004; Vasudevan & Fabian 2007) and is an intrinsic luminosity in the 2 10 keV band. We note that [O III] luminosities may not be a good estimator of intrinsic luminosities as discussed in Section 4.2, although they are often used to derive bolometric luminosities (Heckman et al. 2004). The values of are in the range 10-4 2. In Figure 10, the ratios are plotted against , and we find an anti-correlation between them ( 0.54 ( 0.032) and 0.40 ( 0.033)). This correlation could indicate that buried AGNs are rapidly growing compared with AGNs surrounded by the torus with a large opening part. fscat could be an indicator of the growing phase of black holes and a useful parameter to understand the evolution of the active nucleus.
4.6. Host Galaxy
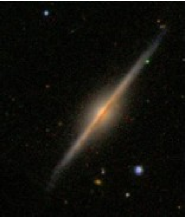
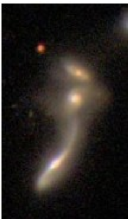
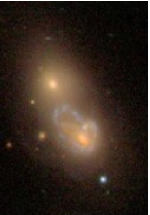
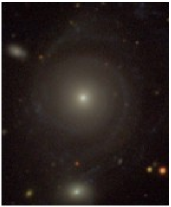
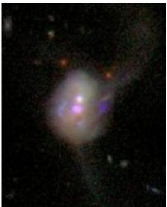
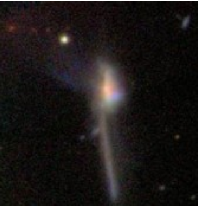
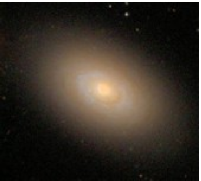
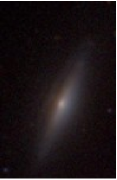
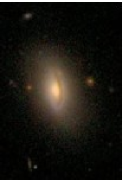
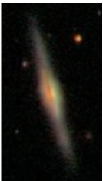
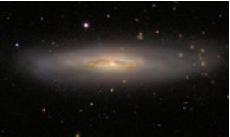
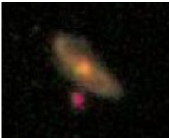
Studying properties of AGN host galaxies is of particular interest to understand a relationship between an AGN and its host. We made composite images of 12 galaxies in our sample, for which imaging data were taken at Kitt Peak (M. Koss et al. in preparation) or the SDSS data are available. An arcsinh stretch was used as described in Lupton et al. (2004) with color scaled by flux, and resulting images are shown in Figure 11.
The morphology of the galaxies spans a wide range including early-type, spiral, and strongly interacting galaxies. The inclination of the spiral hosts also ranges from edge-on to near face-on. Winter et al. (2009) studied host galaxies of Swift/BAT-selected AGNs and argued that AGNs with small absorption tend to be near face-on, while highly absorbed AGNs are found regardless of the inclination. The absorption columns for our sample are large ( cm-2), and the observed wide variety of the inclination angles of the hosts is in agreement with the results obtained by Winter et al. (2009). The three objects with the lowest values of (IC 2461, ESO 506G027, and MCG+08) are edge-on spirals, while Mrk 348, which has similarly small , resides in nearly face-on spiral. Thus, the relation between the inclination angle of the host and is not clear.
Four among 12 objects show clear signature of galaxy interaction (Mrk 176, NGC 1142, Mrk 463, and Mrk 273). 2MASS J10335255+0044033 is also possibly interacting. Three objects (Mrk 176, Mrk 463, and Mrk 273) show intermediate to large values of the scattering fractions, while for NGC 1142 is 0.8%. The hosts of objects with small (%) are spirals without signature of interaction (IC 2461, Mrk 348, ESO 506G027, and MCG+08; note that signatures of a double nucleus Mrk 348 were found in higher resolution () images by Gorjian (1995)). Through interactions of galaxies, gas inside galaxies could be transported to the central region. Such gas is a candidate for the source of obscuring matter around AGNs. Our findings, however, suggest that geometrically thick obscuring matter is not directly related to galaxy interaction.
Galaxy interaction also leads to active star formation in the galaxies, and we expect intense soft X-rays from such starburst activity. Therefore, we should note that could be overestimated in such systems. Among the objects showing interaction, Mrk 463 and Mrk 273 are ULIRGs, and significant starburst activity is likely to be taking place. The comparison between and in Section 4.1 shows that the soft X-ray emission in Mrk 273 is indeed dominated by starburst. The differences between and for the other objects (Mrk 176, NGC 1142, and Mrk 463) are not very large, and the contribution of starburst to the soft X-rays does not alter the above discussion.
5. Conclusions
We derived a new sample of obscured AGNs from the Catalogue paying attention to the strength of the scattered emission. Our sample covers a wide range of scattering fractions, which is a fraction of scattered emission with respect to direct emission and reflects the opening angle of the obscuring torus, and allows us to investigate relations between geometrical structure around a nucleus (the opening angle of the torus) and multiwavelengh properties of AGNs. To calculate the scattering fractions quantitatively, we analyzed X-ray spectra obtained with XMM-Newton and found that our sample covers the range 0.1%10%. Optical spectra of five objects were also analyzed.
We investigated multiwavelength properties for our sample, and found the followings.
-
•
There is no significant correlation between a scattering fraction and a far-infrared luminosity, though the absence of a correlation may be partly due to selection biases. This result implies that the energy generated by nuclear starburst activity is not a major source of energy supply to maintain the torus-like shape of obscuring matter around the nucleus. There is no significant correlation between an infrared color / and a scattering fraction.
-
•
We found that the ratios of extinction-corrected [O III]5007 to intrinsic 210 keV luminosities for objects with a small scattering fraction tend to be smaller than those with a large scattering fraction. This result is in accordance with our prediction that objects with a small opening angle (or a small scattering fraction) also have a small amount of narrow line region gas. Surveys using optical emission lines could be biased against buried AGNs.
-
•
We compared black hole masses and Eddington ratios with scattering fractions. The comparison with black hole masses showed that there is only a hint of very weak correlation. The Eddington ratio of buried AGNs tends to be larger for objects with a small scattering fraction. The scattering fraction could be a useful parameter to study growth and evolution of supermassive black holes.
-
•
We examined optical images of 12 galaxies in our sample. No clear relationships between and the inclination angle or signatures of interaction of the hosts.
References
- (1) Akylas, A., & Georgantopoulos, I. 2009, A&A, 500, 999
- (2) Anders, E., & Grevesse, N. 1989, Geochim. Cosmochim. Acta, 53, 197
- (3) Antonucci, R. 1993, ARA&A, 31, 473
- (4) Awaki, H., Murakami, H., Ogawa, Y., & Leighly, K. M. 2006, ApJ, 645, 928
- (5) Balestra, I., Boller, T., Gallo, L., Lutz, D., & Hess, S. 2005, A&A, 442, 469
- (6) Bassani, L., et al. 1999, ApJS, 121, 473
- (7) Bianchi, S., Chiaberge, M., Piconcelli, E., Guainazzi, M., & Matt, G. 2008, MNRAS, 386, 105
- (8) Bianchi, S., & Guainazzi, M. 2007, in AIP Conf. Ser. 924, The Multicolored Landscape of Compact Objects and Their Explosive Origins, ed. T. di Salvo et al. (New York: AIP), 822
- (9) Cid Fernandes, R., Gu, Q., Melnick, J., Terlevich, E., Terlevich, R., Kunth, D., Rodrigues Lacerda, R., & Joguet, B. 2004, MNRAS, 355, 273
- (10) Comastri, A., Setti, G., Zamorani, G., & Hasinger, G. 1995, A&A, 296, 1
- (11) Costero, R., & Osterbrock, D. E. 1977, ApJ, 211, 675
- (12) de Grijp, M. H. K., Keel, W. C., Miley, G. K., Goudfrooij, P., & Lub, J. 1992, A&AS, 96, 389
- (13) Dong, X., Zhou, H., Wang, T., Wang, J., Li, C., & Zhou, Y. 2005, ApJ, 620, 629
- (14) Eguchi, S., Ueda, Y., Terashima, Y., Mushotzky, R., & Tueller, J. 2009, ApJ, 696, 1657
- (15) Elvis, M., et al. 1994, ApJS, 95, 1
- (16) Fabian, A. C., Barcons, X., Almaini, O., & Iwasawa, K. 1998, MNRAS, 297, L11
- (17) Garcia-Rissmann, A., Vega, L. R., Asari, N. V., Cid Fernandes, R., Schmitt, H., González Delgado, R. M., & Storchi-Bergmann, T. 2005, MNRAS, 359, 765
- (18) Gilli, R., Comastri, A., & Hasinger, G. 2007, A&A, 463, 79
- (19) Gorjian, V. 1995, ApJ, 450, L51
- (20) Granato, G. L., & Danese, L. 1994, MNRAS, 268, 235
- (21) Guainazzi, M., & Bianchi, S. 2007, MNRAS, 374, 1290
- (22) Guainazzi, M., Matt, G., & Perola, G. C. 2005b, A&A, 444, 119
- (23) Guainazzi, M., Risaliti, G., Nucita, A., Wang, J., Bianchi, S., Soria, R., Zezas, A. 2009, A&A, 505, 589
- (24) Hardcastle, M. J., Evans, D. A., & Croston, J. H. 2006, MNRAS, 370, 1893
- (25) Heckman, T. M., Kauffmann, G., Brinchmann, J., Charlot, S., Tremonti, C., & White, S. D. M. 2004, ApJ, 613, 109
- (26) Heisler, C. A., Lumsden, S. L., & Bailey, J. A. 1997, Nature, 385, 700
- (27) Helou, G., Soifer, B. T., & Rowan-Robinson, M. 1985, ApJ, 298, L7
- (28) Ho, L. C., Filippenko, A. V., & Sargent, W. L. W. 1997, ApJS, 112, 315
- (29) Hopkins, P. F., Hernquist, L., Cox, T. J., Di Matteo, T., Robertson, B., & Springel, V. 2006, ApJS, 163, 1
- (30) Hopkins, P. F., Hernquist, L., Cox, T. J., & Kereš, D. 2008, ApJS, 175, 356
- (31) Imanishi, M. 2002, ApJ, 569, 44
- (32) Imanishi, M. 2003, ApJ, 599, 918
- (33) Imanishi, M., Dudley, C. C., Maiolino, R., Maloney, P. R., Nakagawa, T., & Risaliti, G. 2007, ApJS, 171, 72
- (34) Kaastra, J. S. 1992, An X-Ray Spectral Code for Optically Thin Plasmas (Internal SRON-Leiden Report, updated version 2.0)
- (35) Kalberla, P. M. W., Burton, W. B., Hartmann, D., Arnal, E. M., Bajaja, E., Morras, R., & Pöppel, W. G. L. 2005, A&A, 440, 775
- (36) Kauffmann, G., et al. 2003, MNRAS, 346, 1055
- (37) Lamastra, A., Perola, G. C., & Matt, G. 2006, A&A, 449, 551
- (38) Landi, R., et al. 2007, ApJ, 669, 109
- (39) Liedahl, D. A., Osterheld, A. L., & Goldstein, W. H. 1995, ApJ, 438, L115
- (40) Lupton, R., Blanton, M. R., Fekete, G., Hogg, D. W., O′Mullane, W., Szalay, A., & Wherry, N. 2004, PASP, 116, 133
- (41) Magorrian, J., et al. 1998, AJ, 115, 2285
- (42) Marconi, A., & Hunt, L. K. 2003, ApJ, 589, L21
- (43) Matt, G., Perola, G. C., & Piro, L. 1991, A&A, 247, 25
- (44) McElroy, D. B. 1995, ApJS, 100, 105
- (45) Mulchaey, J. S., et al. 1994, ApJ, 436, 586
- (46) Mewe, R., Gronenschild, E. H. B. M., & van den Oord, G. H. J. 1985, A&AS, 62, 197
- (47) Nelson, C. H., & Whittle, M. 1995, ApJS, 99, 67
- (48) Nenkova, M., Sirocky, M. M., Nikutta, R., Ivezić, Ž., & Elitzur, M. 2008, ApJ, 685, 160
- (49) Noguchi, K., Terashima, Y., & Awaki, H. 2009, ApJ, 705, 454
- (50) Pier, E. A., & Krolik, J. H. 1992, ApJ, 401, 99
- (51) Pier, E. A., & Krolik, J. H. 1993, ApJ, 418, 673
- (52) Polletta, M., Bassani, L., Malaguti, G., Palumbo, G. G. C., & Caroli, E. 1996, ApJS, 106, 399
- (53) Ranalli, P., Comastri, A., & Setti, G. 2003, A&A, 399, 39
- (54) Risaliti, G., Gilli, R., Maiolino, R., & Salvati, M. 2000, A&A, 357, 13
- (55) Risaliti, G., & Elvis, M., 2004, in Supermassive Black Holes in the Distant Universe, ed. A. J. Barger (Dordrecht: Kluwer), 187
- (56) Risaliti, G., Elvis, M., Fabbiano, G., Baldi, A., & Zezas, A. 2005, ApJ, 623, L93
- (57) Rodriguez-Ardila, A., & Viegas, S. M. 2003, MNRAS, 340, L33
- (58) Sanders, D. B., & Mirabel, I. F. 1996, ARA&A, 34, 749
- (59) Schurch, N. J., Roberts, T. P., & Warwick, R. S. 2002, MNRAS, 335, 241
- (60) Shu, X. W., Wang, J. X., Jiang, P., Fan, L. L., & Wang, T. G. 2007, ApJ, 657, 167
- (61) Smith, D. A., & Done, C. 1996, MNRAS, 280, 355
- (62) Teng, S. H., et al. 2009, ApJ, 691, 261
- (63) Tremaine, S., et al. 2002, ApJ, 574, 740
- (64) Turner, T. J., George, I. M., Nandra, K., & Mushotzky, R. F. 1997, ApJS, 113, 23
- (65) Ueda, Y., Akiyama, M., Ohta, K., & Miyaji, T. 2003, ApJ, 598, 886
- (66) Ueda, Y., et al. 2007, ApJ, 664, L79
- (67) Vasudevan, R. V., & Fabian, A. C. 2007, MNRAS, 381, 1235
- (68) Veron-Cetty, M. P., & Veron, P. 2006, A&A, 455, 773
- (69) Wada, K., & Norman, C. A. 2002, ApJ, 566, L21
- (70) Wada, K., & Norman, C. A. 2007, ApJ, 660, 276
- (71) Watson, M. G., et al. 2009, A&A, 493, 339
- (72) Winter, L. M., Mushotzky, R. F., Tueller, J., & Markwardt, C. 2008, ApJ, 674, 686
- (73) Winter, L. M., Mushotzky, R. F., Reynolds, C. S., & Tueller, J. 2009, ApJ, 690, 1322
- (74) Yee, H. K. C., & Oke, J. B. 1978, ApJ, 226, 753