On the meaning of the -index
Abstract
The -index — the value for which an individual has published at least papers with at least citations — has become a popular metric to assess the citation impact of scientists. As already noted in the original work of Hirsch and as evidenced from data of a representative sample of physicists, scales as , where is the total number citations to an individual. Thus appears to be equivalent to the index. As a further check of this equivalence, the distribution of the ratio for this sample is sharply peaked about 1. The outliers in this distribution reveal fundamentally different types of individual publication records.
pacs:
02.50.Ey, 05.40.-a, 05.50.+q, 89.65.-sWhat is the best way to assess the influence of scientific publications of individual scientists? Traditionally, this assessment has been based on the number of publications of a scientist or the total number of citations received. However, in any creative endeavor, such as physics research, the total amount of output is not necessarily the right metric for productivity. In fact, L. D. Landau himselfLL kept a list of physicists that were ranked on a logarithmic scale of achievement.
Recently, Hirsch H introduced the -index that attempts to capture the overall impact of an individual’s publication record researcher by a single number. The total number of publications can be misleading because an individual could simply publish a large number of worthless articles. Conversely, the total number of citations could also be misleading because an individual might publish a single highly-cited article in a hot but transient subfield but then nothing else of scientific value. Such a citation record may not be valuable as that of someone who steadily authors good publications that are reasonably cited.
The idea underlying the -index is that an equitable integral measure of citation impact is provided by the value , such that an individual has published at least papers with at least citations. It is obvious that the -index of a prolific author of trivial publications and that of a researcher with a single great publication will be much less than someone who publishes good papers at a steady rate. Because of its obvious appeal, the -index has become a universally-used metric of overall citation impact. As one example of the prominence of the -index, it is immediately quoted in Web of Science citation reports ISI . Moreover, the original idea of the -index has spawned various of efforts to make the -index more “fair” fair by correcting for some of the obvious biases that are part of the citation record, such as many co-authors, self-citations, role of thesis advisor, etc.
However, as noted by Hirsch in his original publication H , the -index of an individual should scale as the square-root of the total number citations to this individual. This square-root scaling arises in the most simple model of citations in which an individual publishes papers at a constant rate and each publication is cited at a constant rate. As a result, the total number of citations grows quadratically with time while the -index grows linearly with time, i.e. scales linearly with . Here, we test this observation for a representative sample of 255 condensed-matter and statistical physics theorists in North America and Europe.
The data was obtained by starting with the names of well-known condensed-matter and statistical physics theorists and looking up their citation record in the ISI Web of Science. By scanning at the author lists of the top-cited publications of these initial authors, the initial list of authors was extended to their main collaborators, and then to collaborators of collaborators, etc. After about 250 people, it became difficult to find new people or people who could be unambiguously resolved in the ISI database with the limited knowledge of the author. Primarily because of limited personal knowledge, the dataset also under-represents junior people. Moreover, because the Boston University institutional subscription for ISI extends only to citations after 1973, individuals who began publishing before this year were excluded to avoid the use of incomplete citation data for their publications. The data were gathered during a two-day period January 30–31, 2010 between updates of the science citation index database.
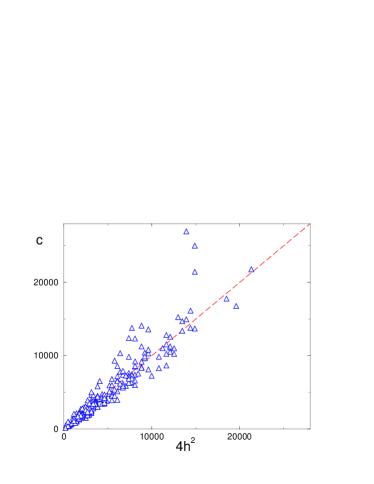
If scales linearly with , then a plot of these two quantities should yield a straight line. Fig. 1 illustrates this behavior for all the individuals in the dataset. To highlight the outliers to the linear behavior that will be discussed below, Fig. 1 actually shows versus . A linear least-squares fit to all the data of versus gives a best fit value of the slope of . The data therefore suggest that is essentially equivalent to the -index, up to an overall factor that is close to 2.
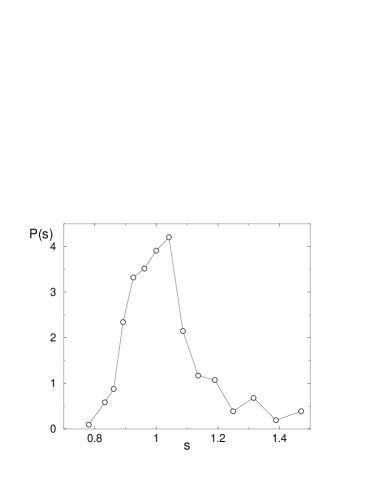
As a further test of the linearity of the dependence of versus , the quantity is computed for each individual in the dataset of 255 physicists and the resulting distribution, , is shown in Fig. 2. This distribution is fairly symmetric and most of the data lies within the range . The tightness of the range of again suggests that the relation accounts for most of the citation data.
The outliers in the distribution with and with are particularly interesting. In the scatter plot of versus in Fig. 1, consider first the outliers with — data points that lie below the diagonal. As illustrated in table LABEL:S, the citation patterns of best-cited publications for the individuals with the smallest ten values of are remarkably similar even though the indices of this group of researches ranges over a factor of more than two. In particular, the difference in the number of citations of successive top-cited papers is relatively small in all cases. For example, the ratio of the number of citations to the top-cited and third-cited paper for each individual is in the range 1.025–2.072.
For the twenty individuals with the largest values of , the citations patterns are also quite similar within this subpopulation. Almost all have one (or a few) papers whose citations are a substantial factor larger than their second-ranked paper. For example, the largest ratio between the number of citations of the top-cited and third-cited paper is now 10.03. This wide disparity arises because each individual in this subpopulation (co)-authored one (or a few) famous publications whose citation frequency outstrips the remaining publications. Among the individuals that (co)-author these famous publications, there are three clearly-defined situations: (i) individuals that wrote a ground-breaking publication on their own or were the driver of publication with a junior co-author, (ii) those that collaborated with a more senior author in a famous publication, and (iii) those whose famous publication was a particularly timely or authoritative review article.
| 25 | 1510 | 0.777 | 84 | 81 | 62 | 48 | 46 | 43 | 42 | 39 | 37 | 36 | |
| 39 | 3983 | 0.809 | 260 | 177 | 144 | 127 | 126 | 92 | 91 | 90 | 89 | 85 | |
| 18 | 853 | 0.811 | 172 | 153 | 83 | 72 | 49 | 39 | 36 | 35 | 33 | 23 | |
| 27 | 1966 | 0.821 | 197 | 191 | 139 | 110 | 66 | 66 | 52 | 51 | 48 | 44 | |
| 26 | 1854 | 0.828 | 83 | 81 | 81 | 72 | 70 | 68 | 63 | 56 | 55 | 52 | |
| 28 | 2169 | 0.832 | 100 | 95 | 92 | 89 | 83 | 75 | 73 | 67 | 64 | 64 | |
| 19 | 1002 | 0.833 | 68 | 66 | 64 | 56 | 51 | 51 | 50 | 43 | 42 | 39 | |
| 26 | 1879 | 0.833 | 148 | 141 | 84 | 76 | 75 | 65 | 64 | 62 | 56 | 54 | |
| 23 | 1480 | 0.836 | 94 | 64 | 64 | 62 | 58 | 51 | 49 | 47 | 46 | 42 | |
| 54 | 8209 | 0.839 | 316 | 297 | 285 | 199 | 198 | 198 | 181 | 177 | 162 | 153 |
| 8 | 544 | 1.458 | 141 | 135 | 50 | 34 | 31 | 17 | 13 | 13 | 8 | 8 | |
| 11 | 1011 | 1.445 | 329 | 220 | 105 | 75 | 73 | 37 | 28 | 24 | 24 | 17 | |
| 20 | 3163 | 1.406 | 480 | 303 | 276 | 264 | 257 | 212 | 198 | 191 | 165 | 157 | |
| 59 | 26937 | 1.391 | 2259 | 1830 | 1310 | 1220 | 784 | 777 | 606 | 355 | 54 | 312 | |
| 44 | 13789 | 1.334 | 1824 | 1469 | 1393 | 1042 | 570 | 560 | 504 | 480 | 327 | 316 | |
| 17 | 2058 | 1.334 | 550 | 255 | 197 | 194 | 123 | 97 | 81 | 73 | 70 | 70 | |
| 27 | 4903 | 1.297 | 2004 | 371 | 316 | 243 | 157 | 133 | 114 | 100 | 98 | 97 | |
| 61 | 25003 | 1.296 | 4461 | 3778 | 1444 | 1333 | 1176 | 1104 | 1101 | 835 | 651 | 400 | |
| 43 | 12403 | 1.295 | 4148 | 1561 | 551 | 495 | 452 | 405 | 399 | 339 | 217 | 214 | |
| 40 | 10347 | 1.271 | 2118 | 2004 | 857 | 433 | 292 | 281 | 274 | 238 | 223 | 221 | |
| 38 | 9331 | 1.271 | 2721 | 828 | 530 | 472 | 466 | 451 | 324 | 271 | 205 | 178 | |
| 32 | 6537 | 1.263 | 1105 | 735 | 650 | 525 | 516 | 320 | 174 | 154 | 151 | 138 | |
| 47 | 14090 | 1.263 | 3232 | 815 | 699 | 620 | 477 | 466 | 420 | 353 | 329 | 274 | |
| 45 | 12347 | 1.235 | 2357 | 765 | 641 | 563 | 495 | 462 | 405 | 377 | 350 | 322 | |
| 28 | 4660 | 1.219 | 2260 | 274 | 206 | 140 | 116 | 86 | 84 | 83 | 81 | 79 | |
| 19 | 2137 | 1.271 | 766 | 301 | 182 | 77 | 74 | 71 | 61 | 58 | 43 | 41 | |
| 61 | 21446 | 1.200 | 7014 | 1102 | 699 | 626 | 502 | 427 | 331 | 325 | 304 | 296 | |
| 15 | 1274 | 1.190 | 242 | 232 | 140 | 96 | 66 | 57 | 48 | 41 | 34 | 33 | |
| 49 | 13582 | 1.189 | 3051 | 985 | 883 | 864 | 698 | 374 | 349 | 349 | 302 | 241 | |
| 22 | 2732 | 1.188 | 569 | 343 | 271 | 192 | 165 | 98 | 96 | 90 | 72 | 63 | |
| 39 | 8584 | 1.188 | 2260 | 980 | 658 | 451 | 296 | 289 | 269 | 149 | 147 | 144 | |
| 22 | 2699 | 1.181 | 507 | 340 | 192 | 184 | 145 | 130 | 121 | 93 | 92 | 90 |
One basic conclusion from this study is that the square-root of the total number of citations that an individual receives very nearly coincides with twice his or her -index. A still an open question is why should provide the same integrated measure of the breadth and depth of an individual’s citation record as the -index itself.
A second conclusion is that it is possible to identify outstanding researchers as the outliers above the diagonal in the scatter plot of Fig. 1. While there are roughly the same number of points below the diagonal as above the diagonal, the above-diagonal points with roughly 9000 citations or greater are visually prominent and correspond to individuals with seminal publications. This simple characteristic appears to provide a useful predictor of research excellence.
A final caveat: while the outliers discussed here correspond to researchers with excellent publications to their credit, there are many examples of excellent researchers that do not fit this outlier criterion. It is important to be aware of the limitations of using citations alone, or some function of the number of citations, as a measure of research excellence.
Acknowledgements.
I gratefully acknowledge financial support from the US National Science Foundation grant DMR0906504. I also thank S. Dorogovtsev for initial correspondence that kindled my old interest in this subject and J. E. Hirsch for friendly correspondences and advice.References
- (1) J. E. Hirsch, Proc. Nat. Acad. Sci. USA 46, 16569 (2005).
- (2) See http://en.wikipedia.org/wiki/LevLandau.
- (3) http://apps.isiknowledge.com/
- (4) See e.g., L. Egghe, Scientometrics 69, 131 (2006); A. F. J. Van Raan, Scientometrics 67, 491 (2006); J. E. Hirsch, arXiv:0911.3144 [physics.soc-ph].