Networks of motifs from sequences of symbols
Abstract
We introduce a method to convert an ensemble of sequences of symbols into a weighted directed network whose nodes are motifs, while the directed links and their weights are defined from statistically significant co-occurences of two motifs in the same sequence. The analysis of communities of networks of motifs is shown to be able to correlate sequences with functions in the human proteome database, to detect hot topics from online social dialogs, to characterize trajectories of dynamical systems, and might find other useful applications to process large amount of data in various fields.
pacs:
89.75.Fb, 89.75.Hc, 87.18.CfThere are many examples in biology, in linguistics and in the theory of dynamical systems, where information resides and has to be extracted from corpora of raw data consisting in sequences of symbols. For instance, a written text in English or in another language is a collection of sentences, each sentence being a sequence of the letters from a given alphabet. Not all sequences of letters are possible, since the sentences are organized on a lexicon of a certain number of words. In addition to this, different words are used together in a structured and conventional way S (1, 3). Similarly, in biology, DNA nucleotides or aminoacid sequence data can be seen as corpora of strings searls ; S (4); peng ; scafetta . For example, it is well known that proteomes are far from being a random assembly of peptides, since clustering of aminoacids rosato and strong correlations among proteomic segments bussemaker have been clearly demonstrated. These results give meaning to the metaphor of protein sequences regarded as texts written in a still unknown language searls ; solan . Sequences of symbols can also be found in time series generated by dynamical systems. In fact, a trajectory in the phase space can be transformed into sequence of symbols, by the so-called “symbolic dynamic” approach beck . The basic idea is to partition phase space into a finite number of regions, each of which is labelled with a different symbol. In this way, each initial condition gives rise to a sequence of symbols representing the initial cell, the cell occupied at the first iterate, the cell occupied at the second iterate, and so forth.
In all the examples mentioned above, the main challenge is to decipher the message contained in the corpora of data sequences, and to infer the underlying rules that govern their production. In order to do this, one needs: i) to detect the fundamental units carrying information, like words do in language, and ii) to study their combination syntax in the ensemble of sequences. In fact, information in its general meaning is located not only at the level of strings, but also in their correlation patterns lacasa ; tadic . In this Letter, we introduce a method to transform a generic corpus of strings, such as written texts, protein sequence data, sheet music, a collection of dance movement sequences bradley10 , into a network representing the significant and fundamental units of the original message together with their relationships. The method relies on a statistical procedure to detect patterns carrying relevant information, and works as follows. We first construct a dictionary of the recurrent strings of letters, called -motifs. Recurrent strings play, in this more general context, the same role as words in written or spoken languages. We then construct a -motif network, a graph in which each node is one entry of the dictionary, and a directed arc between two nodes is drawn when the ordered co-occurence of the two motifs is statistically significant in the dataset analyzed. We will show how the analysis of topological properties of networks of -motifs, such as the detection of community structures bocca ; fortunato , allows to extract important information encoded in the original data. In particular, we will consider the application of the method to datasets in three different domains, namely, biological sequences of proteins, messages from online social networks, and sequences of symbols generated by the trajectories of a dynamical system.
Let us consider an ensemble of sequences of symbols. Each sequence () is a string of letters from an alphabet of letters, . In general, the strings can have different lengths. We indicate by the length of sequence , and by the total length of the ensemble. An example is provided by proteomes. A proteome is a collection of proteins of a species. Each protein is a sequence of length , ranging from to , made of symbols from an alphabet with letters, , where each labels one of the aminoacids a protein can be made of. We define as -string a segment of contiguous letters , where . The number of all possible -strings is , while from the ensemble of sequences we can select only overlapping -strings, so that some of the possible -strings do not occurr, some of them occur once, others more than once, either in the same or in different sequences of symbols. We define as:
| (1) |
the observed probability of a string . This probability is obtained by counting the total number of times, , the string actually occurs in the sequences of the ensemble. To assess for the statistical significance of the string, the probability in Eq. 1 has to be compared with the expected probability of the string occurrence. The latter can be evaluated under different assumptions. In fact, the joint probability can be written as:
and different approximations for the conditional probabilities lead to different values of the expected probability . Namely, if we assume that the occurrence of a letter does not depend on any of the previous letters, i.e. , the expected probability is simply given by the product of the relative frequencies of the string’s component letters: ferraro ; S (7). By using instead a first order Markov approximation, i.e. , the expected probability can be expressed in the form: , where is extracted from the countings as: . This latter assumption is based on the fact that there is a minimal amount of memory in the sequence: a symbol of the sequence is correlated to the previous one only. Here, we go beyond the approximation of Markov chains of order 1, by retaining as much memory as possible S (4). We assume:
| (2) |
where the conditional probabilities can be evaluated from countings as:
| (3) |
or can be expressed in terms of the observed probability for shorter sequences as:
| (4) |
By using the latter expression, we can finally write the expected probabilities in a more compact form:
| (5) | |||||
This way, the expected probability of a given -string is evaluated based on observations for strings of up to symbols. Therefore, by predicting the probability of appearance with a high order Markov model, our method allows to highlight the true -body correlations subtracting from them the effects due to and lower order correlations. Based on observed and expected probabilities, a test of statistical significance, for instance a -score, is then performed for each -string. We define -motifs or recurrent -strings, the statistically-relevant strings whose observed and expected number of occurrences are such as to validate the statistical test adopted, and we indicate as the dictionary composed by all the selected -motifs urialon .
Once we have constructed a lexicon of fundamental units, the next goal is to represent in a graph the way they are combined together. Recurrent -strings can be distributed differently along the sequences: they can appear in single sequence or in more than one sequence, alone or in clusters. To extract the non trivial patterns of correlated appearance of -motifs, we need to evaluate the probability for the random co-occurrence of two motifs, when these are uncorrelated. We estimate first the expected probability that motif is followed by motif within a generic sequence of the ensemble , then we sum over all the sequences of . We denote as and the probabilities of finding the two motifs in . In sequence , motif can occupy positions ranging from the first to the th site, where is the length of , and is the length of the motif. We have assumed that the two motifs cannot overlap. For each fixed position of on , with , there are possibilities for to appear in the sequence. Hence, the number of expected co-occurences of and within is given by: . In order to obtain the expected number of co-occurrences, we have to sum over all the sequence in the ensemble . We finally get:
| (6) |
For each value of , we are now able to construct the -motif network of the ensemble , i.e. a directed network whose nodes are motifs in the dictionary , and an arc point from node to node if the number of times follows in the ensemble of sequences is statistically significant. Furthermore, a weight can be associated to the arc from to , based on the extent to which the co-occurrence of the two motifs deviates from expectation.
This approach is able to represent the correlation patterns encrypted in the ensemble of sequences into a single object, the -motif network. Then, graph theory allows to extract information from the structural properties of the network, and to retrieve the main message encoded in the original sequences. In particular, it is interesting to study the components of the -motif network or, if the graph is connected, its community structures, i.e. those groups of nodes tightly connected among themselves and weakly linked to the rest of the graph fortunato .
In the following, we will consider the application of the method to three different datasets, belonging to three contexts as diverse as biology, social dialogs and dynamical systems. We will show how the community analysis of the related -motif networks enables to extract functional domains in proteomes, social cascades and hot topics in Twitter, and the increase of chaoticity in deterministic maps.
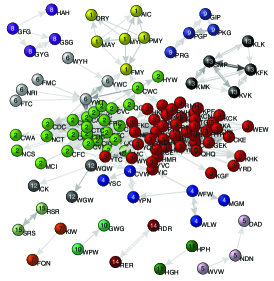
In the biological context, many methods based on strings deviating from expectancy in genome S (4, 5) or in a proteome S (6) have been already used to make functional deductions. Although they provide insight on many biological mechanisms S (7), this approach turns out to be not sufficient for a complete and exhaustive interpretation of the genomic and proteomic message. A fundamental key to its comprehension is in fact hidden in the correlations among recurrent patterns of strings, which are perfectly represented at a global scale in terms of -motif networks. Various features of these correlations translate into structural properties of -motif networks. In Fig. 1 we illustrate, as an example, the 3-motif graph derived from the ensemble of human proteins (see supplementary for details about the dataset). We have detected 15 different communities in the graph, labeled in the figure with different colours and numbers. By means of a research in biological databases, we can show that linked couples of motifs belonging to the same community all co-occur in the same kind of protein domains and that one can associate 9 of these 15 communities just to one domain (see table I in supplementary ). These results are outstanding compared to the current methods to extract functional protein domains, all based on multi-alignment of sequences, and cannot obtained if one uses a lower order Markov model, meaning that it is fundamental to take into account both short- and long-range correlations (for more details on the -motif networks in proteomes, see supplementary ).
| motif | motif | Expression or Tweet | Topic | |
| 1 | 2 | |||
| 9cle | gg27 | 955.3 | GUARDIAN ICM POLL Cameron 35% Brown 29% Clegg 27% | poll results from various websites, journals, tv channels, etc |
| 5bro | wn29 | 894.8 | ||
| son4 | 4cle | 924.3 | Brown wins on 44%, Clegg is second on 42%, Cameron 13% None of them 1% | |
| don4 | 2cam | 881.7 | ||
| lapo | mete | 892.3 | www.slapometer.com | A funny website on the election |
| swed | nesd | 864.7 | hey Dave, Gordon and Nick : how about a 4th debate on Channel 4 this wednesday night without the rules?! | Proposal for a 4th debate among leaders, made by a journalist on his twitter page |
| nesd | ayni | 826.1 | ||
| jami | ncoh | 842.0 | Benjamin Cohen | Journalist of Channel 4 News |
| minc | ohen | 764.9 | ||
| isob | eymu | 831.4 | #disobeymurdoch | hashtag |
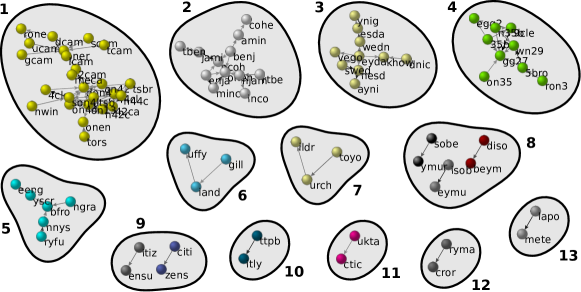
Important information from -motif networks can also be retrieved from datasets of social dialogs and microblogging websites, like Twitter. Although in these cases, in principle, a dictionary is a-priori known, not all terms used in the Internet language are always listed in the dictionary mitrovic : abbreviations, “leet language” words, names of websites or of public personages, are just some examples. Moreover, some expressions or combinations of terms appear more frequently in some periods or contexts due to the interest in some hot topics. We have found that communities of -motif networks derived from microblogging sequences in Twitter during the UK Election in April 2010 are able to detect exactly those hot topics which generate information cascades S (15), as shown in Fig.1 and Table II of supplementary . In Table 3 we report the links with the highest significance together with the tweet associated to their community. Each tweet was the origin of a cascade and can be associated with a specific topic or event discussed during the election campaign (see supplementary for details).
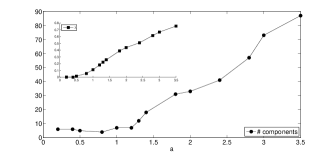
Finally, -motif networks carry important information on sequences of symbols generated from trajectories of dynamical systems by the so-called “symbolic dynamic” approach beck . One is able, for instance, to distinguish ensembles of sequences generated by deterministic maps from those generated by stochastic processes, by looking at the number of components and communities in the -motif network. In fact, the method, when applied to sequences generated by deterministic equations that are increasingly non-linear, still finds short motifs, while the same does not occur for ensembles of random sequences. Furthermore, we have found that the higher is the non-linearity in a conservative deterministic dynamical system, the more disconnected is the corresponding -motif network. In Fig. 2, we show an example of this behaviour for a well-known two-dimensional area-preserving deterministic map, the standard map S (22). Each point in Fig. 2 represents the number of components in the -motif network obtained from an ensemble of trajectories produced for a specific value of the non-linearity parameter . We observe that the number of components increases with , and this behavior is similar to that of the positive Lyapunov exponent of the map, shown in the inset (see also supplementary ).
Summing up, in this Letter we have introduced a general method to construct networks out of any symbolic sequential data. The method is based on two different steps: first it extracts in a “natural” way motifs, i.e. those recurrent short strings which play the same role words do in language; then it represents correlations of motifs within sequences as a network. Important information from the original data are embedded in such a network and can be easily retrieved as shown with different applications (a biological system, a social dialog and a dynamical system). With respect to previous linguistic methods, our approach does not need the a priori knowledge of a given dictionary, and also allows to compare different ensembles, corresponding, for example, to different values of control parameters in dynamical systems. All this makes the method very general and opens up a wide range of applications from the study of written text, to the analysis of sheet music or sequences of dance movements. Moreover, the method does not use parameters on the position of motifs in order to correlate them, since co-occurrences are computed within sequences, which represent natural interruptions of a corpora of data (proteins in a proteome, posts in a blog, different initial conditions in a symbolic dynamics, etc.).
Acknowledgements.
We thank A. Giansanti and V. Rosato for stimulating discussions on the biological applications of the method, S. Scellato for providing us with the Twitter dataset, and M. De Domenico for his interesting comments on applications to dynamical systems. This work was partially supported by the Italian To61 INFN project.References
- (1) R. Ferrer i Cancho, R.V. Solé and R. Köhler, Phys. Rev. E 69, 051915(R) (2004); R. Ferrer i Cancho and R.V. Solé, Proc. R. Soc. Lond. B 268, 2261 (2001).
- (2) A. Motter, A.P.S. De Moura, Y.C. Lai, and P. Dasgupta, Phys. Rev. E, 65, 065102 (2002); E.G. Altmann, J. B. Pierrehumbert and A.E. Motter, PLoS One 4:e7678 (2009).
- (3) D. B. Searls, Nature 420, 211 (2002).
- (4) V. Brendel, J.S. Beckmann, and E.N. Trifonov, Journal of Biomolecular Structure & Dynamics 4, 011 (1986).
- (5) C.-K. Peng, S. V. Buldyrev, A. L. Goldberger, S. Havlin, F. Sciortino, M. Simons, H. E. Stanley, Nature 356, 168 (1992).
- (6) N. Scafetta, V. Latora, and P. Grigolini, PRE 66, 031906 (2002).
- (7) V. Rosato, N. Pucello, and G. Giuliano, Trends in Genetics 18, 278 (2002).
- (8) H.J. Bussemaker, H. Li and E.D. Siggia, Proc. Natl. Acad. Sci. USA 97, 10096 (2000).
- (9) Z. Solan, D. Horn, E. Ruppin and S. Edelman, Proc. Natl. Acad. Sci. USA 102, 11629 (2005).
- (10) C. Beck and F. Schlögl, Thermodynamics of chaotic systems (Cambridge University Press, Cambridge, 1993).
- (11) L. Lacasa, B. Luque, F. Ballesteros, J. Luque, and J. C. Nunos, Proc. Natl. Acad. Sci. USA 105, 4972 (2008).
- (12) J. Zivkovic, M. Mitrovic and B. Tadic, Studies in Computational Intelligence, 207, Complex Networks, Eds. S. Fortunato et. al., 23-34, Springer, (2009).
- (13) E. Bradley, D. Capps, J. Luftig, and J. Stuart, Open AI Journal 4, 1-19 (2010).
- (14) S. Boccaletti, V. Latora, Y. Moreno, M. Chavez, and D.-U. Hwang, Phys. Rep. 424, 175 (2006).
- (15) S. Fortunato, Phys. Rep. 486, 75 (2010).
- (16) L. Ferraro, A. Giansanti, G. Giuliano, and V. Rosato, arXiv:q-bio/0410011v2.
- (17) A. Giansanti, M. Bocchieri, V. Rosato, and S. Musumeci, Parasitol. Res. 101, 639 (2007).
- (18) The term motif is chosen in analogy with the concept of network motifs, i.e. recurrent patterns of nodes and links in a graph. U. Alon, Nature Reviews Genetics 8, 450 (2007).
- (19) M. Caselle, F. Di Cunto, and P. Provero, BMC Bioinformatics 3, 7 (2002); D. Corà, F. Di Cunto, P. Provero, L. Silengo, and M. Caselle, BMC Bioinformatics 5, 57 (2004).
- (20) P. Nicodème, T. Doerks, and M. Vingron, Bioinformatics 18: S161, Suppl.2 (2002).
- (21) A. J. Enright, S. Van Dongen, and C. A. Ouzounis, Nucleic Acids Research 30:1575 (2002).
- (22) See supplementary material at the end of the paper for details and other results about the application of the method in the three datasets.
- (23) K. Lerman and R. Ghosh, in Proc. of ICWSM (2010).
- (24) M. Mitrovic and B. Tadic, Eur. Phys. J. B 73: 293 (2010).
- (25) B.V. Chirikov, Phys. Rep. 52:263 (1979).
Supplementary material to “Networks of motifs from sequences of symbols”
The properties of -motif networks can reveal important characteristics of the message encrypted in the original data, as the analysis of topological quantities (clustering coefficient, average path length and degree distributions) has helped to understand various linguistic features in networks of words co-occuring in sentences S (1, 2), and also to model how language has evolved in networks of conceptually-related words S (3). We present here details and further results on the application of the method described in the main article to three different datasets: proteomic sequences, short text messages acquired from Twitter, the well-known social network and microblogging platform, and ensembles of sequences derived from dynamical trajectories of the standard map by means of a symbolic dynamics approach.
I Biological sequences
Methods to study over- or under-representation of particular motifs in a complete genome S (4, 5) or in a proteome S (6), have already been proposed, and the results have been used to make functional deductions. Although the information contained in strings deviating from expectancy is useful for the analysis of many biological mechanisms S (7), it turns out to be not sufficient for a complete and exhaustive interpretation of the genomic and proteomic message. A fundamental key to its comprehension is in fact hidden in the correlations among recurrent patterns of strings. The spatial structure of proteins provides an example: when a protein folds, segments distant on the sequence come to be close to each others in the space. This can happen because two (or more) segments need to physically interact in order to perform the biological function the protein is supposed to go through. Such a mechanism translates into a statistical correlation between short motifs of aminoacids, which is well captured by an analysis in terms of -motif networks.
| # nodes | Internal | Domain | Domain | |
|---|---|---|---|---|
| weight | recognition | |||
| 1 | 6 | 83,30% | Olfactory | 171/175 |
| receptor | ||||
| 2 | 25 | 74,91% | — | |
| 3 | 43 | 94,13% | Zinc Finger | 1345/1364 |
| 4 | 6 | 55,42% | G-protein and | 9/11 |
| CUB-Sushi | ||||
| 5 | 3 | 100% | Cadherin | 330/347 |
| 6 | 4 | 100% | Lipoproteins | 16/19 |
| 7 | 2 | 100% | Homeobox | 65/84 |
| 8 | 4 | 100% | — | |
| 9 | 4 | 100% | Collagen | 271/482 |
| 10 | 2 | 100% | Serine | 22/51 |
| protease | ||||
| 11 | 2 | 100% | — | |
| 12 | 3 | 60,30% | C-type | 3/4 |
| proteins | ||||
| 13 | 5 | 100% | — | |
| 14 | 2 | 100% | — | |
| 15 | 2 | 100% | — |
Human proteome
In our application, we have considered the ensemble of sequences relative to the human proteome S (8). It consists of 34180 aminoacidic sequences of variable size, with an average length of 481 letters. For this dataset, we have computed the probabilities and for each of the possible strings of three aminoacids, and we have selected as -motifs the strings satisfying , hence creating the dictionary S (9). The entries of the dictionary are the nodes of the 3-motif network. The node is then linked to with a directed arc if the number of times that motif follows motif within the same protein is statistically significant, according to the relation: . The statistical significance is also the weight of the arc. In this way we obtain the 3-motif graph of 199 nodes and 1302 directed links, shown in Fig. 1 of the main article. The graph has 86 isolated nodes (not displayed in Figure), while the remaining 113 nodes are organized into 10 weak components. The largest component of the graph contains 5 clusters, detected by means of the MCl algorithm S (10). Therefore, 15 different communities are present in the graph. In Table 2 we report, for each community, the number of nodes and its total internal weight, defined as the sum of the weights of links between nodes of the communities normalized by the sum of the weights of links incident in nodes of the community. By submitting a query to the Prosite database S (11) we have obtained, for each couple of connected motifs belonging to the same community, the list of all proteins, classified by domain, where the two motifs co-occur. The results show that linked couples of motifs belonging to the same community, all co-occur in the same kind of domains. In addition to this, one can associate 9 of these 15 communities just to one protein domain, since the majority of co-occurrences emerge in proteins matching a well-defined function. In Table 2 we report, when possible, the association to a single protein domain, together with the ratio between the number of times the couple of motifs with the highest weight occurred in that specific domain, and the total number of co–occurrences in the database.
Analogous results were also found for the 4-motif graph S (12), while it is not possible to derive the same kind of information by using lower order Markov models to construct dictionaries. For example, the 3-motif network constructed with a dictionary based on a lower order approximation rather than on a 2-bodies Markov chain, exhibits a community structure with just four communities, none of which could be identified with a functional protein domain.
II Social networks and microblogging
By means of -motif networks, information can also be retrieved from datasets of social dialogs and microblogging websites. Although in these cases, in principle, a dictionary is a-priori known, not all terms used in the Internet language are always listed in a dictionary: abbreviations, puns, leet language words S (13), names of websites or names of public figures, are just some examples. Moreover, some expressions or combinations of terms appear more frequently in some periods or contexts due to the interest to some hot topics. In addition to this, the method of -motif networks turns to be very useful in all those contexts where it is necessary to process and compact information from large amount of symbolic data. This is the case of Internet, where the amount of text data provided by blogs, dialogs in social networks, forums, etc. is growing and growing.
In the following, we provide details on how network of motifs are able to deduce information about hot topics and cascades S (15, 16) in a dataset extracted from Twitter, a well-know platform for social networking and microblogging.
Twitter S (14) is a social networking and microblogging service which allows users to send short messages known as tweets. Tweets are composed only of text, with a strict limit of 140 characters: they are displayed on the author’s profile page and delivered to the author’s subscribers, who are also known as “followers”. The dataset we have analyzed is a collection of 28143 tweets, crawled on two days, from the 23rd to 24th April 2010, and selected through the Twitter Streaming API S (17) if they contained the string #leadersdebate. The choice of such a keyword, called in Twitter also hashtag, was aimed to select all those tweets concerning electoral campaign in UK, where general election to elect the members of the House of Commons would have taken place two weeks later. We have analyzed the dataset removing all blank spaces between words and all symbols that where not numbers or letters (punctuation, symbols like $, @, *, etc.) and not distinguishing between lower- and upper-case letters. From these sequences, dictionaries of motifs and have been extracted, selecting respectively the 10% and 1% of most significant strings of and letters. As described in the main text, we have constructed networks whose nodes represent the entries of a dictionary, and an arc is drawn from the node representing string X to the node standing for string Y, if is greater than a certain threshold. In Fig. 3, we show the -motifs network when the threshold is set equal to 400 (isolated nodes not reported). Such a high threshold is chosen to have a small network that can be easily visualized and studied. More information can be obtained by setting the threshold to lower values or analyzing networks made up of motifs of different length . Searching in the original dataset the connected motifs, it is possible to associate each component to a particular tweet which generated a cascade or with a specific expression, related to a specific hot topic discussed by users of the microblogging platform. For all components of Fig. 3, we report in Table 3 the tweet or expression associated and its meaning. For example, component 1 and 4 can be associated to two exit polls disclosed on those days by two different journals, or component 6 to the name “Gillian Duffy”, a 65-years old pensioner involved in a political scandal with British PM Gordon Brown during the election tour (Brown’s remarks of her as a “bigoted woman” were accidentally recorded and broadcast).
III Symbolic dynamics
Symbolic dynamics is a general method to transform trajectories of dynamical systems into sequences of symbols. The distinct feature in symbolic dynamics is that time is measured in discrete intervals. So at each time interval the system is in a particular state. Each state is associated with a symbol and the evolution of the system is then described by a sequence of symbols. The method turns to be very useful in all those cases where system states and time are inherently discrete. In case the time scale of the system or its states are not discrete, one has to set a coarse-grained description of the system. Different initial conditions usually generate different trajectories in the phase space, which map onto different sequences of symbols. A large number of initial conditions produces an ensemble of sequences whose analysis can be addressed with the method based on networks of motifs, as described in the main article.
In the following, we will describe the application of the method to the standard map, and we will show how the related networks of motifs shape according to its chaotic behavior.
| Comm. | Nodes | Links | Expression or Tweet | Topic |
|---|---|---|---|---|
| 1 | 25 | 33 | Brown wins on 44%, Clegg is second on 42%, Cameron 13% None of them 1% | poll results from various websites, journals, tv channels, etc |
| 2 | 12 | 14 | Benjamin Cohen | Journalist of Channel 4 News S (18) |
| 3 | 10 | 11 | hey Dave, Gordon and Nick : how about a 4th debate on Channel 4 this wednesday night without the rules?! | Proposal for a 4th debate among leaders, made by a journalist on his Twitter page |
| 4 | 9 | 13 | GUARDIAN ICM POLL Cameron 35% Brown 29% Clegg 27% | poll results from various websites, journals, tv channels, etc |
| 5 | 6 | 5 | Very funny screengrab from the LeadersDebate | About a funny picture of the leaders debate on BBC S (19) |
| 6 | 3 | 2 | Gillian Duffy | Woman branded a ’bigot’ by Gordon Brown in general election campaign S (20) |
| 7 | 6 | 5 | Cameron: I believe that if you’ve inherited hard all your life you should pass it on to your children | Electoral campaign from David Cameron |
| 8 | 6 | 3 | #disobeymurdoch | Twitter hashtag |
| 9 | 4 | 2 | #citizensuk | Twitter hashtag |
| 10 | 2 | 1 | http:// … .ly | Format of shortened weblinks in twitter |
| 11 | 2 | 1 | Tactical voting | Strategy that when a voter misrepresents his or her sincere preferences in order to gain a more favorable outcome S (21) |
| 12 | 2 | 1 | Henry Macrory | Head of press for the Conservatives, owner of a twitter account |
| 13 | 2 | 1 | www.slapometer.com | A funny website on the election |
Standard Map
The standard map, also known as Chirikov map, is a bidimensional area-preserving chaotic map. It maps a square with side onto itself S (22). It is described by the equations:
| (9) |
where represents time iteration and is a parameter assuming real values. The map is increasingly chaotic as increases (see inset of Fig. 2 in the main article to see a plot of the Lyapunov exponent as a function of the parameter ). For , the map is linear and only periodic and quasiperiodic orbits are allowed. When evolution of trajectories are plotted in the phase space (the xp plane), periodic orbits appear as closed curves, and quasiperiodic orbits as necklaces of closed curves whose centers lie in another larger closed curve. Which type of orbit is observed depends on the map’s initial conditions. When the nonlinearity of the map increases, for appropriate initial conditions it is possible to observe chaotic dynamics.
In order to obtain sequences from the standard map (9) by means of the symbolic dynamic approach S (23), one needs to make a coarse graining of the phase space, defining a discrete and finite number of possible states the trajectory can occupy. This way it is possible to associate a symbol to each of the possible states and derive a sequence according to the trajectory originating from an initial condition. We have coarse-grained the phase space into 25 () squares of equal size and we have derived for different values of the parameter , sequences of symbols. In other words, this means to follow for time steps the trajectories originating from different initial conditions.
The idea is that closed orbits or quasi periodic-ones correspond to correlations between motifs and therefore in links of the graph of motifs. When the map becomes more and more chaotic, closed orbits disappear and, correspondingly, the networks break in many components. In the extreme limit of map highly chaotic (), the network of motifs are completly disconnected, with all nodes isolated. Nevertheless, this scenario is different from the one generated by stochastic sequences, since in this case motifs would not be detected, while this still happens in the chaotic map, although only for small values of . This result is well depicted in Fig. 3 of the main article, where the number of components of the -motif graphs is plotted as a function of the value of the map generating the ensemble. This curve is shown to have the same behavior of the Lyapunov exponent, as reported in the inset of the same figure.
References
- S (1) R. Ferrer i Cancho and R.V. Solé, Proc. R. Soc. Lond. B 268, 2261 (2001).
- S (2) S.M.G. Caldeira, T.C. Petit Lobão, R.F.S. Andrade, A. Neme, and J.G.V. Miranda, Eur. Phys. J. B 49, 523 (2006).
- S (3) A. Motter, A.P.S. De Moura, Y.C. Lai, and P. Dasgupta, Phys. Rev. E, 65, 065102 (2002).
- S (4) V. Brendel, J.S. Beckmann, and E.N. Trifonov, Journal of Biomolecular Structure & Dynamics 4, 011 (1986).
- S (5) M. Caselle, F. Di Cunto, and P. Provero, BMC Bioinformatics 3, 7 (2002); D. Corà, F. Di Cunto, P. Provero, L. Silengo, and M. Caselle, BMC Bioinformatics 5, 57 (2004).
- S (6) P. Nicodème, T. Doerks, and M. Vingron, Bioinformatics 18: S161, Suppl.2 (2002).
- S (7) A. Giansanti, M. Bocchieri, V. Rosato, and S. Musumeci, Parasitol. Res. 101, 639 (2007).
- S (8) Data downloaded from the Consensus Coding Sequence database (CCDS), http://www.ncbi.nlm.nih.gov/CCDS/, version Hs35.1.
- S (9) With the notation , we denote the average of over all the possible configurations of and with the standard deviation of the distribution.
- S (10) A. J. Enright, S. Van Dongen, and C. A. Ouzounis, Nucleic Acids Research 30:1575 (2002).
- S (11) http://www.expasy.ch/prosite
- S (12) R. Sinatra, D. Condorelli, A. Giansanti, V. Latora, V. Rosato, Analysis of proteomes by means of -motif networks, in preparation.
- S (13) http://en.wikipedia.org/wiki/Leet
- S (14) www.twitter.com
- S (15) K. Lerman and R. Ghosh, in Proc. of ICWSM (2010).
- S (16) M. Cha, A. Mislove, B. Adams, K. P. Gummadi, in Proc. of WOSN 08 - USA (2008).
- S (17) http://apiwiki.twitter.com/Streaming-API-Documentation
- S (18) http://en.wikipedia.org/wiki/Benjamin_Cohen_%28journalist%29
- S (19) http://twitpic.com/1jge7b
- S (20) http://www.guardian.co.uk/politics/2010/jul/26/gillian-duffy-backs-david-miliband
- S (21) http://wiki.electorama.com/wiki/Tactical_voting
- S (22) B.V. Chirikov, Phys. Rep. 52:263 (1979).
- S (23) V.M. Aleksev and M.V. Yakobson, Phys. Rep. 75:287 (1981).