ULAS J141623.94+134836.3: a Blue T Dwarf Companion to a Blue L Dwarf
Abstract
We confirm the substellar nature of ULAS J141623.94+134836.3, a common proper motion companion to the blue L dwarf SDSS J141624.08+134826.7 identified by Burningham et al. and Scholz. Low-resolution 0.8–2.4 spectroscopy obtained with IRTF/SpeX shows strong H2O and CH4 absorption bands, consistent with a T7.5 spectral type, and we see possible indications of NH3 absorption in the 1.0–1.3 region. More importantly, the spectrum of ULAS J1416+1348 shows a broadened -band peak and highly suppressed -band flux, both indicative of high surface gravity and/or subsolar metallicity. These traits are verified through spectral model fits, from which we derive atmospheric parameters Teff = 65060 K, = 5.20.4 cgs, [M/H] -0.3 and = 104 cm2 s-1, the temperature being significantly warmer than that estimated by Burningham et al. These fits also indicate a model-dependent spectroscopic distance of 10.6 pc for ULAS J1416+1348, formally consistent with the 7.91.7 pc astrometric distance for SDSS J1416+1348 from Scholz. The common peculiarities of these two co-spatial, co-moving sources suggest that their unusual blue colors—and those of other blue L and T dwarfs in general—arise from age or metallicity, rather than cloud properties alone.
1 Introduction
Over the past 15 years, well over 500 brown dwarf members of the late-M, L and T dwarf spectral classes have been identified in various Galactic environments, encompassing a broad diversity in color, spectral properties, and physical characteristics (Kirkpatrick 2005 and references therein). Sustained effort has been made to identify the coldest of these sources, which include the low-mass extreme of star formation and primordial relics of the Galactic halo population. The most recent discoveries made with the Two Micron All Sky Survey (2MASS; Cutri et al. 2003; Skrutskie et al. 2006), the UKIRT Infrared Deep Sky Survey (UKIDSS; Lawrence et al. 2007) and the Canada France Hawaii Telescope Legacy Survey (CFHTLS; Delorme et al. 2008b) have extended the known population down to and below effective temperatures Teff 600 K (e.g., Warren et al. 2007; Burningham et al. 2008, 2009; Burgasser et al. 2008b; Delorme et al. 2008a; Leggett et al. 2009). This has raised the question as to where the currently coldest class of brown dwarfs—the T dwarfs—ends and the next cooler class—the Y dwarfs—might begin. Such exceedingly dim and cold sources are predicted to encompass several major chemical transitions in brown dwarf atmospheres, including the disappearance of Na and K into salt condensates, the emergence of strong NH3 absorption across the infrared band, and the formation of photospheric water ice clouds (e.g., Marley et al. 1999; Lodders 1999; Lodders & Fegley 2002; Burrows et al. 2003). Accordingly, there is considerable interest and controversy as to how to delineate this putative class; see discussions by Leggett et al. (2007); Burningham et al. (2008) and Delorme et al. (2008a).
A promising low-temperature brown dwarf candidate was recently identified by Burningham et al. (2010) and Scholz (2010) as a co-moving companion to the nearby blue L6 dwarf SDSS J141624.08+134826.7 (hereafter SDSS J1416+1348; Bowler et al. 2010; Schmidt et al. 2010; Kirkpatrick et al. 2010). The object, ULAS J141623.94+134836.3 (hereafter ULAS J1416+1348), was identified in UKIDSS as a faint ( = 17.350.02) and unusually blue ( 0.17) near-infrared source separated by 98 from the L dwarf. Using astrometry from 2MASS, UKIDSS, the Sloan Digital Sky Survey Data Release 7 (SDSS DR7; York et al. 2000; Abazajian et al. 2009), and follow-up imaging, both Burningham et al. (2010) and Scholz (2010) were able to confirm common proper motion of this pair. Scholz (2010) also determined an astrometric distance to the primary of 7.91.7 pc, consistent with spectrophotometric estimates from Bowler et al. (2010, 6.5–10.7 pc) and Schmidt et al. (2010, 6.4–9.6 pc). At this distance, the (poorly constrained) absolute magnitudes of ULAS J1416+1348, = 17.80.5 and = 19.40.5, are equivalent to or fainter than those of the latest-type brown dwarfs with measured distances, Wolf 940B ( = 17.680.28 and = 18.370.28; Burningham et al. 2009) and ULAS J003402.77005206.7 ( = 17.650.11 and = 17.980.12; Warren et al. 2007; Smart et al. 2009). Burningham et al. (2010) report a 1.0–2.5 spectrum of ULAS J1416+1348, identifying it as a T7.5 brown dwarf with highly suppressed -band flux. Indeed, ULAS J1416+1348 is the bluest T dwarf in color identified to date, matching the unusually blue nature of its L dwarf companion. Spitzer photometry reported in Burningham et al. (2010) further suggest an exceptionally low-temperature (Teff 500 K), metal-poor ([M/H] -0.3) and high surface gravity atmosphere ( 5.0–5.3 cgs).
In this article, we report our measurement of the near-infrared spectrum of ULAS J1416+1348 obtained with the NASA Infrared Telescope Facility (IRTF) SpeX spectrograph (Rayner et al., 2003). This spectrum encompasses the 0.8–2.4 region, including the metallicity-sensitive -band peak. The unusual shape of this and the -band flux peak, along with fits to spectral models, affirm the interpretation of this source as a metal-poor, high surface gravity T7.5 brown dwarf, albeit with a Teff that is significantly warmer than that reported by Burningham et al. (2010). In Section 2 we describe our observations and discuss the spectral properties of ULAS J1416+1348, including its classification, spectral anomalies and possible indications of NH3 absorption in the 1.0–1.3 region. In Section 3 we present our spectral model fits to the data and corresponding atmospheric parameters, as well as a model-dependent spectroscopic distance that is in accord with the astrometric distance of the primary. We discuss the relevance of this system with regard to the nature of blue L and T dwarfs in Section 4. Results are summarized in Section 5.
2 Near Infrared Spectroscopy
2.1 Observations and Data Reduction
Low resolution near-infrared spectral data for ULAS J1416+1348 were obtained with SpeX on 2010 January 23 (UT) in mostly clear skies with some light cirrus and 08 seeing. We used the SpeX prism mode with the 05 slit aligned to the parallactic angle for all observations, providing 0.7–2.5 coverage in a single order with resolution R and dispersion of 20–30 Å pixel-1. ULAS J1416+1348 was acquired with the slit viewing camera using the filter and guiding was performed on the nearby primary. A total of 34 exposures of 180 s each were obtained in ABBA dither pairs, nodding along the slit. The first 16 exposures of the source were obtained over an airmass range of 1.28–1.41. We then observed the A0 V star HD 121880 ( = 7.59) at an airmass of 1.12 for flux calibration and telluric absorption correction, as well as internal flat field and argon arc lamps for pixel response and wavelength calibration. ULAS J1416+1348 was then reacquired and 18 more exposures made over an airmass range of 1.05–1.13.
Data were reduced with the IDL SpeXtool package, version 3.4 (Cushing et al., 2004), using standard settings. Due to the faintness of ULAS J1416+1348 and its highly structured spectral morphology, individual spectra were optimally extracted using a trace of HD 121880 as a template. These spectra were then combined using a robust weighted average after scaling each to the median flux at the -band peak. Telluric absorption and instrumental response corrections were determined from the A0 V spectrum following the method of Vacca et al. (2003), with line-shape kernels derived from the arc lines and adjustments made to the H I line strengths and wavelength scale, as outlined in Cushing et al. (2004).
2.2 The Spectrum of ULAS J1416+1348
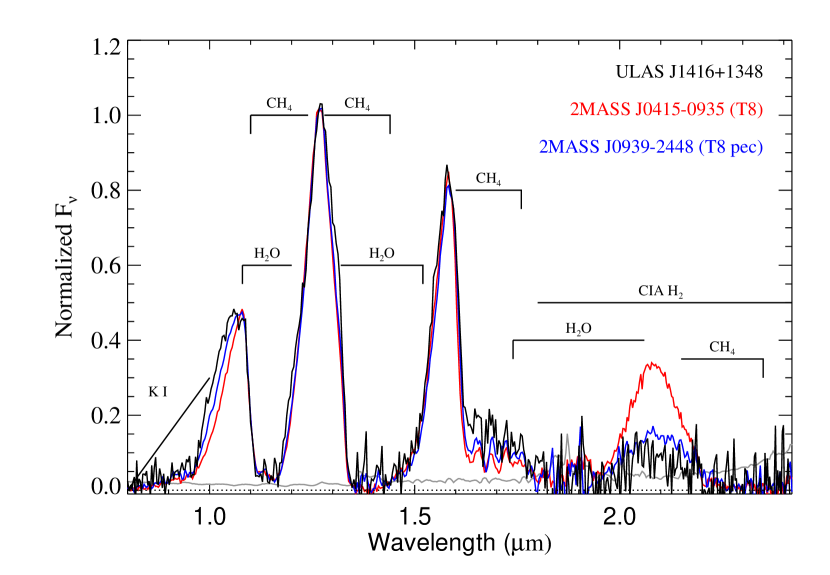
The reduced spectrum of ULAS J1416+1348 is shown in Figure 1, compared to equivalent data for the T8 dwarfs 2MASS J041519540935066 (hereafter 2MASS J04150935; Burgasser et al. 2002, 2004) and 2MASS J093935482448279 (hereafter 2MASS J09392448; Tinney et al. 2005; Burgasser et al. 2006b). ULAS J1416+1348 exhibits the unambiguous signatures of a T dwarf, with strong H2O and CH4 absorption and a blue spectral energy distribution. The 1.6 CH4 band in the spectrum of ULAS J1416+1348 is slightly weaker than those of the T8 comparison sources, although the breadth of the - and -band peaks (both shaped by the wings of H2O and CH4 bands) are equivalent to the spectrum of 2MASS J04150935. T dwarf classification indices (Burgasser et al., 2006b) indicate a spectral type of T7.50.5 for this source, which is also consistent with its NH3-H and indices (Table 5; Warren et al. 2007; Burningham et al. 2008; Delorme et al. 2008a). This classification and most of the spectral indices are in agreement with those determined by Burningham et al. (2010). However, we find a significant disagreement in our measurement of the CH4-J index.Burningham et al. (2010) specifically note this index as anomalousm whereas our value is consistent with the overall spectral classification of ULAS J1416+1348. As both spectra were obtained at roughly the same resolution ( 100), and signal-to-noise of the SpeX data in the -, - and -band peaks is good (40–70), the origin of this anomaly is unclear.
What is most remarkable about the spectrum of ULAS J1416+1348 is the breadth of its 1.07 -band flux peak and strongly suppressed 2.10 -band flux peak. The latter feature was also noted in the spectral data of Burningham et al. (2010), and explains the very blue color of the source; we calculate a spectrophotometric color of 111This value was determined by calculating the colors of 100 realizations of the spectral data, with fluxes varied following a normal distribution of the noise spectrum. We report here the mean and standard deviation of these measures. from our SpeX spectrum, consistent with both the UKIDSS photometry and measurements by Burningham et al. (2010). The broadened -band peak in the spectrum of ULAS J1416+1348 is readily apparent, and similar to but more extreme than the broadened peak seen in the spectrum of 2MASS J09392448 (Figure 1; see also Figure 2 in Burgasser et al. 2006a). The origins of both features are discussed below.
2.3 NH3 Absorption in the 1.0–1.3 Region?
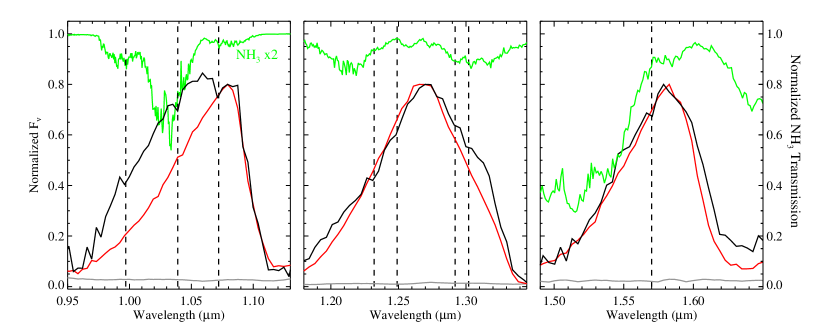
In addition to these broad spectral anomalies, we identified several intriguing absorption features around the -, - and -band flux peaks in the spectrum of ULAS J1416+1348. As shown in Figure 2, these features are at 0.997, 1.039, 1.072, 1.232, 1.249, 1.292, 1.302 and 1.570 , none of which are present in the late-type T dwarfs with comparable SpeX data.222See http://www.browndwarfs.org/spexprism. Among these features, the 1.072, 1.232 and 1.570 features are also seen in the absorption spectrum of Jupiter (Rayner et al., 2009). Given tentative suggestions of the onset of NH3 absorption in the near-infrared spectra of the latest-type T dwarfs (Saumon et al., 2000; Leggett et al., 2007; Delorme et al., 2008a), we examined whether any of these features might be coincident with NH3 opacity. Figure 2 overlays the laboratory transmission function of NH3 from Irwin et al. (1999), measured at temperatures of 200–300 K and pressures of 0.01–1 bar. Structure in the NH3 spectrum appears to be coincident with some of the features, most notably the 0.997, 1.039 and prominent 1.072 dips in the -band, and the weaker 1.292 and 1.302 dips in the -band. However, strong NH3 opacity features, such as the 1.01–1.05 and 1.19–1.23 bands, are not seen in the data.
There are important caveats to such comparisons of opacity measurements to low-resolution brown dwarf spectra. First, opacity from several species, most notably H2O and CH4 gas, blankets the entire near-infrared region, and the resolution of the SpeX data makes it impossible to separate narrow features from these species from coincident absorption arising from to NH3. Second, the laboratory measurements of Irwin et al. (1999) were obtained in very different gas conditions than those that characterize the warmer photospheres of T dwarfs, and are not likely to include the higher angular momentum states expected in to be present in brown dwarf spectra. Indeed, Leggett et al. (2007) have shown that current brown dwarf models incorporating the Irwin et al. (1999) opacities predict NH3 bands that are much stronger than observed, even when nonequilibrium abundances due to vertical mixing are considered (Saumon et al., 2006; Hubeny & Burrows, 2007).
In summary, while these features are notable, they cannot be conclusively associated with NH3 absorption. Higher resolution spectra coupled with better opacity data are needed to verify their origin.
3 The Physical Properties of ULAS J1416+1348
3.1 Qualitative indicators of High Surface Gravity and Subsolar Metallicity
The broadened -band and suppressed -band peaks in the spectrum of ULAS J1416+1348 are similar in nature to those seen in previously identified, unusually blue T dwarfs, and are indicative of pressure effects related to surface gravity and metallicity (Burgasser et al., 2002, 2006a; Knapp et al., 2004; Chiu et al., 2006; Leggett et al., 2007; Stephens et al., 2009). -band flux is regulated by collision-induced H2 absorption (Linsky, 1969; Saumon et al., 1994; Borysow, 2002), which is sensitive to both photospheric gas temperature and pressure. The short wavelength slope of the -band peak is shaped by the red wing of the pressure-broadened 0.77 K I doublet, which is also modulated by temperature (affecting the K abundance) and pressure (affecting the pressure-broadened wings; Allard et al. 2003; Burrows & Volobuyev 2003). The -band peak has been specifically noted as being metallicity-sensitive in comparison of synthetic atmosphere models, becoming both broadened and blue-shifted for lower metallicities (Burgasser et al., 2006a; Leggett et al., 2007).
The archetype blue T dwarf, 2MASS J09373487+2931409 (hereafter 2MASS J0937+2931; Burgasser et al. 2002) exhibits the same -band and -band anomalies as ULAS J1416+1348 and, importantly, is consistently well-matched to models with subsolar metallicities ([M/H] = 0.1 to 0.4) and high surface gravities ( = 5.2 to 5.5; Burgasser et al. 2006a; Geballe et al. 2009). 2MASS J09392448 also exhibits these peculiarities (Figure 1), and its near- and mid-infrared spectrum is well-matched to subsolar metallicity models as well, although it is additionally suspected of being an unresolved binary (Burgasser et al., 2008b; Leggett et al., 2009). Importantly, the -band and -band anomalies are more pronounced in the spectrum of ULAS J1416+1348 than in those of 2MASS J0937+2931 and 2MASS J09392448. Our measure of the index—the relative flux between the - and -band peaks—is the smallest reported to date: 0.0370.004 compared to 0.059 for 2MASS J09392448 (see Table 6 in Burgasser et al. 2006b and Table 6 in Burningham et al. 2009). These measures suggest that ULAS J1416+1348 is a true outlier in terms of its physical properties.
3.2 Comparison to Spectral Models
To quantify these properties, we compared the spectrum of ULAS J1416+1348 to the atmosphere models of Saumon & Marley (2008). We followed the prescriptions detailed in Cushing et al. (2008) and Burgasser et al. (2008b), comparing our SpeX spectrum, flux-calibrated to the -band photometry reported in Burningham et al. (2010), to models spanning temperatures Teff = 500–1000 K (50 K steps); surface gravities = 4.0–5.5 cgs (0.5 dex steps); metallicities [M/H] = 0.3, 0 and +0.3 dex relative to Solar; and vertical diffusion coefficients = 0 and 104 cm2 s-1 (see Saumon et al. 2006). The models were smoothed to the resolution of the SpeX data using a Gaussian kernel, and interpolated onto a common wavelength scale. Fits were made exclusively to the 0.9–2.4 region. The goodness-of-fit statistic (Cushing et al., 2008) was used to gauge the agreement between models and data, and we followed the same weighting scheme employed by those authors in which each pixel is weighted by its breadth in wavelength space. Model surface fluxes were scaled by the factor which minimizes (Equation 2 in Cushing et al. 2008), where is the radius of the brown dwarf and its distance from the Earth. Fits were made to all 264 models. Distributions of the fit parameters were generated following a weighting scheme similar to that described in Burgasser et al. (2008b), in which each model’s parameters were incorporated into the distributions with a weight proportional to333Note that in Burgasser et al. (2008b), the weighting function was e, a conservative choice that favored poorer-fitting models more highly. The 0.5 coefficient used here is more consistent with the probability distribution function of the statistic, for which is a close analog. e. To examine the robustness of our fits to observational uncertainties, we also performed a Monte Carlo simulation similar to that described in Cushing et al. (2008) and Bowler et al. (2009), generating 1000 realizations of the spectrum with fluxes randomly varied about the measured values following a normal distribution of the observational noise; the overall scaling of the spectrum was also varied following a normal distribution tied to the uncertainty in the -band photometry. These spectra were compared to the 20 models that best fit the original spectrum, and distributions of the resulting best-fit parameter sets and scale factors were determined.
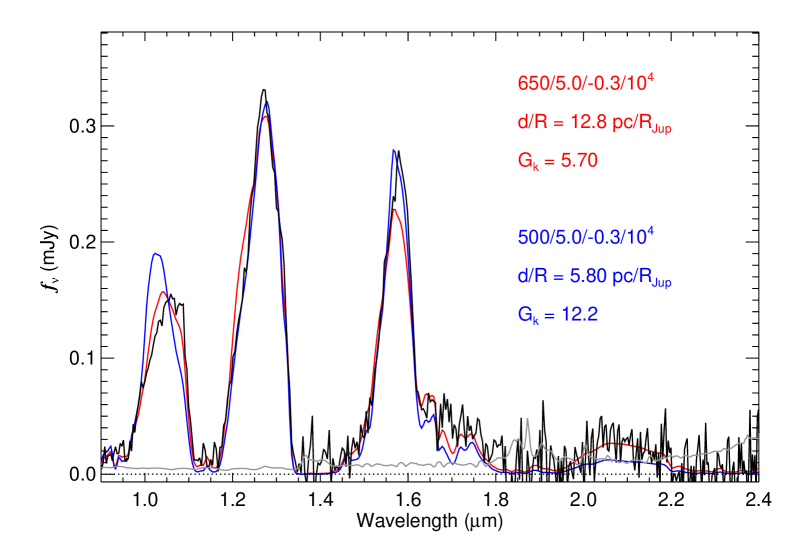
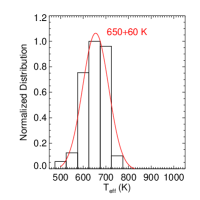
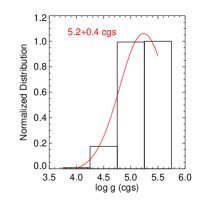
Table 2 summarizes the parameters of the ten best-fitting spectral models, while Figure 3 shows the overall best-fit model overlaid on the spectrum of ULAS J1416+1348: Teff = 650 K, = 5.0 cgs, [M/H] = 0.3 and = 104 cm2 s-1. This model was the best fit for all of the spectra in our Monte Carlo simulation; i.e., its Monte Carlo fraction = 1.000 (Cushing et al., 2008). It is a reasonably good match to the spectral energy distribution, qualitatively reproducing the strong absorption bands, broadened -band peak and suppressed -band peak, although the -band peak flux is 10-15% underestimated. The parameter distributions from all of the model fits are also shown in Figure 3. Gaussian fits to these distributions yield optimal parameters of Teff = 65060 K and = 5.20.4 cgs. The metallicity distribution clearly favors a metal-poor atmosphere; the five best-fitting models all have a subsolar metallicity. In fact, the one-sided distribution in our limited model set means that we cannot rule out metallicities less than . The model fits also indicate some vertical mixing is present, favoring = 104 cm2 s-1 over 0 cm2 s-1, although a strict constraint cannot be made.
With respect to surface gravity and metallicity, our fits to the spectrum of ULAS J1416+1348 are in agreement with the estimates of Burningham et al. (2010), indicating that this unusually blue T dwarf is likely to be old, massive and metal-poor. The derived Teff and parameters and their uncertainties correspond to an age of 2–10 Gyr and a mass of 0.021–0.045 M☉ according to the evolutionary models of Baraffe et al. (2003). This age is consistent with membership in the Galactic disk population, as previously suggested by the system’s kinematics (Bowler et al., 2010; Schmidt et al., 2010). The subsolar metallicity favored by the model fits is in quantitative agreement with spectral analyses of other blue T dwarfs, as well as characterization of the L dwarf companion, SDSS J1416+1348, which does not appear to be a full-fledged L subdwarf (Bowler et al. 2010; however, see Kirkpatrick et al. 2010). As such, these fits support our qualitative analysis of the spectrum: the spectral peculiarities and blue color of ULAS J1416+1348 appear to be the result of a high pressure atmosphere arising from high surface gravity and subsolar metallicity.
3.3 The Teff of ULAS J1416+1348
Our inferred Teff for ULAS J1416+1348 is somewhat low for T7–T8 dwarfs, which typically have Teff 700–900 K (Golimowski et al., 2004; Vrba et al., 2004; Stephens et al., 2009). This is likely to be a surface gravity and/or metallicity effect. Burgasser et al. (2006a) have previously found that late-type T dwarfs with higher surface gravities tend to have lower Teffs for a given spectral type. Burningham et al. (2010), on the other hand, derive an even lower temperature for ULAS J1416+1348, Teff 500 K, based on this source’s uniquely red -[4.5] color. The link between Teff and -[4.5] color for brown dwarfs cooler than 1000 K was originally established by Warren et al. (2007), and has been shown to provide increased sensitivity for the latest-type T dwarfs (Stephens et al., 2009; Leggett et al., 2010). However, Leggett et al. (2009) have noted that metallicity effects are relevant and can shift -[4.5] to the red by roughly 0.1 mag for every 0.1 dex decrement in metallicity (see also Figure 6 in Burningham et al. 2010). If ULAS J1416+1348 has a metallicity significantly below [M/H] = 0.3—not ruled out by the present model fits—then this characteristic may have as much to do with its extreme color as its low temperature. It is relevant to note that the [3.6]-[4.5] color of ULAS J1416+1348, another Teff indicator (Patten et al., 2006), is not an extremum; this source is in fact bluer than 2MASS J09392448. This may be an indication that the 3.3 CH4 band, like the 1.6 band, is relatively weak compared to other T8-T9 dwarfs, consistent with a warmer Teff. However, metallicity and/or surface gravity effects may again complicate a strict correlation.
The Saumon & Marley (2008) spectral model based on the atmosphere parameters favored by Burningham et al. (2010)—Teff = 500 K, = 5.0 cgs, [M/H] = 0.3 dex and = 104 cm2 s-1—is also shown in Figure 3. The cooler model actually provides a better match to the relative flux between the - and -band peaks and the width of the -band peak; but predicts stronger 1.6 CH4 absorption, a far more distorted -band peak and a more suppressed -band flux peak than observed. These deviations make this model a 2 outlier compared to the best-fit model for our data. We emphasize that the differences between these fits do not explicitly rule out either set of parameters It is well known that incomplete opacity tables, inaccurate treatment of K I pressure broadening and the influence of distributed condensate opacity (“cloud tops”) can result in poor fits to T dwarf near-infrared spectra (Burgasser et al., 2006a; Saumon et al., 2007; Cushing et al., 2008; Stephens et al., 2009). However, to the limits of the accuracy of the current spectral models, our analysis favors a warmer temperature for ULAS J1416+1348 than indicated by its -[4.5] color.
3.4 Spectroscopic Distance
Following Bowler et al. (2009), we calculated a spectroscopic parallax for ULAS J1416+1348 using the model-to-data flux scaling factor derived from the spectral modeling. The mean value and uncertainty of this factor (based on the same weighting scheme used for the parameter distributions) yields a distance-to-radius ratio d/R = 12.83.0 pc/RJup. Based on the inferred Teff and range, the evolutionary models of Saumon & Marley (2008) predict a radius = 0.83 RJup, corresponding to a distance of 10.6 pc. This is larger than but within 1 of the astrometric distance of the primary from Scholz (2010), 7.91.7 pc. In contrast, the 500 K model shown in Figure 3 requires d/R = 5.8 pc/RJup, and the corresponding = 0.73 RJup implies a distance of only 4.2 pc, significantly smaller than both spectrophotometric and astrometric estimates for SDSS J1416+1348. Hence, to the limits of the accuracy of the spectral and evolutionary models of Saumon & Marley (2008), our atmospheric parameter determinations for ULAS J1416+1348 are commensurate with this source being cospatial with its co-moving L dwarf companion.
4 The Nature of Blue L and T Dwarfs
The SDSS J1416+1348/ULAS J1416+1348 system provides a unique opportunity to explore the underlying physical properties that distinguish blue L and T dwarfs. While surface gravity and metallicity effects have long been acknowledged as contributors to the peculiarities of blue T dwarfs, condensate cloud properties have been seen as playing a more important role in shaping the spectra of blue L dwarfs. Several studies have argued that thin and/or patchy condensate clouds in the photospheres of blue L dwarfs adequately explain their unique photometric and spectroscopic characteristics (Knapp et al., 2004; Cruz et al., 2007; Burgasser et al., 2008a; Stephens et al., 2009). However, thin clouds cannot be responsible for the colors and spectra of late-type blue T dwarfs—such as ULAS J1416+1348—since clouds are buried deep below the visible photosphere in these low-temperature objects (Ackerman & Marley, 2001).
The distinct empirical characteristics shared by SDSS J1416+1348 and ULAS J1416+1348 must have an origin that is common to both sources; this argues for age and/or metallicity. Older ages for blue L and T dwarfs are supported by their collective kinematics; Faherty et al. (2009) and Kirkpatrick et al. (2010) have shown that this subgroup exhibits a much broader range of tangential velocities ( 50 km s-1) than L and T dwarfs with “normal” colors ( 22 km s-1). The high surface gravities inferred from spectral model fits to blue L and T dwarfs further support older ages for these sources (e.g., Burgasser et al. 2008b; Cushing et al. 2008; Geballe et al. 2009). Subsolar metallicities are also supported by spectral model fits to blue T dwarfs, and the fact that blue L dwarfs exhibit spectral characteristics that are intermediate between normal field L dwarfs and halo L subdwarfs (Burgasser, 2004; Kirkpatrick et al., 2010). However, the discovery of a blue L5 dwarf companion to the solar-metallicity field M4.5 star G 203-50 (Radigan et al., 2008) suggests that metallicity does not play a consistent role in shaping these spectra.
We argue that the common photometric and spectroscopic properties of SDSS J1416+1348 and ULAS J1416+1348 favors old age, and possibly subsolar metallicity, as the physical trait that characterizes the blue L and T dwarf populations. Thin condensate clouds may still be common for blue L dwarf atmospheres, with higher surface gravities and subsolar metallicities contributing to increased sedimentation rates and a reduced supply of condensate species, respectively. However, our conjecture predicts that these cloud properties are simply a consequence of the high-pressure photospheres characterizing old, high surface gravity and—in some cases—metal-poor brown dwarfs.
5 Summary
We have measured the 0.8–2.4 spectrum of ULAS J1416+1348, the common proper motion companion to the blue L dwarf SDSS J1416+1348. These data confirm the T7.5 spectral type determined by Burningham et al. (2010), show possible NH3 features in the 1.0–1.3 region, and reveal broadened -band and highly suppressed -band peaks consistent with a high surface gravity and/or subsolar metallicity. Spectral model fits based on calculations by Saumon & Marley (2008) indicate atmospheric parameters Teff = 65060 K, = 5.20.4 cgs, [M/H] -0.3 and = 104 cm2 s-1. The metallicity and surface gravity are consistent with the analysis by Burningham et al. (2010), but our Teff is 150 K (2.5) warmer. If correct, it suggests that the extreme -[4.5] color of this source may be due to metallicity and/or surface gravity effects, rather than an exceedingly low Teff. Our fit parameters for ULAS J1416+1348 imply a model-dependent spectroscopic distance that is formally consistent with the astrometric distance of SDSS J1416+1348 measured by Scholz (2010), and further strengthens the case that this pair is a coeval system of unusually blue brown dwarfs. We argue that the common peculiarities of the SDSS J1416+1348/ULAS J1416+1348 system implies that most unusually blue L and T dwarfs derive their unique properties from old age, and possibly subsolar metallicity, with the thin clouds of blue L dwarfs being a secondary effect.
Despite the substantial amount of follow-up already done for this fairly recent discovery, its benchmark role in understanding temperature, surface gravity, metallicity and cloud effects in L and T dwarf spectra motivates further observational study of both components. These include independent parallax measurements to verify absolute fluxes; higher-resolution near-infrared spectroscopy and mid-infrared spectroscopy of the secondary to validate potential NH3 features and discern the origin of its unusual mid-infrared colors; broad-band spectral energy distribution measurements of both components to measure luminosities and constrain Teffs; high-resolution imaging to search for additional components; and improved model fits to better constrain atmospheric parameters. In addition, the 100 AU projected separation of this system—wider than any L dwarf/T dwarf pair identified to date—raises questions as to the formation of it and other widely-separated, very low-mass stellar/brown dwarf multiples (e.g., Luhman 2004; Billères et al. 2005; Close et al. 2007). Coupled with its proximity to the Sun, the SDSS J1416+1348/ULAS J1416+1348 system is a target of opportunity for studies of cold brown dwarf atmospheres and origins.


| Index | ValueaaSpectral index values were measured for 1000 realizations of the spectrum, each with a normal distribution of random values scaled by the noise spectrum added to the original fluxes. The reported values are the means and standard deviations of these measurements. | SpT | Value B10bbSpectral index values reported in Burningham et al. (2010) based on 100 near-infrared spectral data. | Reference |
|---|---|---|---|---|
| H2O-J | 0.0530.008 | T8 | 0.070.01 | 1 |
| CH4-J | 0.2680.006 | T7 | 0.340.01 | 1 |
| 0.3760.005 | T7 | 0.340.01 | 2,3 | |
| H2O-H | 0.1810.011 | T8 | 0.200.01 | 1 |
| CH4-H | 0.1970.010 | T7 | 0.200.01 | 1 |
| NH3-H | 0.6750.014 | 0.610.01 | 4 | |
| CH4-K | 0.0850.144 | T7 | 0.290.02 | 1 |
| K/J | 0.0370.004 | 1 |
| Rank | Teff (K) | (cgs) | [M/H] (dex) | (cm2 s-1) | (pc/RJup) | |
|---|---|---|---|---|---|---|
| 1aaBest-fitting model for 1000 synthesized spectra in Monte Carlo simulation; i.e., (see Cushing et al. 2008). | 650 | 5.0 | -0.3 | 104 | 5.70 | 12.8 |
| 2 | 700 | 5.0 | -0.3 | 104 | 5.97 | 15.5 |
| 3 | 600 | 5.0 | -0.3 | 104 | 6.10 | 10.2 |
| 4 | 700 | 5.0 | -0.3 | 0 | 6.53 | 15.4 |
| 5 | 650 | 5.0 | -0.3 | 0 | 6.58 | 12.7 |
| 6 | 600 | 5.5 | 0.0 | 104 | 6.85 | 10.5 |
| 7 | 650 | 5.5 | 0.0 | 104 | 6.88 | 13.3 |
| 8 | 700 | 5.5 | 0.0 | 104 | 7.31 | 15.7 |
| 9 | 600 | 5.0 | -0.3 | 0 | 7.37 | 10.2 |
| 10 | 650 | 5.5 | 0.0 | 0 | 8.01 | 13.3 |
| Avg.bbBased on the weighted parameter distributions shown in Figure 3. Each model contributes its parameters to the distributions scaled by the factor . The means and uncertainties of Teff and were determined by Gaussian fits to their respective distributions (see Burgasser et al. 2008b). The [M/H] distribution peaked at the lower limit of the sampled parameter space, while the models slightly favor = 104 cm2 s-1 over 0 cm2 s-1. | 65060 | 5.20.4 | -0.3 | 12.83.0 |
References
- Abazajian et al. (2009) Abazajian, K. N., et al. 2009, ApJS, 182, 543
- Ackerman & Marley (2001) Ackerman, A. S., & Marley, M. S. 2001, ApJ, 556, 872
- Allard et al. (2003) Allard, N. F., Allard, F., Hauschildt, P. H., Kielkopf, J. F., & Machin, L. 2003, A&A, 411, L473
- Baraffe et al. (2003) Baraffe, I., Chabrier, G., Barman, T. S., Allard, F., & Hauschildt, P. H. 2003, A&A, 402, 701
- Billères et al. (2005) Billères, M., Delfosse, X., Beuzit, J.-L., Forveille, T., Marchal, L., & Martín, E. L. 2005, A&A, 440, L55
- Borysow (2002) Borysow, A. 2002, A&A, 390, 779
- Bowler et al. (2009) Bowler, B. P., Liu, M. C., & Cushing, M. C. 2009, ApJ, 706, 1114
- Bowler et al. (2010) Bowler, B. P., Liu, M. C., & Dupuy, T. J. 2010, ApJ, 710, 45
- Burgasser (2004) Burgasser, A. J. 2004, ApJ, 614, L73
- Burgasser et al. (2006a) Burgasser, A. J., Burrows, A., & Kirkpatrick, J. D. 2006a, ApJ, 639, 1095
- Burgasser et al. (2006b) Burgasser, A. J., Geballe, T. R., Leggett, S. K., Kirkpatrick, J. D., & Golimowski, D. A. 2006b, ApJ, 637, 1067
- Burgasser et al. (2008a) Burgasser, A. J., Looper, D. L., Kirkpatrick, J. D., Cruz, K. L., & Swift, B. J. 2008a, ApJ, 674, 451
- Burgasser et al. (2004) Burgasser, A. J., McElwain, M. W., Kirkpatrick, J. D., Cruz, K. L., Tinney, C. G., & Reid, I. N. 2004, AJ, 127, 2856
- Burgasser et al. (2008b) Burgasser, A. J., Tinney, C. G., Cushing, M. C., Saumon, D., Marley, M. S., Bennett, C. S., & Kirkpatrick, J. D. 2008b, ApJ, 689, L53
- Burgasser et al. (2002) Burgasser, A. J., et al. 2002, ApJ, 564, 421
- Burningham et al. (2008) Burningham, B., et al. 2008, MNRAS, 391, 320
- Burningham et al. (2009) —. 2009, MNRAS, 395, 1237
- Burningham et al. (2010) —. 2010, ArXiv e-prints
- Burrows et al. (2003) Burrows, A., Sudarsky, D., & Lunine, J. I. 2003, ApJ, 596, 587
- Burrows & Volobuyev (2003) Burrows, A., & Volobuyev, M. 2003, ApJ, 583, 985
- Chiu et al. (2006) Chiu, K., Fan, X., Leggett, S. K., Golimowski, D. A., Zheng, W., Geballe, T. R., Schneider, D. P., & Brinkmann, J. 2006, AJ, 131, 2722
- Close et al. (2007) Close, L. M., et al. 2007, ApJ, 660, 1492
- Cruz et al. (2007) Cruz, K. L., et al. 2007, AJ, 133, 439
- Cushing et al. (2008) Cushing, M. C., Marley, M. S., Saumon, D., Kelly, B. C., Vacca, W. D., Rayner, J. T., Freedman, R. S., Lodders, K., & Roellig, T. L. 2008, ApJ, 678, 1372
- Cushing et al. (2004) Cushing, M. C., Vacca, W. D., & Rayner, J. T. 2004, PASP, 116, 362
- Cutri et al. (2003) Cutri, R. M., et al. 2003, VizieR Online Data Catalog, 2246, 0
- Delorme et al. (2008a) Delorme, P., et al. 2008a, A&A, 482, 961
- Delorme et al. (2008b) —. 2008b, A&A, 484, 469
- Faherty et al. (2009) Faherty, J. K., Burgasser, A. J., Cruz, K. L., Shara, M. M., Walter, F. M., & Gelino, C. R. 2009, AJ, 137, 1
- Geballe et al. (2009) Geballe, T. R., Saumon, D., Golimowski, D. A., Leggett, S. K., Marley, M. S., & Noll, K. S. 2009, ApJ, 695, 844
- Golimowski et al. (2004) Golimowski, D. A., et al. 2004, AJ, 127, 3516
- Hubeny & Burrows (2007) Hubeny, I., & Burrows, A. 2007, ApJ, 669, 1248
- Irwin et al. (1999) Irwin, P. G. J., Calcutt, S. B., Sihra, K., Taylor, F. W., Weir, A. L., Ballard, J., & Johnston, W. B. 1999, Journal of Quantitative Spectroscopy and Radiative Transfer, 62, 193
- Kirkpatrick (2005) Kirkpatrick, J. D. 2005, ARA&A, 43, 195
- Kirkpatrick et al. (2010) Kirkpatrick, J. D., et al. 2010, ApJ, submitted
- Knapp et al. (2004) Knapp, G. R., et al. 2004, AJ, 127, 3553
- Lawrence et al. (2007) Lawrence, A., et al. 2007, MNRAS, 379, 1599
- Leggett et al. (2007) Leggett, S. K., Marley, M. S., Freedman, R., Saumon, D., Liu, M. C., Geballe, T. R., Golimowski, D. A., & Stephens, D. C. 2007, ApJ, 667, 537
- Leggett et al. (2009) Leggett, S. K., et al. 2009, ApJ, 695, 1517
- Leggett et al. (2010) —. 2010, ArXiv e-prints
- Linsky (1969) Linsky, J. L. 1969, ApJ, 156, 989
- Lodders (1999) Lodders, K. 1999, ApJ, 519, 793
- Lodders & Fegley (2002) Lodders, K., & Fegley, B. 2002, Icarus, 155, 393
- Luhman (2004) Luhman, K. L. 2004, ApJ, 614, 398
- Marley et al. (1999) Marley, M. S., Gelino, C., Stephens, D., Lunine, J. I., & Freedman, R. 1999, ApJ, 513, 879
- Patten et al. (2006) Patten, B. M., et al. 2006, ApJ, 651, 502
- Radigan et al. (2008) Radigan, J., Lafrenière, D., Jayawardhana, R., & Doyon, R. 2008, ApJ, 689, 471
- Rayner et al. (2009) Rayner, J. T., Cushing, M. C., & Vacca, W. D. 2009, ApJS, 185, 289
- Rayner et al. (2003) Rayner, J. T., Toomey, D. W., Onaka, P. M., Denault, A. J., Stahlberger, W. E., Vacca, W. D., Cushing, M. C., & Wang, S. 2003, PASP, 115, 362
- Saumon et al. (1994) Saumon, D., Bergeron, P., Lunine, J. I., Hubbard, W. B., & Burrows, A. 1994, ApJ, 424, 333
- Saumon et al. (2000) Saumon, D., Geballe, T. R., Leggett, S. K., Marley, M. S., Freedman, R. S., Lodders, K., Fegley, Jr., B., & Sengupta, S. K. 2000, ApJ, 541, 374
- Saumon & Marley (2008) Saumon, D., & Marley, M. S. 2008, ApJ, 689, 1327
- Saumon et al. (2006) Saumon, D., Marley, M. S., Cushing, M. C., Leggett, S. K., Roellig, T. L., Lodders, K., & Freedman, R. S. 2006, ApJ, 647, 552
- Saumon et al. (2007) Saumon, D., et al. 2007, ApJ, 656, 1136
- Schmidt et al. (2010) Schmidt, S. J., West, A. A., Burgasser, A. J., Bochanski, J. J., & Hawley, S. L. 2010, ArXiv e-prints
- Scholz (2010) Scholz, R. 2010, ArXiv e-prints
- Skrutskie et al. (2006) Skrutskie, M. F., et al. 2006, AJ, 131, 1163
- Smart et al. (2009) Smart, R. L., et al. 2009, ArXiv e-prints
- Stephens et al. (2009) Stephens, D. C., Leggett, S. K., Cushing, M. C., Marley, M. S., Saumon, D., Geballe, T. R., Golimowski, D. A., Fan, X., & Noll, K. S. 2009, ApJ, 702, 154
- Tinney et al. (2005) Tinney, C. G., Burgasser, A. J., Kirkpatrick, J. D., & McElwain, M. W. 2005, AJ, 130, 2326
- Vacca et al. (2003) Vacca, W. D., Cushing, M. C., & Rayner, J. T. 2003, PASP, 115, 389
- Vrba et al. (2004) Vrba, F. J., et al. 2004, AJ, 127, 2948
- Warren et al. (2007) Warren, S. J., et al. 2007, MNRAS, 381, 1400
- York et al. (2000) York, D. G., et al. 2000, AJ, 120, 1579