On the selection effect of radio quasars in the Sloan Digital Sky Survey
Abstract
We identified a large sample of radio quasars, including those with complex radio morphology, from the Sloan Digital Sky Survey (SDSS) and the Faint Images of Radio Sky at Twenty-cm (FIRST). Using this sample, we inspect previous radio quasar samples for selection effects resulting from complex radio morphologies and adopting positional coincidence between radio and optical sources alone. We find that % and % radio quasars do not show a radio core within and of their optical position, and thus are missed in such samples. Radio flux is under-estimated by a factor of more than 2 for an additional radio quasars. These missing radio extended quasars are more radio loud with a typical radio-to-optical flux ratio namely radio loudness , and radio power W Hz-1. They account for more than one third of all quasars with . The color of radio extended quasars tends to be bluer than the radio compact quasars. This suggests that radio extended quasars are more radio powerful sources, e.g., Fanaroff-Riley type 2 (FR-II) sources, rather than the compact ones viewed at larger inclination angles. By comparison with the radio data from the NRAO VLA Sky Survey (NVSS), we find that for sources with total radio flux less than 3 mJy, low surface brightness components tend to be underestimated by FIRST, indicating that lobes in these faint radio sources are still missed.
1 Introduction
In past decades, we have witnessed a rapid growth in the number of radio selected Active Galactic Nuclei (AGNs) resulting from large and deep radio surveys such as the Faint Images of Radio Sky at Twenty centimeters (FIRST, Becker, White & Helfand 1995) and the NRAO VLA Sky Survey (NVSS, Condon et al. 1998) coupled with optical spectroscopy follow-ups or dedicated spectroscopic surveys such as the Two degree Field (2dF, Maddox et al. 1998; Boyle et al. 2001) and the Sloan Digital Sky Survey (SDSS, York et al. 2000; Stoughton et al. 2002). However, some fundamental issues regarding the origin of radio emission remain hotly debated: is the radio loudness dichotomy true or not (Kellermann et al. 1989; Miller, Peacock & Mead 1990; Hewett et al. 2001; Ivezic et al. 2002)? Are radio jets in radio quiet/intermediate quasars relativistic (Readhead et al. 1988; Wilson & Colbert 1995; Meier et al. 2001)? Which physical parameters control the large range of radio strength despite their great similarity in the SED at other wavelengths for various quasars (Barthel 1989; Urry & Padovani 1995; Jackson & Wall 1999; Boroson 2002; Aars et al. 2005)?
Concerning the first question, the ambiguity is caused largely by various selection biases introduced by the survey limits, the incompleteness in the radio sample due to their complex morphologies or in the optical sample due to various color selections (Ivezic et al. 2002; Cirasuolo et al. 2003a; Best et al. 2005). The traditional radio surveys were carried out at shallow flux density limits (0.1-1 Jy) and primarily radio-loud quasars were detected (e.g., Bennett 1962; Smith & Spinrad 1976; Colla et al. 1972; Fanti et al. 1974; Large et al. 1981). Only the two latest radio surveys NVSS and FIRST have enough sensitivity and positional accuracy to allow for the detection of large number of radio intermediate and radio quiet quasars in conjunction with moderately deep, large area optical surveys such as 2dF and SDSS. However, by taking advantage of the accuracy in the position of radio sources, most authors constructed the radio quasar or quasar candidate sample using solely the position match between radio and optical sources (Gregg et al. 1996; White 1999; Lacy & Ridgway 2001; McMahon et al 2002; Richards et.al. 2002; Cirasuolo et al.2003b). This process introduces a bias against lobe-dominated radio quasars: either they were missed or their radio flux underestimated.
White, Becker & Gregg (1999, 2000) argued that this incompleteness is not severe in FIRST Bright Quasar Survey (FBQS), which was selected by matching of optical counterparts within a position offset to the radio sources in the FIRST catalog. Using a matching radius of , Ivezic et al. (2002) estimated that less than SDSS-FIRST associations have complex radio morphology, and core-lobe and double-lobe sources together represent about only in the radio quasars and galaxy sample. Using a novel technique, de Vries et al. (2006) constructed a Fanaroff-Riley type 2 (FR-II) quasar sample, and found that FR-II quasars do not show cores at the FIRST flux limit. These authors also compared the emission line properties and optical colors of these FR II quasars with radio quiet quasars. It should be noted that these missing quasars are not random, but are all extended sources and tend to be more radio loud (Falcke et al 1996; Ivezic et al. 2002; Best et al 2005). As a result, the statistical properties of the sample, such as radio loudness and radio luminosity distribution, will be affected by this selection effect.
In this paper we study in detail of selection effects in the SDSS radio quasar samples. We identified from SDSS and FIRST a large sample of radio quasars, including those with complex radio morphology. Besides using positional coincidence as a primary selection criterion, we manually examined the FIRST images for all of the candidates with extended radio morphology. Through this less efficient process, we obtained a sample of spectroscopically confirmed quasars with secure radio identification. A detail comparison of this sample with other radio quasars sample is given. Various selection effects are quantified. Throughout this paper, we will adopt a concordant cosmology with km s-1 Mpc-1, , and .
2 The Radio Quasar Sample
2.1 Optical data
Our starting point is the SDSS quasar catalog constructed by Schneider et al (2005). The catalog consists of quasars that contain at least one broad emission line ( km s-1 ), or are unambiguously broad absorption line quasars. These quasars selected from SDSS photometric catalog either by their colors or for their positional coincidence with radio sources in the FIRST catalog (within 2" of a FIRST source) or ROSAT X-ray sources (within 10-20" of a ROSAT source), were spectroscopically confirmed to meet above criteria and their absolute optical magnitudes at -band . The sample also includes some supplementary quasars that meet the above criteria, but were selected initially as galaxy targets (Eisenstein et al. 2001; Strauss et al. 2002). Note that the magnitude limits for various candidates are different, for color selected low () quasars, for color-selected high quasars, for FIRST and ROSAT sources, and for the main galaxy sample. The final sample contains quasars in the redshift range , absolute magnitude range , and -band optical magnitude range .
We use a subsample of this catalog in order to minimize the bias introduced in the selection of quasar candidates. The SDSS sources with their target-flags as “QSO_FIRST_CAP” or “QSO_FIRST_SKIRT” only (hereafter FIRST-only sources) will bias against the lobe-dominated radio sources, and are redder than the color-selected quasars (Richards et al. 2002). Therefore, they will be excluded from the sample. Since radio and X-ray emission from quasars are well-correlated (Shastri et al. 1993, Brinkmann et al. 2000; Padovani et al. 2003), the ROSAT-only selected quasars will be biased toward radio strong sources, and as such are excluded from the sub-sample.
2.2 Radio data
Radio counterparts to SDSS quasars are found using the FIRST survey. The survey covers about 10,000 and is % complete to 2 mJy, % complete to 1mJy (Becker et al 1995). The source surface density in this survey is deg-2. At the 1 mJy source detection threshold, the resolution is better than . Individual sources down to 1 mJy threshold have % confidence error circles with radii of .
The FIRST catalog was produced by fitting a two-dimensional Gaussian to each source to generate major axes, minor axes, peak and integrated flux densities from the co-added images. The major axes have been deconvolved to remove blurring by the elliptical Guassian fitting. For bright sources, the size was determined down to of the beam size . The FIRST survey also provides clean radio images.
2.3 Compact radio quasars
Most radio quasars are compact sources in the FIRST images and as such, they can be identified through cross-correlation of the FIRST catalog with the SDSS quasar catalog by adopting a small matching radius in the position offset.
The matching radius is a trade-off between the completeness and random association, i.e., the higher completeness necessarily implies higher random contamination. Knapp et al. (2002) showed that the random association increases with matching radius at . Magliocchetti & Maddox (2002) found that matching radius could include of the true matches above 1 mJy level. Gregg & Becker (1996) estimated that more than FBQS-I quasars with magnitude are within offset between the POSS-I and FIRST positions, while White, Becker et al. (1999) showed that matching radius will eliminate most of false quasar candidates at the expense of only of incompleteness, and the fraction of optical candidates found to be quasars declines steadily from near offset to at , and is constant farther out. Ivezic et al. (2002) estimated that matching radius produces completeness and random contamination, and matching radius with completeness and a contamination of 3%. For their photometric SDSS quasar sample, they estimate matching radius will cover almost all counterpart but with 9% random contamination.
Following Richards et al. (2002), we used a matching radius of for compact FIRST sources and obtained 2782 matches with a false rate111The fraction of chance coincidence is estimated as , where is the surface density of FIRST sources, the matching radius, the number of quasars in the catalog of SDSS DR3, and the number of matches. of . In addition, we found 71 SDSS quasars locate within the ellipses of FIRST sources with core-jet or diffuse structure, but with their optical-radio offset larger than the matching radius. We added these quasars to our sample after visual confirmation of the true association.
2.4 Extended radio quasars
The two point angular correlation function (Cress et al. 1995) can be used to define an appropriate scale for searching for radio matches with complex radio morphologies. The correlation function in can be well fitted by a power law , where the angle in units of degree, and . At the (), it drops to a value of only 0.038 which means that double and multi-component FIRST sources are shown to have a little clustering amplitude beyond that angular limit, i.e., intrinsic correlated double and multi components mostly clustered under that scale. We also note that the physical size for the angle at z=0.05 is kpc, approximately to the scale of most radio jet and lobe ( kpc, Readhead et al. 1988; Jackson 1999, krolik 1999 ). All quasars in the SDSS DR3 have redshift above 0.05. So we use the FIRST map surrounding the quasar to determine possible complex structure.
The extended radio quasars are extracted in two steps. First, the candidates of radio quasars are selected with one of the following two simple criteria: (1) two radio sources locate nearly symmetrically around the quasar position, i.e., the angle between optical-radio connections lies , and the ratio of their distances to the quasar is ; (2) more than two radio sources scatter around the SDSS quasars. The first criterion allows us to detect radio sources with symmetric lobes, either of FR-II or FR-I type (Fanaroff & Riley 1974), which is similar to that used by de Vries et al. (2006). The FR-I sources are core-dominated sources with a bright nucleus and two extended lobes with the surface brightness decreasing towards the edges. In contrast, the FR-II sources are generally lobe-dominated sources, and always show brighter lobes, usually with a hot spot, and with or without a weak core (see Fig. 1). However, when viewed at an extreme angle, the FR-II sources may be dominated by the brighter core (Barthel 1989; Hoekstra et al. 1997; Hardcastle et al.1998). By the first criterion, sources with distorted asymmetric lobes may be missed. The second criterion is designed for more complex radio morphologies, such as sources with distorted asymmetric lobes and a compact core or for cases in which extended lobes are resolved into complex structure in the FIRST image. (see Fig. 1) With these criteria, we selected 3115 radio quasar candidates. Among them, 1035 sources are selected by the first criterion, and 2080 by the second one. A cutout of FIRST image222 centered at the quasar candidate was extracted for each SDSS source, and visually checked. We use the radio morphologies in the 3CR radio sources 333 as the reference for the true matches. We found about 70% of these radio components in cutouts are likely not related to the SDSS quasars, i.e., they are isolated components or radio components related to other SDSS sources, or they have no convincing evidence for their connection to the quasar. They will be excluded either from the radio flux estimation or from the sample.
In the end, 859 extended sources are selected (with unambiguous radio lobes, jets) from initial 3115 candidates. Among them, about half (409) show FR-II morphologies, and 564 have radio core components (within 2" circle of optical quasar position) in the FIRST catalog. In comparison, de Vries et al. found 422 FR-II quasars using Abazajian et al. (2005) DR3 quasar sample (44984 sources), of which 359 are in common. The members of radio counterparts in the de Vries sample that are not included in our sample are 63. Most these “lost” objects (41 out of 63) are not included in the SDSS DR3 quasar catalog of Schneider et al. (2005). The other 18 were excluded by us due to their ”FIRST-only” or ”ROSAT-only” target-flag. The remaining 4 were excluded by us for their inconvincible connection between the radio and optical sources. We also notice that, for 83 of the 359 common quasars in both sample that show more complex radio structure than simply ”double-lobes”, i.e., the lobes resolved in the FIRST image, we account for the radio fluxes of all components. As a comparison, Vries et al. (2006) only considered the radio fluxes of the two components located symmetrically around the quasar, thus the total radio fluxes are systematically underestimated for these sources. The flux difference between the two ranges from to , with a typical value of .
The maximum projected physical distance of the lobe component is independent of the radio power (see left panel of Fig. 2) while the rest-frame peak intensity increases with radio power as shown in right panel of Fig. 2. The former is expected if the radio power does not vary significant during the quasar activity phase while the lobe to push further outward. The latter may result from the interaction of powerful radio jet with medium, which will produce more relativistic electrons, thus high intrinsic brightness.
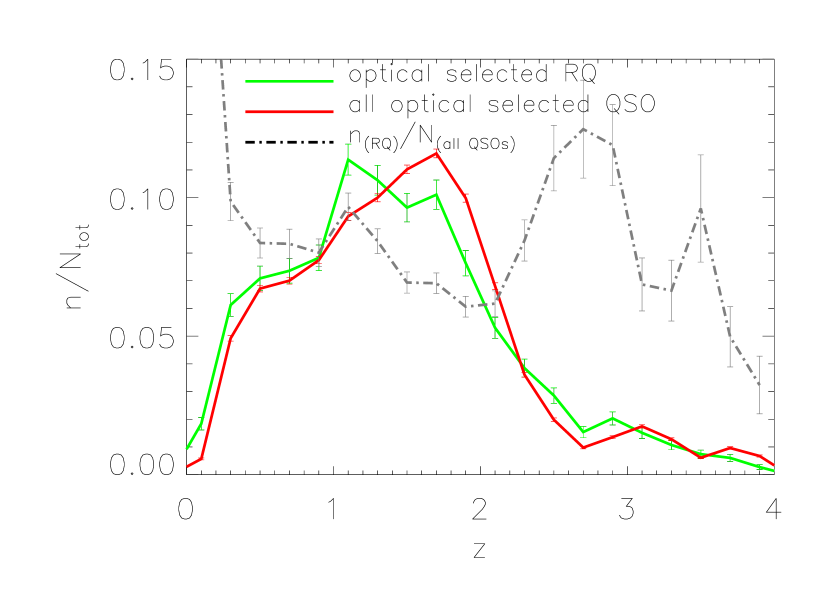
By merging the compact and extended radio quasar sample after eliminating duplicate sources, we obtain a sample of 3641 radio quasars. Among them, 859 are multi-component sources (extended sources, hereafter) and the remain 2782 are single component sources (hereafter compact sources). The average apparent magnitude of this sample is , the median redshift is (see Fig.3). The distributions of optical selected and optical+radio selected sub-sample are significant difference. As noticed by Richards et al. (2006), radio-selected and optically-selected quasars show different redshift distribution in the sense that the optical selected quasars show deeper deficit at , while the optical+radio quasars distribute smoother at . This is due to the selection effect of the optically-selected SDSS quasars based on optical colors. We can also see that radio quasars peak at a slightly lower redshift and are more abundant between redshifts of 2.2 and 3.0. This may be due to the comparatively shallower survey depth of FIRST, so that we can find more radio counterparts of optical-selected quasars at lower redshift.
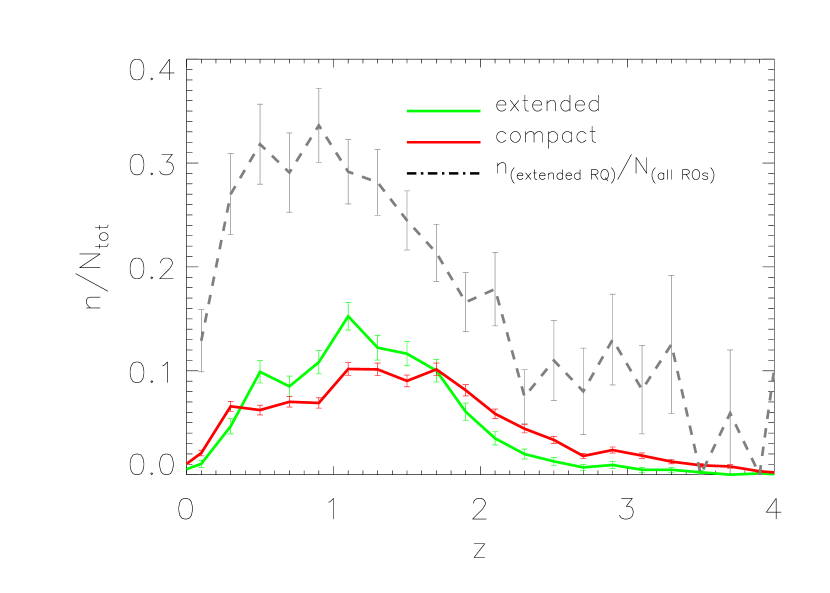
Note that the redshift distribution of extended sources peaks at lower redshift than the compact quasars, i.e., the fraction of extended sources decreases with redshift. The median radio flux is 5.49 mJy for compact quasars and 48.31 mJy for extended quasars.
3 On the selection effect of radio quasar sample
3.1 The incompleteness of extended sources caused by the surface brightness limit
FIRST is not sensitive to low surface brightness emission due to its small beam size. As such diffuse emission, if present, will be missed in the FIRST survey. It should be noted that the surface brightness are lowered due to cosmological expansion (), as such lobes may fall below the detection limit (0.75 mJy per beam) of the FIRST survey at large redshift (see below). In the worst case, if the source is dominated by a diffuse component, they may escape the detection at all in the FIRST survey. We use cross correlation between SDSS and NVSS to constrain this.
The 1.4GHz NRAO VLA Sky Survey (NVSS; Condon etal 1998 ) provided a catalog contain sources stronger than mJy. It is percent complete at integrated flux density mJy and percent complete at mJy. With a synthesized beam of (FWHM), NVSS is much more sensitive to lower surface brightness components than FIRST. Therefore, it can be used to check the fraction of quasars with only diffuse emission. For typical redshift of quasars in this sample, the radio emission should be unresolved by NVSS.
In the following we will consider radio sources with NVSS flux density larger than mJy. The matching radius used in the cross-correlation of DR3 quasars and NVSS sources is trade-off between random contamination and completeness. First, we estimate that the fractions of chance coincidence corresponding to , , matching radius are %, , respectively. Second, we checked 775 extended sources with FIRST flux above 3 mJy in our FIRST-DR3 quasar sample. Among them, NVSS counterparts are found for 719 quasars (%) within offset of the quasars. The fraction decreases to with a matching radius, and increase to with matching radius. We take as the matching radius for the NVSS-SDSS match.
With matching radius, we extracted NVSS radio counterparts to SDSS DR3 quasars in the overlapping area of FIRST, SDSS DR3 and NVSS, with the NVSS flux density limit of 3 mJy. In this DR3-NVSS sample, sources are not present in our DR3-FIRST radio quasar sample. of these ”lost” sources locate at a distance larger than the NVSS major axis from the quasar. We found the NVSS-SDSS offset distribution of these ”lost” sources are significantly different from the ”found” ones (see the bottom panel of Fig. 4), indicating most of them are due to chance coincidence. This number is close to the expected rate of chance coincidences (). Note in passing four sources are found in our DR3-FIRST sample, but their NVSS flux density are less than 3 mJy. Therefore, no more than 19 extended radio quasars may be missed due to the higher FIRST resolution at the NVSS flux density limit of 3 mJy. This lost fraction is . Therefore, above 3 mJy flux density limit, the radio quasars with only diffuse radio sources are rare.
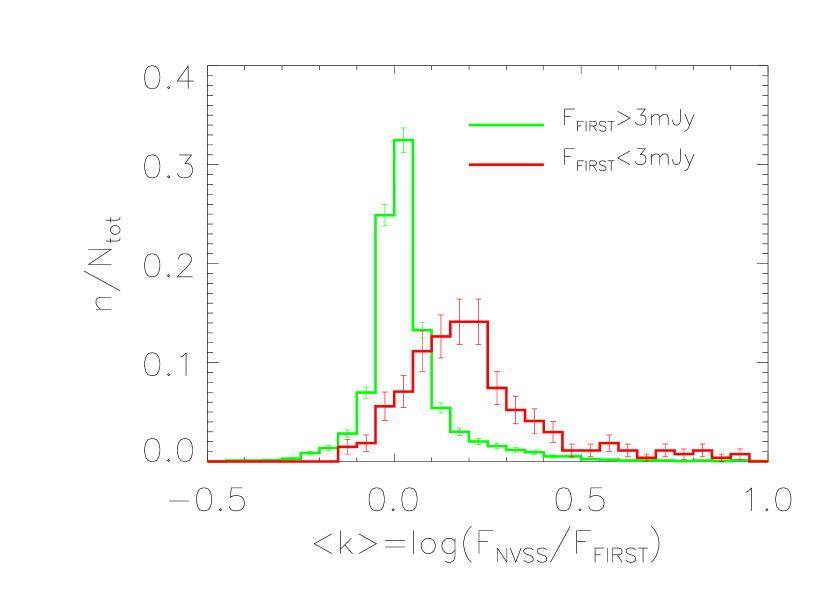
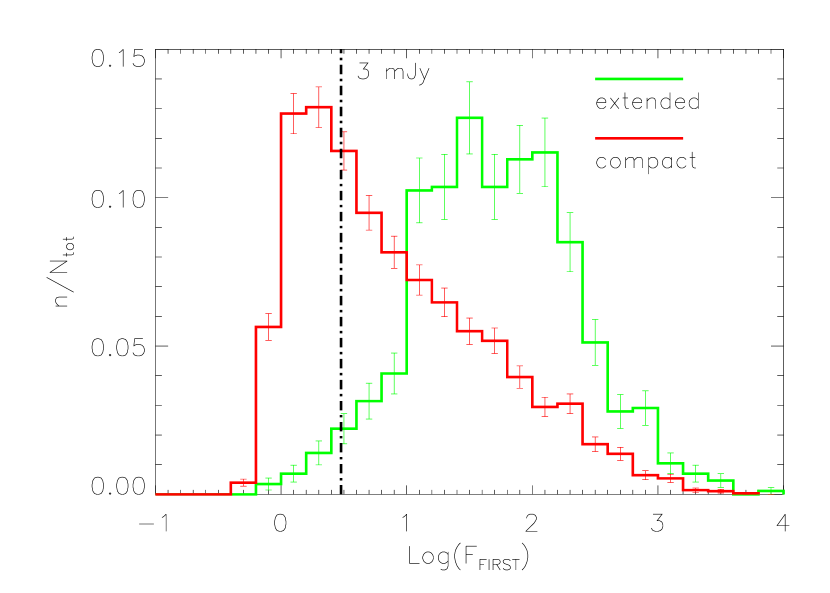
However, weak diffuse emission is likely to be overlooked by FIRST. We plotted the distribution of at FIRST flux 3 mJy and 3 mJy (left panel of Fig.4), where is the sum of all radio sources within the NVSS beam size. The is peaked at zero with a tail toward above 3 mJy, which suggests that most of the NVSS flux had been detected by the FIRST. But below 3 mJy limit, increased to 0.24. This indicates that some diffuse radio flux such as weak lobes of extended sources can be underestimated by the FIRST as flux density decreases. As a result, some extended sources with low surface brightness may be mis-identified as compact sources. This may explain why most of the extended sources have flux greater than 3 mJy (see the right panel of Fig.4).
3.2 The selection effects of a radio quasar sample
In this section, we will address the selection effects introduced by the positional coincidence alone using our radio quasar sample. This includes the lost fraction of lobe-only objects and the underestimate of the extended flux. In the following, we will divide the radio quasars into extended and compact sources according to whether one or more extra-core components are present or not. The core component is defined as the single component within the radius of the optical quasar.
The distribution of position offsets of the closest radio component to the SDSS quasar is shown in the left panel of Fig.5 for our radio quasar sample. We find that 13.0% of quasars will be lost with a matching radius in the position offset of , 10.4% at and at . With these numbers, we conclude that the fraction of radio quasars missed due to lack of detectable radio cores is low.
Using the positional coincidence will underestimate the radio flux density if there is one or more off-core components even if a radio core is present. This will be important particularly in lobe-dominated quasars. To quantify this bias, we calculate as the flux ratio of the core component to the total radio flux (the summation over all radio counterparts that are associated with the radio quasar). The distribution of for 564 quasars with core-lobe structure and 295 objects without cores ( of all extended sources) are shown in Fig.5. It is interesting to note that the distribution of keep nearly constant between , i.e., the number of strong-lobe sources () and weak-lobe sources () are similar. We found that the radio fluxes are either underestimated by a factor more than two or complete missed in about 16.8% of all radio quasars. The sources with two or more components are significantly more numerous than estimated by Ivezic et al. (2002).
Note that with our definitions whether a quasar is compact or extended depends also on the redshift of the quasar. Fig.3 shows that the fraction of extended sources peaks at redshift and decreases dramatically at redshift . Note that this is not due to the increase of the angular distance because it is peaked around 1.5 for the cosmological model adopt here, and most extended sources at redshift less than 0.5 have sizes that should be resolved at redshift around 2-4 ( Fig.6). This can be due to either an evolution in the radio structure of quasars or the decrease of brightness caused by cosmology expansion () (Fig.6).
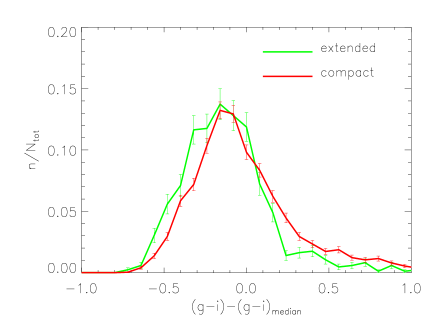
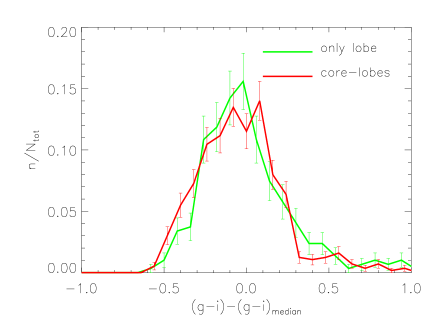
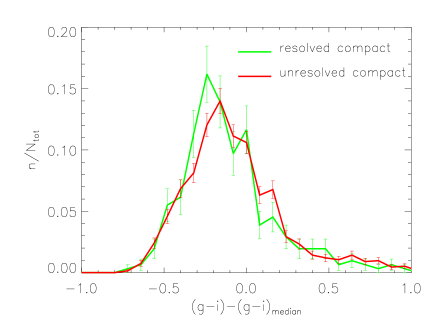
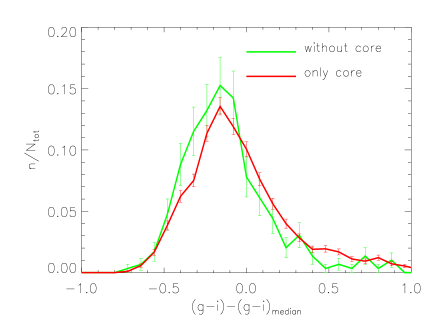
We show the optical color distributions in Fig. 7. In order to eliminate the dependence on redshift, we divide our sample into 20 redshift bins. For each bin, we subtract from the median value of in that bin. Surprisingly, the color distribution of extended radio quasars (with and without core) does not appear redder, but slightly bluer than the compact radio quasars. Kolmogorov-Smirnoff test deems the significant difference between the color distribution of extended and compact sources at the confidence level . Also, student-t test suggests that the mean color of the extended radio quasars is bluer than that of the compact quasars at a confidence level of .
The result remains the same for the core-only and lobe-only sources and for quasars with unresolved and resolved cores (resolved core: log, with mJy in order to gain sufficient S/N ratio, (Ivezic et al. 2002). (see Fig.7 ). But, the core-lobe sources and the only-lobe sources are indistinguishable. These results are in line with that of de Vries et al.(2006), who found that the composite spectrum of FR-II quasars is flatter than that of radio compact quasars.
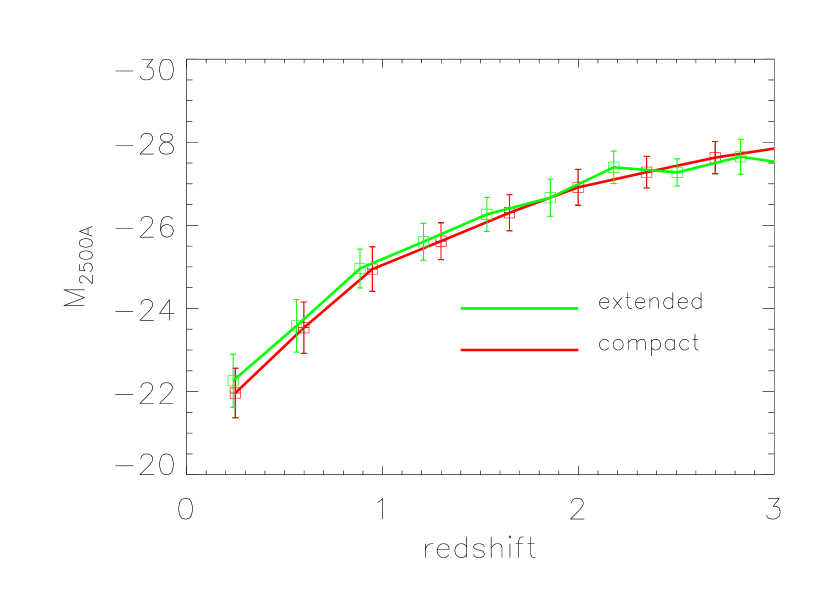
Since most quasars have redshift of , we calculate the -corrected UV flux at at the rest frame of quasars by interpolating or extrapolating the SDSS five apparent magnitudes using a function. Extrapolation is required for only a small number of quasars at low redshift (). The radio loudness is defined as the flux ratio of -corrected radio flux at 20 cm and the UV flux at . An average of radio spectral index for quasars is assumed. We plot the average UV absolute magnitudes versus redshift in left panel of the Fig.8. We find that the average UV absolute magnitudes of extended and compact sources are similar, as they are for resolved and unresolved sources.
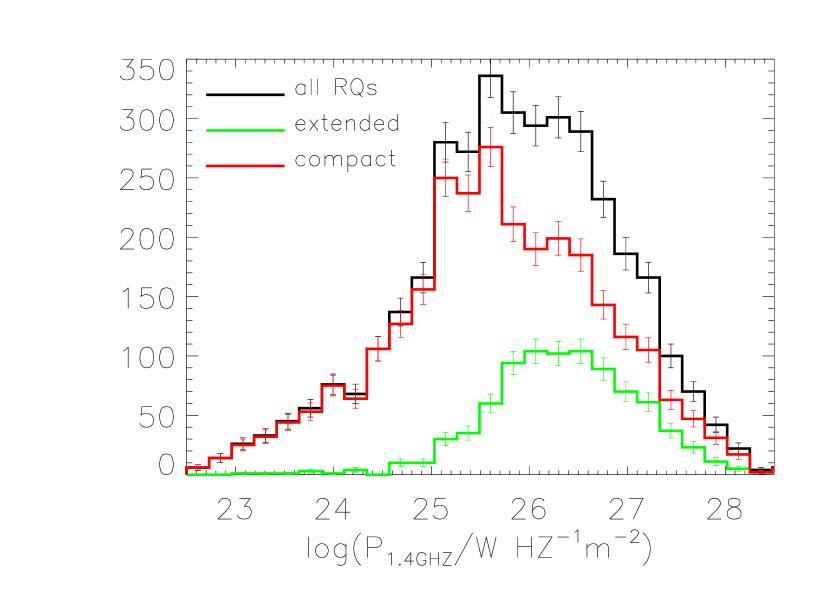
Next, we calculated the -corrected radio power at 20 cm as , where the radio spectral index is assume to be for all objects. The radio power and the radio loudness distribution is shown in Fig.9, and the radio power as a function is shown in right panel of Fig.8. Evidently, extended radio quasars are much more powerful in the radio than compact radio quasars despite their similar optical luminosity.
The difference in the radio power between the extended and compact sources decreases with increasing redshift, a factor of more than 10 at redshifts less than 0.5 to a factor 2 or so at redshift larger than 2 (Fig.8). This might be caused by a combination of the survey limit, with which only powerful radio sources can be detected at high , and an increase in the detecting limit of intrinsic brightness for the extended lobes at high redshift, i.e., only very bright lobes are detected, and thus only very powerful FR II sources. At redshift less than 0.5, the radio power of compact radio quasars is close to the border of FR-I/FR-II division.
It was proposed that strong radio emission from extended quasars may be enhanced by interaction of powerful radio jets with the interstellar medium (Bridle et al. 1995; Wills & Brotherton 1995). As such the difference in the radio power of core-dominated and extended quasars is due to their different environment, rather than their different central engine. To check this point, we compare the core radio power for those quasars with detected cores, and found that extended quasars have more powerful cores. Therefore, our result does not support this interpretation.
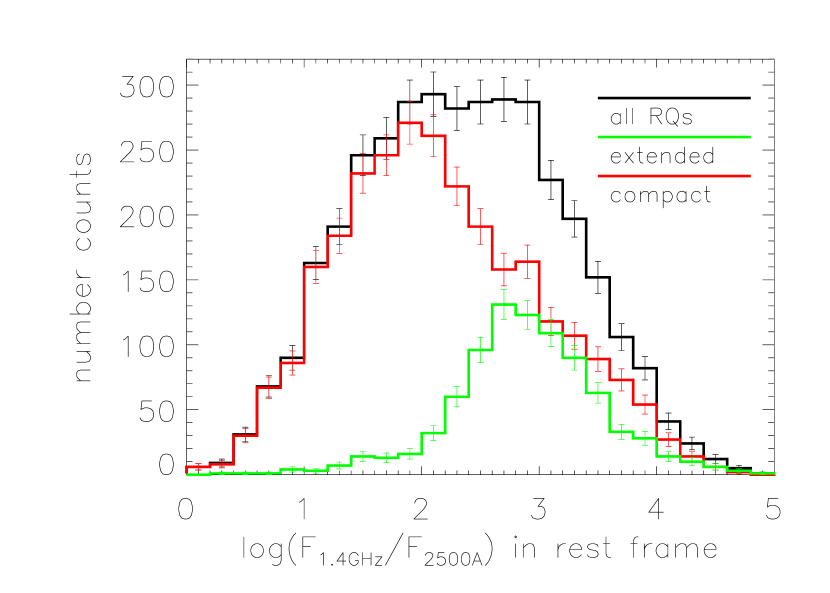
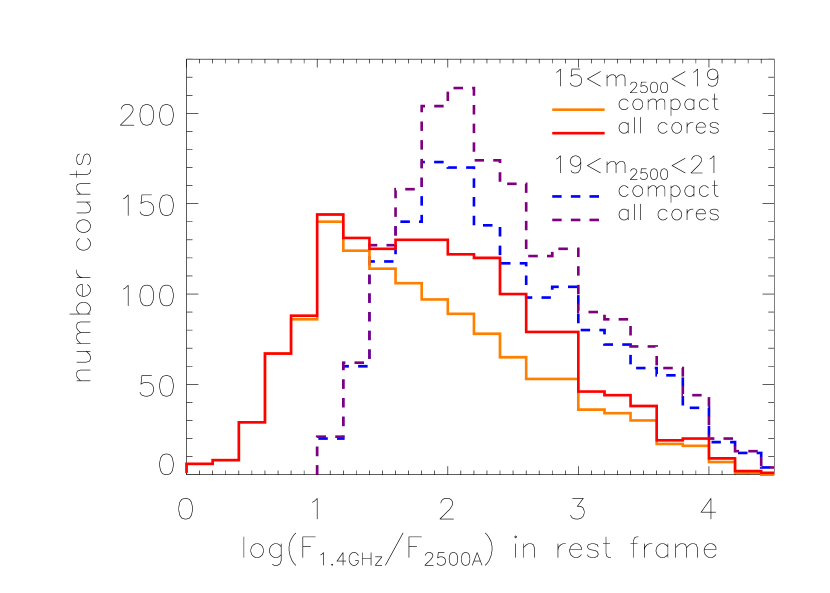
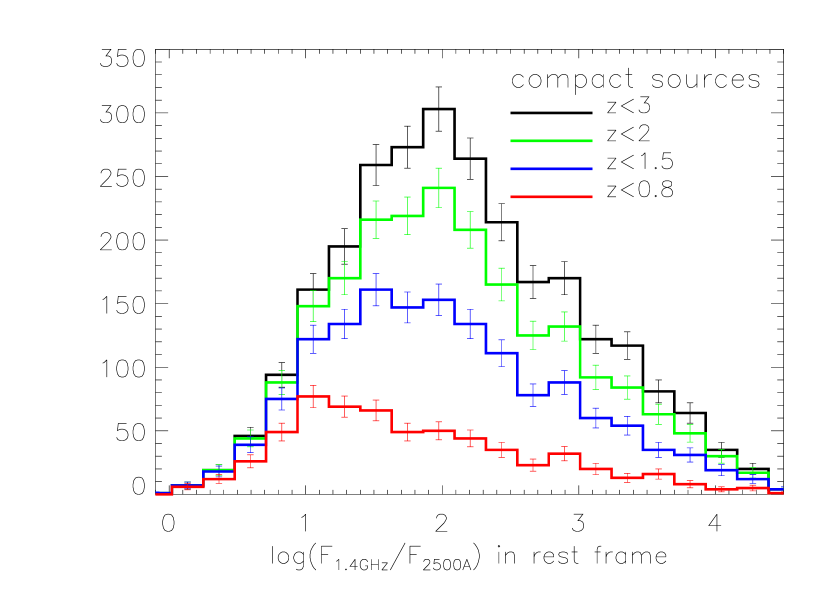
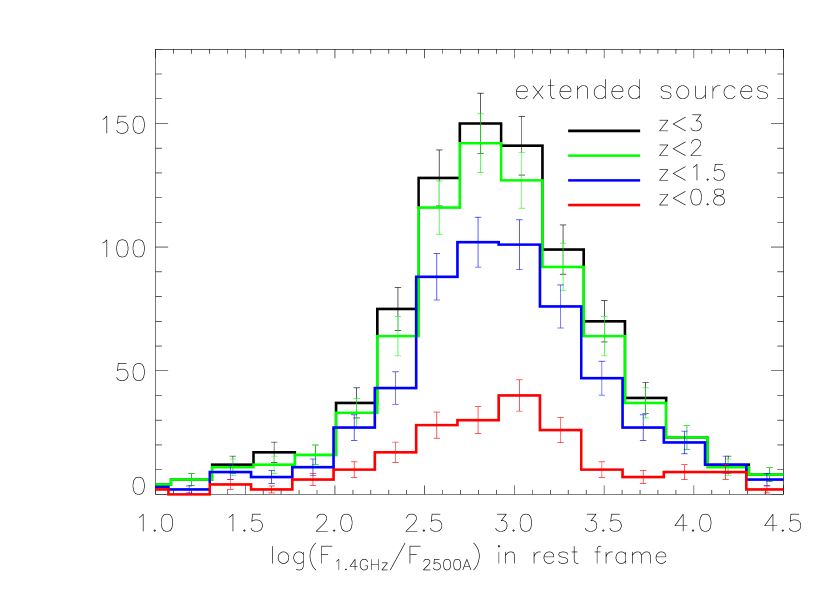
The radio and optical flux limits introduce another selection effect on the radio loudness distribution of quasars. At a given optical magnitude limit, only quasars with their radio loudness above certain limit can be detected in the FIRST survey due its flux limit, i.e., the sample is complete above certain radio loudness. Using a similar strip in the log plane as Ivezic et al. (2004), we estimate the conditional radio loudness distribution under different photometric limit. As shown in Fig.10, the distribution of log for compact sources peak at for , consistent with Ivezic et al. (2004). Adding the core flux of extended sources, the radio loud peak becomes more significant with the amplitude of the dip at log increasing from 24% to 37% due to their contribution to large radio loudness portion. As shown in Fig.10, the distribution for extended quasars keeps to peak at log at different i-magnitude bins, while the compact sources shown peak at log. Furthermore, the compact sources distribution peaks at lower radio loudness when i decreased.
By plotting the radio loudness under different redshift, we find that the peak of the compact radio quasars moves to small RL as redshift decreases, while the distribution of the extended radio quasars remains the same (peaked at ) for all redshift (see Fig.11) This radio loudness distribution of the extended (also more radio loud) radio quasars is consistent with Cirasuolo et al. (2003b), who modeled the radio loudness distribution with double-Gaussian function by fitting the FIRST selected 2dF quasars, and found that the intrinsic radio loudness of radio quasars peaks at log and log.
4 Conclusion and Discussion
We have constructed a relatively unbiased large radio quasar sample using the SDSS quasar catalog (Schneider et al. 2005), and the FIRST catalog and images. Apart from positional coincidence of radio sources within of quasars, we also identify the radio counterpart of quasars with complex radio morphologies such as lobe -dominated quasars by visual inspection of their radio images. We find that using the positional coincidence alone will miss radio counterpart that do not show radio core at FIRST flux limit of 1 mJy, and under-estimates the radio flux by a factor of more than two in another objects. By comparing the radio flux from FIRST survey with that from NVSS, we found that lobes in weak radio sources tend to be missed in this sample. So these numbers are only lower limits.
Quasars with extended radio emission show both larger radio powers and radio loudness, and appear somewhat bluer than radio compact quasars despite their indistinguishable optical luminosity. As such, the radio extended quasars account for nearly one third of radio loud quasars at log. Naturally, including the extended emission and weak core radio sources increases the fraction of the radio loud objects and the significance of radio loud peak in the distribution of Hough & Readhead radio loudness.
Our results in the first glance are not consistent with the simple unification scheme in which radio compact quasars are extended ones viewed along radio jet, for which the relativistic beaming enhances the core radio emission and as such the total radio power (Wills & Browne 1986; Hough & Readhead 1988; Barthel 1989; Falcke et al. 2004) when the projection effect would make the apparent size smaller. Within such a scheme, the unresolved core is enhanced because of the beaming effect. That the lobe-dominated quasars are more luminous in radio seems to contradict this model. However, there are at least two selection effects that make the average radio power in the core-dominated sources smaller.
First, as we showed in the last section that the peak brightness of radio lobe component is correlated with radio power, and the FIRST will not be able to detect the lobe component in less radio power sources, especially at high redshift (see also Fig.2). Second, if most of core-dominated quasars are intrinsically radio weaker (Wang et al. 2006) and if the radio luminosity function of them is steep, their average apparent luminosity can be lower even if the radio power had been boosted.
The relative number density of the extended and compact sources also suggests that majority of compact sources are either of beamed, intrinsically much weak radio quasars or intrinsically compact radio sources, such as CSS (Compact Steep Spectrum Objects) or GPS (GigaHertz Peaked Sources). With typical Lorentz factor of 10-15 for jets in FR-II radio quasars, the boosted emission can be viewed in only relatively small fraction of solid angle between the line of sight and the jet, , whereas at other angles the core is weakened due to Doppler effect. If the power of the un-beamed radio cores is near 0.005 of that of the lobes, as determined for 3CR sources (Urry & Padovani 1995), and if the intrinsic radio loudness distribution following Cirasuolo et al. (2003b) , and with the luminosity distribution as DR3 quasar sample, we can estimate that beamed intrinsic radio quiet sources could be detected by FIRST. Since GPS and CSS are all powerful radio sources, it is likely most of these compact quasars are beamed radio intermediate quasars as proposed by Falcke et al. (1996)
Our results suggest that lobe-dominated sources are not particularly reddened, in agreement with the finding by de Vries et al. (2005). This is valid even for quasars without detectable radio core at flux down to the FIRST limit. The line of sight does not intercept the dusty torus in those lobe-dominated quasars. However, Backer et al. (1997) found that most lobe-dominated quasars in the Molonglo quasars are reddened by , and CSSs are most reddened. It should be pointed out that quasars reddened by this amount cannot be found in the ‘color’ selected sample, in particularly at high redshift due to strong attenuation in ultraviolet. The slightly bluer color for lobe-dominated quasars in this sample could be due to inclusion of CSS-like objects in the core-dominant objects or due to a selection effect by which reddened ”extended” radio quasars are lost.
If Baker (1997) is correct, we might miss a large number of heavily reddened lobe-dominated quasars. Although most such quasars are likely below the magnitude limit of spectroscopic quasar sample, in principle the FIRST selected sample is able to detect some of such reddened quasars, particularly in the low redshift if a weak core is present. We look at the spectroscopic sources that selected as FIRST sources only, and find that the FIRST-only selected spectroscopic sources are indeed much redder. But the fraction of quasars with extended lobes in FIRST-only sources is very low() probably due to large extinction. Thus it is not conclusive whether a large number of such reddened lobe-dominated quasars do exist.


References
- Aars et al. (2005) Aars, C. E., Hough, D. H., Yu, L. H., Linick, J. P., Beyer, P. J., Vermeulen, R. C., & Readhead, A. C. S. 2005, AJ, 130, 23
- Abazajian et al. (2005) Abazajian, K., et al. 2005, AJ, 129, 1755
- Barthel (1989) Barthel, P. D. 1989, ApJ, 336, 606
- Becker et al. (1995) Becker, R. H., White, R. L., & Helfand, D. J. 1995, ApJ, 450, 559
- Bennett (1962) Bennett, A. S. 1962, MmRAS, 68, 163
- Best et al. (2005) Best, P. N., Kauffmann, G., Heckman, T. M., & Ivezić, Ž. 2005, MNRAS, 362, 9
- Backer et al. (1997) Backer, D. C., Dexter, M. R., Zepka, A., Ng, D., Werthimer, D. J., Ray, P. S., & Foster, R. S. 1997, PASP, 109, 61
- Boroson (2002) Boroson, T. A. 2002, ApJ, 565, 81
- Boyle et al. (2001) Boyle, B. J., Croom, S. M., Smith, R. J., Shanks, T., Outram, P. J., Hoyle, F., Miller, L., & Loaring, N. S. 2001, Deep Fields, 282
- Bridle et al. (1994) Bridle, A. H., Hough, D. H., Lonsdale, C. J., Burns, J. O., & Laing, R. A. 1994, AJ, 108, 766
- Brinkmann et al. (2000) Brinkmann, W., Laurent-Muehleisen, S. A., Voges, W., Siebert, J., Becker, R. H., Brotherton, M. S., White, R. L., & Gregg, M. D. 2000, VizieR Online Data Catalog, 335, 60445
- Cirasuolo et al. (2003) Cirasuolo, M., Magliocchetti, M., Celotti, A., & Danese, L. 2003, MNRAS, 341, 993
- Cirasuolo et al. (2003) Cirasuolo, M., Celotti, A., Magliocchetti, M., & Danese, L. 2003, MNRAS, 346, 447
- Condon et al. (1998) Condon, J. J., Cotton, W. D., Greisen, E. W., Yin, Q. F., Perley, R. A., Taylor, G. B., & Broderick, J. J. 1998, AJ, 115, 1693
- Colla et al. (1972) Colla, G., et al. 1972, A&AS, 7, 1
- Cress et al. (1995) Cress, C. M., Helfand, D. J., Becker, R. H., & White, R. L. 1995, Bulletin of the American Astronomical Society, 27, 1364
- Cress et al. (1996) Cress, C. M., Helfand, D. J., Becker, R. H., Gregg, M. D., & White, R. L. 1996, ApJ, 473, 7
- de Vries et al. (2006) de Vries, W. H., Becker, R. H., & White, R. L. 2006, AJ, 131, 666
- Eisenstein et al. (2001) Eisenstein, D. J., et al. 2001, AJ, 122, 2267
- Falcke et al. (1995) Falcke, H., Gopal-Krishna, & Biermann, P. L. 1995, A&A, 298, 395
- Falcke et al. (1996) Falcke, H., Sherwood, W., & Patnaik, A. R. 1996, ApJ, 471, 106
- Falcke et al. (2004) Falcke, H., Körding, E., & Markoff, S. 2004, A&A, 414, 895
- Fanaroff & Riley (1974) Fanaroff, B. L., & Riley, J. M. 1974, MNRAS, 167, 31P
- Fanti et al. (1974) Fanti, C., Fanti, R., Ficarra, A., & Padrielli, L. 1974, A&AS, 18, 147
- Gregg et al. (1996) Gregg, M. D., Becker, R. H., White, R. L., Helfand, D. J., McMahon, R. G., & Hook, I. M. 1996, AJ, 112, 407
- Hardcastle et al. (1998) Hardcastle, M. J., Alexander, P., Pooley, G. G., & Riley, J. M. 1998, MNRAS, 296, 445
- Hewett et al. (2001) Hewett, P. C., Foltz, C. B., & Chaffee, F. H. 2001, AJ, 122, 518
- Hoekstra et al. (1997) Hoekstra, H., Barthel, P. D., & Hes, R. 1997, A&A, 319, 757
- Hough & Readhead (1988) Hough, D. H., & Readhead, A. C. S. 1988, IAU Symp. 129: The Impact of VLBI on Astrophysics and Geophysics, 129, 99
- Ivezić et al. (2002) Ivezić, Ž., et al. 2002, AJ, 124, 2364
- Ivezić et al. (2004) Ivezić, Z., et al. 2004, ASP Conf. Ser. 311: AGN Physics with the Sloan Digital Sky Survey, 311, 347
- Jackson & Wall (1998) Jackson, C. A., & Wall, J. V. 1998, ASSL Vol. 226: Observational Cosmology with the New Radio Surveys, 203
- Jackson & Wall (1999) Jackson, C. A., & Wall, J. V. 1999, MNRAS, 304, 160
- Jackson (1999) Jackson, C. A. 1999, Publications of the Astronomical Society of Australia, 16, 124
- Kaiser (2000) Kaiser, C. R. 2000, A&A, 362, 447
- Kellermann et al. (1989) Kellermann, K. I., Sramek, R., Schmidt, M., Shaffer, D. B., & Green, R. 1989, AJ, 98, 1195
- Knapp et al. (2002) Knapp, G. R., et al. 2002, Bulletin of the American Astronomical Society, 34, 1180
- Krolik (1999) Krolik, J. H. 1999, Active galactic nuclei : from the central black hole to the galactic environment .Princeton, N. J. : Princeton University Press
- Lacy & Ridgway (2001) Lacy, M., & Ridgway, S. E. 2001, Bulletin of the American Astronomical Society, 33, 1520
- Large et al. (1981) Large, M. I., Mills, B. Y., Little, A. G., Crawford, D. F., & Sutton, J. M. 1981, MNRAS, 194, 693
- McMahon et al. (2002) McMahon, R. G., White, R. L., Helfand, D. J., & Becker, R. H. 2002, ApJS, 143, 1
- Maddox (1998) Maddox, S. 1998, ASP Conf. Ser. 146: The Young Universe: Galaxy Formation and Evolution at Intermediate and High Redshift, 146, 198
- Magliocchetti & Maddox (2002) Magliocchetti, M., & Maddox, S. J. 2002, MNRAS, 330, 241
- McMahon et al. (2002) McMahon, R. G., White, R. L., Helfand, D. J., & Becker, R. H. 2002, ApJS, 143, 1
- Meier (2001) Meier, D. L. 2001, ApJ, 548,L9
- Miller et al. (1990) Miller, L., Peacock, J. A., & Mead, A. R. G. 1990, MNRAS, 244, 207
- Padovani et al. (2003) Padovani, P., Costamante, L., Ghisellini, G., Giommi, P., & Perlman, E. 2003, ASP Conf. Ser. 299: High Energy Blazar Astronomy, 299, 63
- Readhead et al. (1988) Readhead, A. C. S., Pearson, T. J., & Barthel, P. D. 1988, IAU Symp. 129: The Impact of VLBI on Astrophysics and Geophysics, 129, 65
- Richards et al. (2002) Richards, G. T., et al. 2002, AJ, 123, 2945
- Richards et al. (2006) Richards, G. T., et al. 2006, AJ, 131, 2766
- Schneider et al. (2005) Schneider, D. P., et al. 2005, AJ, 130, 367
- Shastri et al. (1993) Shastri, P., Wilkes, B. J., Elvis, M., & McDowell, J. 1993, ApJ, 410, 29
- Smith et al. (1976) Smith, H. E., Smith, E. O., & Spinrad, H. 1976, PASP, 88, 621
- Stoughton et al. (2002) Stoughton, C., et al. 2002, AJ, 123, 485
- Strauss et al. (2002) Strauss, M. A., et al. 2002, AJ, 124, 1810
- Urry & Padovani (1995) Urry, C. M., & Padovani, P. 1995, PASP, 107, 803
- Wang et al. (2006) Wang, T. G., Zhou, H. Y., Wang, J. X., Ru,Y., Ru.Y.,& Lu,Y. J. 2006. APJ accepted
- White (1999) White, R. 1999, HST Proposal, 4716
- White et al. (2000) White, R. L., et al. 2000, ApJS, 126, 133
- Wills & Browne (1986) Wills, B. J., & Browne, I. W. A. 1986, ApJ, 302, 56
- Wills & Brotherton (1995) Wills, B. J., & Brotherton, M. S. 1995, ApJ, 448, L81
- Wilson & Colbert (1995) Wilson, A. S., & Colbert, E. J. M. 1995, ApJ, 438, 62
- York et al. (2000) York, D. G., et al. 2000, AJ, 120, 1579