Which galaxies host bars and disks?
A study of the Coma cluster
Abstract
We present a study of the bar fraction in the Coma cluster galaxies based on a sample of galaxies selected from the Sloan Digital Sky Survey Data Release 6 (SDSS-DR6) and observed with the Hubble Space Telescope (HST) Advanced Camera for Survey (ACS). The unprecedented resolution of the HST-ACS images allow us to explore the presence of bars, detected by visual classification, throughout a luminosity range of 9 magnitudes ( M), permitting us to study the poor known region of dwarf galaxies. We find that bars are hosted by galaxies in a tight range of both luminosities ( M) and masses (). This result holds when comparing with a sample of bright/massive field galaxies. In addition, we find that the bar fraction does not vary significantly when going from the center to the cluster outskirts, implying that cluster environment plays a second order role in bar formation/evolution. The shape of the bar fraction distribution with respect to both luminosity and mass is well matched by the luminosity distribution of disk galaxies in Coma, indicating that bars are good tracers of cold stellar disks. We discuss the implications of our results for the formation and evolution scenarios of bars and disks.
1 Introduction
Bars are believed to be very important with regard to the dynamical and secular evolution of disk galaxies. In particular, they represent the main internal driver of galaxy structure and morphology evolution within the central 10 kpc. Stellar bars are also recognized as the most important internal factor that redistribute the angular momentum between the baryonic and dark matter components (Debattista & Sellwood, 1998, 2000). The amount of angular momentum exchanged is related to specific properties of the galaxies, such as the bar mass, halo density, and halo velocity dispersion (Athanassoula, 2003; Sellwood & Debattista, 2006). Moreover, they funnel material towards the galaxy center where starbursts can ignite (Sheth et al., 2005), contribute to the formation of bulge-like structures (Kormendy & Kennicutt, 2004), inner star-forming rings (Buta et al., 2003; Muñoz-Tuñón et al., 2004), inner bars (Erwin, 2004; Debattista & Shen, 2007), and feed the central black hole (Shlosman et al., 2000; Corsini et al., 2003). Peanut/boxy bulges in galaxies are also thought to be associated with bending instabilities and bar vertical resonances (Bureau & Freeman, 1999; Martinez-Valpuesta et al., 2006; Méndez-Abreu et al., 2008)
Stellar bars are observed in optical images of roughly half of all the nearby disk galaxies (Barazza et al., 2008; Aguerri et al., 2009). This fraction rises slightly to about 59-62% when near-infrared images are analysed (Laurikainen et al., 2004; Marinova & Jogee, 2007; Menéndez-Delmestre et al., 2007). It is established that they appear naturally in most simulations of galaxy formation once a dynamically cold and rotationally-supported disk is at place. However, even if bars are ubiquitous in the universe, it is not clear yet why one galaxy can exhibit a bar structure while another apparently similar does not.
The mechanisms leading to the formation of bars can be divided into internals and externals. The most widely accepted internal mechanism to produce bars in galaxies is based on the mode global instability in cold, rotationally supported disks (Hohl, 1971; Ostriker & Peebles, 1973). Environmental effects could also be important, though the existence of competing mechanisms usually prevents simple interpretations. Depending on the orbital configuration, interactions can weaken severely bars and even destroy them or, on the other hand, significantly speed up bar formation (Noguchi, 1987; Aguerri & González-García, 2009). Moreover, numerical simulations of galaxy harassment in clusters have shown that bar growth is a common and stable process during the evolution of late-type galaxies in dense environments (e.g. Mastropietro et al., 2005).
Only with the recent advent of large galaxy surveys, either at high (Sheth et al., 2008, COSMOS) or low redshift (Barazza et al., 2008; Aguerri et al., 2009, SDSS), statistical studies of bar frequencies have been possible. However, bar studies have been usually restricted to luminous galaxies due to either the lack of spatial resolution or because images were not deep enough. The present work attempts to put observational constraints on the internal (mass) and external (environment) parameters that influence bar formation by carrying out a comprehensive study of the bar fraction in the Coma cluster galaxies throughout a wide range of 9 magnitudes, covering from giant ellipticals (M) to dwarf galaxies (M). This research will also provide us the luminosity/mass interval where cold stellar disks are present in galaxies. For this purpose we take advantage of the unrivalled resolution of the HST-ACS Coma cluster Treasury Survey, which provides deep imaging of the core and infall region of the Coma cluster.
The paper is organised as follows. The galaxy sample, as well as the selection of the Coma cluster member galaxies is presented in Sect. 2; the method adopted to detect bar structures in the sample galaxies, and the results obtained are explained in Sect. 3; the discussion of the results and our conclusions are given in Sect. 4. Throughout the paper, we assume a distance modulus of m-M=35.
2 Data and cluster membership selection
The Coma cluster is one of the best-studied galaxy clusters because of its relative proximity and because it may be a prototype of dynamically relaxed cluster, even though significant substructures are present (Colless & Dunn, 1996).
The HST-ACS Coma Cluster Treasury Survey (Carter et al., 2008), covers 230 arcmin2 with 21 ACS pointings (33 arcmin). The magnitude limits of the survey at 10 for 1 arcsec2 extended regions are g’=25.8 mag/arcsec2 and =25.0 mag/arcsec2. At the distance of the Coma cluster ( 100 Mpc), the resolution of HST-ACS () corresponds to pc. This gives essentially the same physical resolution as ground-based observations have in Virgo and it will allow us to resolve bars down to sizes of pc.
The Coma cluster is also covered by the SDSS, providing galaxy magnitudes in five bands (). For the sake of comparison with recent works on bar fractions (Barazza et al., 2008; Aguerri et al., 2009), and in order to have access to galaxy colors, which will help us to determine cluster memberships, we decided to create our catalogue of sources using the SDSS-DR6 (Adelman-McCarthy et al., 2008).
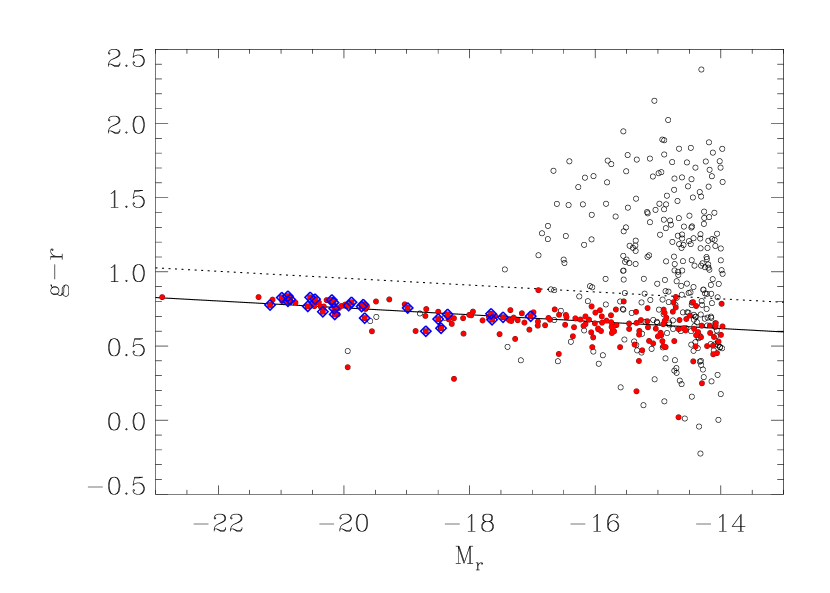
The steps followed to obtain our final sample of Coma cluster members were the following: from the SDSS-DR6 we downloaded a catalogue of extended sources within a 5 arcmin radius from the position of every ACS pointing. This catalogue contains all galaxies with m, which represent approximately the completeness limit of the SDSS photometric survey for extended sources, and with , and being the semi-major and semi-minor axis lengths of the galaxies, in order to deal with projection effects. This resulted in a sample of 477 galaxies (black circles in Fig. 1), 104 of them having recession velocities available from the Nasa Extragalactic Database (NED). We select galaxies with velocities km/s with respect to the Coma redshift as cluster members. This range corresponds to a 3 cut on the velocity distribution of the Coma cluster galaxies ( km/s; Colless & Dunn 1996). We found that all 104 galaxies satisfy this condition and therefore they are cluster members. At this point, we decided to visually inspect every galaxy in order to determine its possible cluster membership based on its morphology. We follow the prescriptions given by Michard & Andreon (2008) where they claim that morphologically selected cluster members are reliable when compared with redshift membership, and present a catalogue of 473 Coma members down to MB=-14.25 based on their morphology. The procedure to distinguish between background objects and cluster members is based in some basic hypothesis. Typical spirals in the background lie in the magnitude range of dwarf galaxies in Coma. However, these objects are rare in the field and even more in dense cluster environments. Moreover, we exclude from our sample all spiral like galaxies that had either bulge or disk sizes too small if they were cluster members. With regard to elliptical galaxies, far-away bright ellipticals are generally more concentrated that early-type dwarfs in Coma. In addition, they are more reddened and our further color cut will easily get rid of them. We found that, from the remaining 373 galaxies without redshift, 127 galaxies followed the morphological criteria to be cluster members, while 246 did not. A further colour condition was still imposed for these candidates to be considered as cluster members. To calculate our color cut, we fit the red sequence of all galaxies in our sample and imposed that members should have a color less than 0.2 magnitudes above the value of the fit (see Fig. 1). With this further constraint, our sample of Coma secure members consists of 188 galaxies (red points in Fig. 1) with magnitudes in the range M.
Several quality checks were done during the morphological membership classification: at a first step the classification was performed independently by two of the authors (JMA and RSJ), obtaining consistent results. Next we compared our cluster memberships with those given by Michard & Andreon (2008). From the 225 galaxies in common, both classifications agree for a 78% of galaxies. In addition, including colors at this step instead of only as a final constraint, this percentage grows up to a 85%, confirming the good agreement between both classifications. As a final check, we also compared our morphological membership with the available spectroscopic redshifts. We found that from the 104 galaxies with redshift, 103 (99%) share the same class, giving validity again to our classification.
3 Method and results
The presence of a bar can be revealed by visual inspection of the images (de Vaucouleurs et al., 1991), by analysing the shape and orientation of the galaxy isophotes (Laurikainen et al., 2005; Menéndez-Delmestre et al., 2007; Marinova & Jogee, 2007; Sheth et al., 2008; Barazza et al., 2008; Aguerri et al., 2009; Marinova et al., 2009), by studying the Fourier modes of the light distribution (Ohta et al., 1990; Elmegreen & Elmegreen, 1985; Aguerri et al., 1998, 2000; Laurikainen et al., 2005), or fitting the different structural components to the surface brightness distribution (Weinzirl et al., 2009).
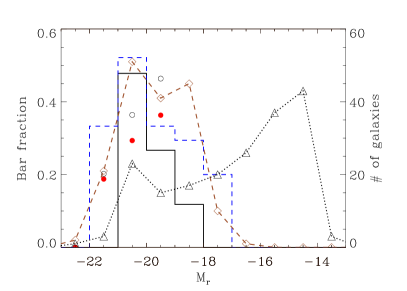
In the present work, we visually classified all galaxies into strong barred, weakly barred, and unbarred. A caveat regarding this criteria is that our distinction between strong and weak bars is not directly related to the contribution of the bar to the total galaxy potential, but rather they refer to a secure or possible detection of a bar, respectively. Therefore, the fraction of weak bars could be understood, in some way, as a measure of our uncertainty in bar detection. The visual classification was carried out by two of us (JMA and RSJ) using the redder available filter (F814W) of the HST-ACS images. Both classifications were in close agreement and only their mean is reported in the following (see also Fig. 2). Since the goal of this paper is to understand where do bars form, we have not defined the bar fraction in the classic way, i.e., using only disk galaxies, but we have instead used all galaxies independently of their Hubble type. Using this definition, our bar fraction turns to be and depending if only strong or also weak bars are included, respectively.
Fig. 2 shows the bar fraction as a function of the luminosity and mass of the secure sample of galaxies in the Coma cluster. It is clear that independently of the bar strength, bars are hosted by galaxies in a tight range of luminosities or masses. There are no strong bars in the Coma cluster out of the luminosity range between M. These limits become M if we include also weak bars.
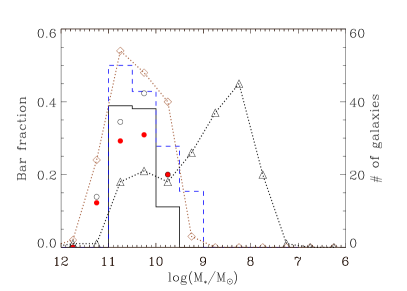
The mass of the galaxies is one of the fundamental parameters controlling their evolution. We use the prescriptions given by Bell et al. (2003) to derive the stellar mass of our galaxies using the color and the diet Salpeter initial mass function (IMF). We find again the same behavior in the bar fraction when using the galaxy mass: bars exist only in a range of masses between either or depending on whether only strong or strong+weak bars are considered, respectively.
These findings rely on a relatively small number of galaxies and might be affected by statistical errors. Nevertheless, similar results were found when comparing the bright/massive side of our bar fraction distribution with that obtained, also by visual inspection of the galaxy images, in the large sample of field galaxies studied by Aguerri et al. (2009), indicating that bars are not hosted by very bright galaxies (see Fig. 2).
4 Discussion and conclusions
We have used HST-ACS images taken in the F814W filter to search for bars in a sample of 188 galaxies members of the Coma cluster. Bars were identified based on visual inspection of the images. The unprecedented spatial resolution provided by HST-ACS in this region has allowed us to compute the bar fraction throughout a large range of 9 magnitudes, permitting us to explore the presence of bars in the poorly known region of dwarf galaxies.
We find that bars are not hosted by galaxies in the whole range of luminosities nor masses covered in this study. On the contrary, they appear to be well constrained in a tight interval of both luminosities M and masses . This result has several implications on our current understanding of bar formation and/or evolution.
If we assume that bars are tracers of cold stellar disks, the presence of bars is particularly useful to identify galaxies with disks in clusters (Marinova et al., 2009). Therefore, it could be logical to think that the distribution of bar fraction with the galaxy magnitude should trace the shape of the disk galaxies luminosity distribution. Binggeli et al. (1988) showed in his seminal paper the magnitude distribution of morphological classes for the Virgo cluster. In the bright side of the distribution ellipticals are the dominant type, while both dwarf ellipticals and dwarf irregulars are the most common morphological type in the low luminosity region. Instead, disk galaxies appear to be constrained in the range M in accordance with our results. In order to test this hypothesis in the Coma cluster, we have computed the luminosity distribution of morphologically selected disk galaxies (from S0 to Sc) using the classification carried out by Michard & Andreon (2008). The resulting luminosity distribution (brown diamonds in Fig. 2) matches well the shape of the bar fraction distribution in both luminosity and mass, confirming that bars are good tracers of disks.
Since simulations suggest that bars form spontaneously in cold and rotationally-supported disks, the non existence of bars in galaxies with M can be interpreted either as evidence that cold disks do not form in such massive galaxies, or existing disks are somewhat heated and they are not able to form/host a bar.
Disk heating should be predominant in high density environments due to the higher frequency of close encounters, major and minor accretions, and the presence of tidal forces, however, no differences were found between field and cluster in the limiting magnitude of galaxies hosting bars. This constancy could otherwise be interpreted as a physical limit in the formation of disk galaxies. Numerical simulations carried out by Dekel & Birnboim (2006) and Cattaneo et al. (2006) suggest that the physics of the gas, which will form galaxy disks, depends on the galaxy mass. They claim that in halos below a critical shock-heating mass disks are built by cold gas streams while for the gas is heated by a virial shock and do not form disks. This corresponds to a stellar mass of which roughly coincides with our limiting mass for galaxies hosting bars.
From the environment perspective external triggers, such as tidal interactions, can induce bars (Noguchi, 1987) but their effects can be contradictory since they may also heat the disks and thereby make them less susceptible to bar formation. It is also important to consider whether our results could be explained in terms of the evolution and destruction of bars rather than their initial formation. The scenario in which bars can be dissolved by the presence of a massive central concentration have been proposed in several simulations. However, most of them indicate that present-day supermassive black holes, star clusters or inner parts of bulges are not massive enough to affect bars significantly (e.g., Shen & Sellwood, 2004; Athanassoula et al., 2005). On the other hand, if bars are hard to be dissolved once they are formed, the presence of a high density environment such as a cluster should not change dramatically the bar fraction, as we found in this work when comparing with the field.
Since our sample galaxies cover both the center and infall regions of the Coma cluster, we have further tested this issue by dividing our sample into internal and external galaxies and calculating the bar fraction for every subsample. As we are introducing large errors due to small number statistics (especially in the outer regions), we have repeated this procedure for three values of the separation distance (0.5, 1, and 1.5 Mpc) from the cluster center (: 12h 59m 42s, : 27∘ 58 156, Godwin et al. 1983). For the smaller separation distance we found 14% and 15% of bars for the internal and external subsamples, respectively. The bar fractions of both subsamples are 14% and 17% when using 1 Mpc, and 14% and 17% if we use 1.5 Mpc. Therefore we did not find differences in the bar fraction between the subsamples for any separation distance, implying again that the cluster environment plays a second order role in bar formation/evolution.
In the low luminosity/mass side of the bar fraction distribution we found also a lack of bars for galaxies with either M or . Few works have tried to investigate the dwarf realm in order to look for the presence of bars. Graham et al. (2003) found spiral structure in two dwarf galaxies belonging to the Coma cluster. The galaxies magnitudes were found to be -18.8 and -17.4 in the -band, therefore being in agreement with our results. Lisker et al. (2006), studying a sample of dwarf galaxies in the Virgo cluster, found the presence of bar structure in some dwarf galaxies as faint as M, again in full agreement with our findings considering a typical color . They also claim that dwarf ellipticals with and without disks represent two distinct types of galaxies, and show how the fraction of dwarfs with disk decrease dramatically for galaxies below M. Therefore, even if the non presence of bars in our low luminosity galaxies could be due to the heating of the disk component or to its absence, our results support that of Lisker et al. (2006) and we suggest that no disks are present in Coma galaxies below M.
The physical mechanisms involved in this case could be different with respect to that of massive galaxies. The role played by the environment in the evolution of dwarfs is crucial. For instance, repeated tidal shocks suffered by a dwarf satellite galaxy can also remove the kinematic disk signature (Mayer et al., 2001). Cumulative tidal fast encounters between galaxies and with the gravitational potential of the galaxy cluster can produce a dramatic morphological transformation from spirals to roundish dwarf galaxies (Moore et al., 1996; Mastropietro et al., 2005; Aguerri & González-García, 2009).
We are still far from understanding the mechanisms that drive one galaxy to host a bar while another apparently similar does not. Even if a great advance has been done in the last years, we still need to explore the bunch of observational data already available in order to provide more inputs to numerical simulations to understand the formation and evolutionary processes of these important structures at the center of galaxies.
References
- Adelman-McCarthy et al. (2008) Adelman-McCarthy, J. K., et al. 2008, ApJS, 175, 297
- Aguerri et al. (1998) Aguerri, J. A. L., Beckman, J. E., & Prieto, M. 1998, AJ, 116, 2136
- Aguerri et al. (2000) Aguerri, J. A. L., Muñoz-Tuñón, C., Varela, A. M., & Prieto, M. 2000, A&A, 361, 841
- Aguerri et al. (2009) Aguerri, J. A. L., Méndez-Abreu, J., & Corsini, E. M. 2009, A&A, 495, 491
- Aguerri & González-García (2009) Aguerri, J. A. L., & González-García, A. C. 2009, A&A, 494, 891
- Athanassoula (2003) Athanassoula, E. 2003, MNRAS, 341, 1179
- Athanassoula et al. (2005) Athanassoula, E., Lambert, J. C., & Dehnen, W. 2005, MNRAS, 363, 496
- Barazza et al. (2008) Barazza, F. D., Jogee, S., & Marinova, I. 2008, ApJ, 675, 1194
- Bell et al. (2003) Bell, E. F., McIntosh, D. H., Katz, N., & Weinberg, M. D. 2003, ApJS, 149, 289
- Binggeli et al. (1988) Binggeli, B., Sandage, A., & Tammann, G. A. 1988, ARA&A, 26, 509
- Bureau & Freeman (1999) Bureau, M., & Freeman, K. C. 1999, AJ, 118, 126
- Buta et al. (2003) Buta, R., Block, D. L., & Knapen, J. H. 2003, AJ, 126, 1148
- Carter et al. (2008) Carter, D., et al. 2008, ApJS, 176, 424
- Cattaneo et al. (2006) Cattaneo, A., Dekel, A., Devriendt, J., Guiderdoni, B., & Blaizot, J. 2006, MNRAS, 370, 1651
- Colless & Dunn (1996) Colless, M., & Dunn, A. M. 1996, ApJ, 458, 435
- Corsini et al. (2003) Corsini, E. M., Debattista, V. P., & Aguerri, J. A. L. 2003, ApJ, 599, L29
- Debattista & Sellwood (1998) Debattista, V. P., & Sellwood, J. A. 1998, ApJ, 493, L5
- Debattista & Sellwood (2000) Debattista, V. P., & Sellwood, J. A. 2000, ApJ, 543, 704
- Debattista & Shen (2007) Debattista, V. P., & Shen, J. 2007, ApJ, 654, L127
- Dekel & Birnboim (2006) Dekel, A., & Birnboim, Y. 2006, MNRAS, 368, 2
- de Vaucouleurs et al. (1991) de Vaucouleurs, G., de Vaucouleurs, A., Corwin, H. G. Jr., Buta, R. J., Paturel, G., & Fouquè, P. 1991, Third Reference Catalogue of Bright Galaxies (Berlin: Springer-Verlag)
- Elmegreen & Elmegreen (1985) Elmegreen, B. G., & Elmegreen, D. M. 1985, ApJ, 288, 438
- Erwin (2004) Erwin, P. 2004, A&A, 415, 941
- Godwin et al. (1983) Godwin, J. G., Metcalfe, N., & Peach, J. V. 1983, MNRAS, 202, 113
- Graham et al. (2003) Graham, A. W., Jerjen, H., & Guzmán, R. 2003, AJ, 126, 1787
- Hohl (1971) Hohl, F. 1971, ApJ, 168, 343
- Kormendy & Kennicutt (2004) Kormendy, J., & Kennicutt, R. C., Jr. 2004, ARA&A, 42, 603
- Laurikainen et al. (2004) Laurikainen, E., Salo, H., & Buta, R. 2004, ApJ, 607, 103
- Laurikainen et al. (2005) Laurikainen, E., Salo, H., & Buta, R. 2005, MNRAS, 362, 1319
- Lisker et al. (2006) Lisker, T., Grebel, E. K., & Binggeli, B. 2006, AJ, 132, 497
- Marinova & Jogee (2007) Marinova, I., & Jogee, S. 2007, ApJ, 659, 1176
- Marinova et al. (2009) Marinova, I., et al. 2009, ApJ, 698, 1639
- Martinez-Valpuesta et al. (2006) Martinez-Valpuesta, I., Shlosman, I., & Heller, C. 2006, ApJ, 637, 214
- Mastropietro et al. (2005) Mastropietro, C., Moore, B., Mayer, L., Debattista, V. P., Piffaretti, R., & Stadel, J. 2005, MNRAS, 364, 607
- Mayer et al. (2001) Mayer, L., Governato, F., Colpi, M., Moore, B., Quinn, T., Wadsley, J., Stadel, J., & Lake, G. 2001, ApJ, 559, 754
- Méndez-Abreu et al. (2008) Méndez-Abreu, J., Corsini, E. M., Debattista, V. P., De Rijcke, S., Aguerri, J. A. L., & Pizzella, A. 2008, ApJ, 679, L73
- Menéndez-Delmestre et al. (2007) Menéndez-Delmestre, K., Sheth, K., Schinnerer, E., Jarrett, T. H., & Scoville, N. Z. 2007, ApJ, 657, 790
- Michard & Andreon (2008) Michard, R., & Andreon, S. 2008, A&A, 490, 923
- Moore et al. (1996) Moore, B., Katz, N., Lake, G., Dressler, A., & Oemler, A. 1996, Nature, 379, 613
- Muñoz-Tuñón et al. (2004) Muñoz-Tuñón, C., Caon, N., & Aguerri, J. A. L. 2004, AJ, 127, 58
- Noguchi (1987) Noguchi, M. 1987, MNRAS, 228, 635
- Ohta et al. (1990) Ohta, K., Hamabe, M., & Wakamatsu, K.-I. 1990, ApJ, 357, 71
- Ostriker & Peebles (1973) Ostriker, J. P., & Peebles, P. J. E. 1973, ApJ, 186, 467
- Sellwood & Debattista (2006) Sellwood, J. A., & Debattista, V. P. 2006, ApJ, 639, 868
- Shen & Sellwood (2004) Shen, J., & Sellwood, J. A. 2004, ApJ, 604, 614
- Sheth et al. (2005) Sheth, K., Vogel, S. N., Regan, M. W., Thornley, M. D., & Teuben, P. J. 2005, ApJ, 632, 217
- Sheth et al. (2008) Sheth, K., et al. 2008, ApJ, 675, 1141
- Shlosman et al. (2000) Shlosman, I., Peletier, R. F., & Knapen, J. H. 2000, ApJ, 535, L83
- Weinzirl et al. (2009) Weinzirl, T., Jogee, S., Khochfar, S., Burkert, A., & Kormendy, J. 2009, ApJ, 696, 411