Individual focus and knowledge contribution
Lada A. Adamic1,∗, Xiao Wei1, Jiang Yang1, Sean Gerrish2, Kevin K. Nam1, Gavin S. Clarkson3
1 School of Information, University of Michigan, Ann Arbor, MI, USA
2 Dept. of Computer Science, Princeton, NJ, USA
3 University of Houston Law Center, Houston, TX, USA
E-mail: ladamic@umich.edu
Abstract
Before contributing new knowledge, individuals must attain requisite background knowledge or skills through schooling, training, practice, and experience. Given limited time, individuals often choose either to focus on few areas, where they build deep expertise, or to delve less deeply and distribute their attention and efforts across several areas. In this paper we measure the relationship between the narrowness of focus and the quality of contribution across a range of both traditional and recent knowledge sharing media, including scholarly articles, patents, Wikipedia, and online question and answer forums. Across all systems, we observe a small but significant positive correlation between focus and quality.
Introduction
Prior to making novel or useful contributions to scholarly work, an individual must acquire pertinent knowledge. Since acquisition of such knowledge often involves time-consuming study or extensive experience, most individuals tend to build their expertise in a small range of fields; and experiencing success in one subject area may, through positive reinforcement and the ability to obtain more resources, result in additional focus on that subject. On the other hand, there are myriad successful individuals who dabble in many sciences, inventors who invent diverse gadgets, and Wikipedia editors who edit pages on seemingly disparate topics. One might argue that their versatility is a reflection of superior abilities that can yield greater opportunities for varied collaborations and cross-polination of ideas. In this paper, we present the first comprehensive, large-scale analysis of this relationship between individual focus and performance across a broad range of both traditional and modern knowledge collections.
Much previous research in this area has aimed to quantify the benefit of interdisciplinarity among researchers at the group level. A study of scholarly articles in the UK, for example, found that research articles whose coauthors are in different departments at the same university receive more citations than those authored in a single department, and those authored by individuals across different universities yield even more citations on average [1]. Multi-university collaborations that include a top tier-university were found to produce the highest-impact research articles [2]. It has also been demonstrated that scholarly work covering a range of fields – and patents generated by larger teams of coauthors–tend to have greater impact over time [3]. Collaborations between experienced researchers who have not previously collaborated fare better than repeat collaborations [4]. In the area of nanotechnology authors who have a diverse set of collaborators tend to write articles that have higher impact [5]. Finally, diverse groups can, depending on the type of task, outperform individual experts or even groups of experts [6].
All of this work is evidence of a benefit in bringing together diverse individuals. It does not demonstrate, however, whether diversity in research focus is beneficial at the individual level. One exception is a study of political forecasting that established that “foxes”, individuals who know many little things, tend to make better predictions about future outcomes than “hedgehogs” who focus on one big thing [7]. Our work addresses knowledge contribution in a much broader context than forecasting and, more importantly, quantifies the relationship between individuals’ narrowness of focus and the corresponding quality of their contributions.
Results
In order to cover a broad range of knowledge-generating activities, we study several collections of traditional scholarly publications in addition to recent, Web-based media collections. The traditional media we consider include patents and research articles. Our patent collection consists of 5.5 million patents filed with the USPTO between 1976 and 2006. We consider two sources of research articles: JSTOR and the American Physical Society (APS). The JSTOR corpus consists of 2 million articles from 1108 journals in the natural sciences, social sciences, and humanities, and the APS dataset we consider covers over 200,000 research articles in the single discipline of physics. We complement data from these traditional publication venues with data from two recent, online types of knowledge-sharing activity: Wikipedia and a collection of question-answering forums. Wikipedia is a collaborative online effort to document all of human knowledge in a systematic way into a popular internet-based encyclopedia. The Question and Answer forums we study are Yahoo Answers (English) [8]; Baidu Knows (Chinese) [9]; and Naver Knowledge iN (Korean) [10]. On each of the sites, millions of questions are answered each month by individuals with a wide range of expertise.
Online knowledge-sharing activity includes not just those who specialize in knowledge generation and dissemination, i.e. professional researchers and scholars, but also others who gained their expertise through study and experience. In addition to providing data on different types of individuals, these datasets represent knowledge generation at different scales. Authoring a research article or patent in most cases involves weeks to years of research, culminating in a significant new result worthy of publication. In contrast, contributing a fact to Wikipedia or answering a question posed in an online forum may involve little more than a simple recall of previously attained knowledge – and a few minutes of the contributor’s time.
In evaluating focus across such a broad range of activities, we aimed to use a metric that captures three qualities: variety, or how many different areas an individual contributes to; balance, or how evenly their efforts are distributed among these areas; and similarity, or how related those areas are [5]. We use the Stirling measure , which captures all three aspects [11]:
where is the proportion of the individual’s contributions in category and is a measure of similarity between categories and , inferred from the number of joint contributors between two categories and . This metric assigns a narrower (higher) focus value to an individual who contributes to fewer, related areas than to someone who contributes in many unrelated areas.
The categories across which focus is measured differ by the type of knowledge-sharing medium. An inventor’s proportion of contributions in subject is proportional to the number of times the class is assigned by the inventor or patent examiner to the inventor’s patents. Articles in the APS dataset are classified according to the Physics and Astronomy Classification Scheme. For JSTOR articles, in the absence of a pre-defined category structure, we used unsupervised topic models on the full text of authors’ research articles [12]. Wikipedia articles are situated within Wikipedia’s category hierarchy, while answers provided in Q&A forums are sorted according to the hierarchy of categories of the corresponding questions.
For each dataset, we sought a relevant, objective measure of quality of a contribution and evaluated it in the context of its peers. For research articles, we measured each article’s citation count relative to those of other articles in the same discipline and year [13]. Likewise, patents’ citation counts were compared with those of other patents in the same patent classes and years. In doing this, we control for discipline-specific factors that can impact a publication’s citation count such as publication cycle length and number of publications in the discipline [14, 15]. For Wikipedia contributions, we consider the percentage of words an author newly introduces to an article that survive subsequent revisions [16]. Finally, for Q&A forums, we rely on the asker’s rating of answers: a good contributor should have their answer selected as best more often than expected by chance.
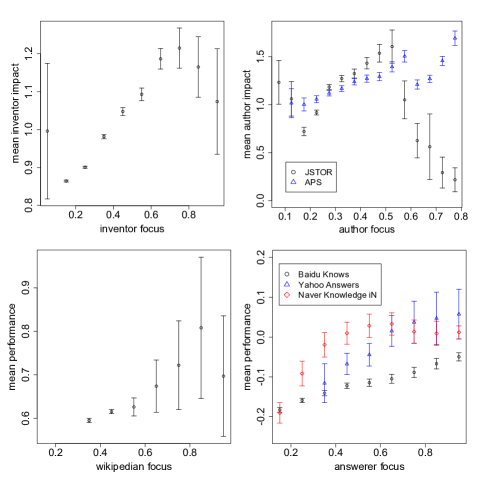
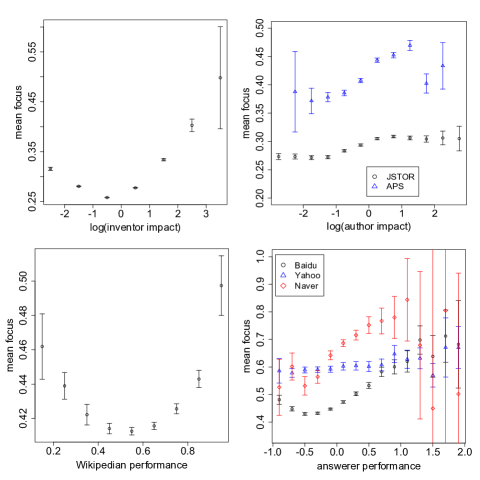
Using these measures of focus and quality, we find that focus is weakly yet consistently positively correlated with quality across all types of knowledge contribution systems, as summarized in Table 1. The relationship between focus and quality is detailed further in Figure 1, which shows the variation in average quality for individuals grouped by their levels of focus. As focus increases, so does average quality; but the trend levels off or even reverses for extremely focused individuals. This is clarified by plotting average focus at a given level of quality (see Figure 2). While high-quality contributors are more narrowly focused than others on average, very poor contributors sometimes also dwell in a single area. In Q&A forums, we find further that narrowly focused users with poor track records of giving best answers tend to give answers that are significantly shorter than those of other users.
| type | (log(quantity),focus) | (log(quantity),quality) | (focus,quality) |
|---|---|---|---|
| Research articles JSTOR | -0.055 | 0.058 | 0.112 |
| Research articles APS | 0.302 | 0.130 | 0.173 |
| Patents | 0.286 | 0.100 | 0.094 |
| Wikipedia | -0.274 | 0.133 | 0.084 |
| Yahoo Answers | 0.150 | 0.116 | 0.084 |
| Baidu Knows | 0.095 | 0.083 | 0.111 |
| Naver KnowledgeIn | 0.066 | 0.102 | 0.169 |
We note that these datasets provide incomplete views of contributors’ activity. JSTOR archives over a thousand journals, but does not include many more. Inventors’ patents prior to 1976 are not captured in our data. Likewise, we parsed only a subset of the Wikipedia revision history; and while our Yahoo Answers data set spanned the complete activity of a sample of users, our Baidu and Naver data sets covered only several months each (see supplementary materials).
Nevertheless, we believe our results to be robust. We expect that we would find equally strong or stronger correlation between focus and quality, if we had complete records of each individual’s contributions. An indication of this is that the correlations between focus and quality strengthen for users for whom we observe a higher number of contributions. For example, the correlation between focus and impact for inventors with 10-20 patents is just , but for inventors with 50 to 100 patents it increases to . Similarly, Wikipedia users editing between 10 and 20 pages display a correlation of , while those editing between 50 and 100 pages display a correlation of .
We find our results to be robust in several other respects as well. Aside from being consistent across a wide range of media and performance metrics, our results hold when focus is measured at different levels of granularity, e.g. when using top-level patent, Wikipedia, and Q&A categories as opposed to subcategories in those data sets, and when we construct 250 as opposed to 100 topics in the JSTOR dataset. While the distribution of focus shifts downward as we increase the granularity, the correlations between focus and other variables remain qualitatively similar.
| type | (log(quantity),quality) | (focus,quality) |
|---|---|---|
| research articles JSTOR | 0.051 | 0.095 |
| research articles APS | 0.059 | 0.036 |
| patents | 0.059 | 0.073 |
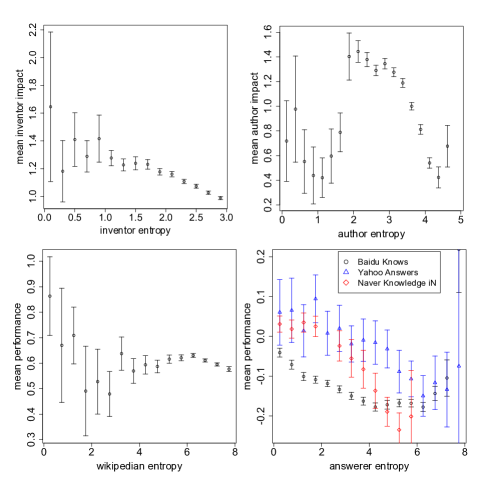
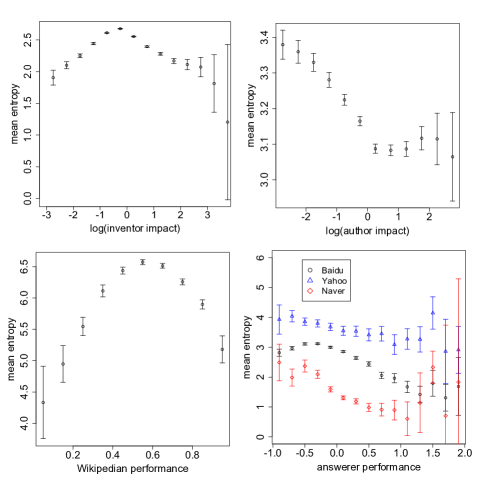
We also find our results to be consistent, though weaker for the paper and patent data sets, when self-citations, i.e. citations between two papers that share an author with the same last name, are removed. Table 2 summarizes these findings. Self-citations may inflate the impact of prolific and focused authors who have greater opportunity and justification to cite their own work. We also find consistent results using alternative focus measures such as Shannon Entropy, . Entropy captures the balance and variety of contribution, but not similarity, and is negatively correlated with focus. We find the results to be qualitatively consistent to those obtained using the Stirling measure. Table 3 and Figures 3 and 4 correspond to Table 1 and Figures 1 and 2 respectively, but present results using contributor entropy rather than focus.
| data set | (entropy,focus) | (log(quantity),entropy) | (entropy,quality) |
|---|---|---|---|
| research articles JSTOR | -0.606 | 0.082 | -0.218 |
| research articles APS | -0.601 | 0.083 | -0.116 |
| patents | -0.848 | 0.160 | -0.117 |
| Wikipedia | -0.755 | 0.629 | -0.103 |
| Yahoo Answers | -0.878 | -0.081 | -0.121 |
| Baidu Knows | -0.918 | -0.034 | -0.108 |
| Naver KnowledgeIn | -0.946 | -0.175 | -0.223 |
One remaining concern is that focus and quality are both correlated with a third variable that holds greater explanatory power. One such potential variable is that of quantity. Quantity itself is positively correlated with quality, revealing a possible link between contributor success and motivation or resources. However, focus remains a significant factor in the quality of contributions, even once quantity is accounted for (see Table 4). We also note that quantity’s correlation with focus varies by medium studied, as shown in Table 1. The correlation is positive for patents and Q&A forums, but negative for research and Wikipedia articles. Individuals generating many patents or answers tend to focus their contributions more narrowly, but authors who write a greater number of research and Wikipedia articles tend to make broader contributions.
| variable | JSTOR | APS | patents | Wikipedia | YA | Baidu | Naver |
|---|---|---|---|---|---|---|---|
| focus | 1.899∗∗∗ | 0.553∗∗∗ | 0.501∗∗∗ | 0.353∗∗∗ | 0.245∗∗∗ | 0.143∗∗∗ | 0.146∗∗∗ |
| (0.085) | (0.040) | (0.009) | (0.033) | (0.046) | (0.005) | (0.015) | |
| log(quantity) | 0.177∗∗∗ | 0.124∗∗∗ | 0.163∗∗∗ | 0.046∗∗∗ | 0.052∗∗∗ | 0.039∗∗∗ | |
| (0.014) | (0.008) | (0.003) | (0.002) | (0.005) | (0.002) | (0.008) | |
| 0.017 | 0.025 | 0.015 | 0.023 | 0.022 | 0.023 | 0.022 |
Finally we examine whether individuals narrow or broaden their focus over time. For JSTOR research articles, patents, and Q&A forums, a majority of contributors narrow their focus over time (see Table 5). Wikipedia contributors and physicists, on the other hand, do not appear to specialize further. In addition to a change in focus, we also observe a slight change in quality. Across most datasets, contributors tend to improve the quality over time; exceptions include Baidu Knows, where the change in answer quality is not significant, and JSTOR, where there is a statistically significant decline in contribution quality. One might speculate that a researcher’s early success permits him or her to continue producing publications, but that the quality of those publications may fall due to factors such as moving from a primary contributor to a project management role.
| data set | % who increased focus | av. change focus | av. change quality |
|---|---|---|---|
| research articles JSTOR | 62.0% | 0.024 | -0.394 |
| research articles APS | 44.0% | -0.012 | -0.157 |
| patents | 79.5% | 0.139 | 0.080 |
| Wikipedia | 49.5% | not. sig. | 0.066 |
| Yahoo Answers | 69.8% | 0.056 | 0.056 |
| Baidu Knows | 61.4% | 0.040 | not. sig. |
| Naver KnowledgeIn | 68.8% | 0.023 | 0.034 |
Discussion
In conclusion, we have quantified the value an individual’s focus in contributing knowledge through different media and across a wide range of fields. Consistently we observe a slight but significant correlation between an individual’s degree of focus and this individual’s quality of contribution. The relationship persists even when quantity of contributions is taken into account.
How should individuals invest their time? While our results do not demonstrate causality, the overall trend appears to favor those who do a few things and do them well. However, individuals who focus in a very narrow field tend to contribute work that is on average less-well recognized than that of their slightly less focused peers.
This work immediately suggests several areas for future research. It would be useful to understand the benefit of narrowing one’s focus in the context of the research field and media type, in addition to the quality and diversity of one’s prior efforts. One could also examine whether highly focused authors of research articles or patents may be introducing marginal or incremental contributions.
In addition, while these results have shed light on the value of focus in the context of the individual, they say nothing about focus in the context of a group. After all, several studies have demonstrated the value of interdisciplinary collaborations in the sciences, and we believe that large-scale online knowledge sharing systems such as those discussed are successful precisely because they bring together individuals of different backgrounds. This leaves open the question of whether interdisciplinary collaborations between more focused–yet collectively diverse–individuals are more fruitful.
Materials and Methods
Table 6 summarizes the seven data sets we used to study focus and contribution. For each dataset we selected a threshold criterion for the minimum level of activity needed for an individual to be included.
| dataset | time span | # individuals | threshold # contributions |
|---|---|---|---|
| JSTOR | 1668-2006 | 37,031 | 10 articles |
| APS | 1977-2006 | 22,351 | 10 articles |
| patents | 1976-2006 | 604,113 | 10 patents |
| Wikipedia | 2001-2006 | 7,129 | 40 edits |
| Yahoo Answers | 08/05-03/09 | 5,256 | 40 answers |
| Baidu Knows | 12/07-05/08 | 65,854 | 40 answers |
| Naver KnowledgeIn | 12/08-02/09 | 5,918 | 40 answers |
Research articles. A snapshot of JSTOR data includes 2.0 million research articles with 6.6 million citations between them. JSTOR spans over a century of publications in the natural and social sciences, the arts, and humanities. For this data set, we needed to address name ambiguity. For example there were 26,000 instances where a person with the last name of Smith authored an article and 728 unique combinations of initials appearing alongside “Smith”. Identifying two different individuals as being one and the same would tend to introduce data points with low focus and an inflated number of articles. Since both variables are related to quality, we sought to exclude such instances. We excluded authors with , where is the number of first names or initials the inventor’s last name occurs with in the data set, and is the number of last names the inventor’s first name occurs with. We also collapsed matching names and initials if there was only one matching first name/inital pair and the last name occurred with fewer than 50 first names. This left us with 37,031 authors with 10 or more publications, for whom we were reasonably sure that they were uniquely identified.
Using Latent Dirichlet Allocation [12], we generate 100 topics over the entire corpus of research articles. Each document was assigned a normalized score for each of the 100 topics, and the pairwise topic similarity matrix was computed from cosines of vector values across documents. An author’s distribution across topics was computed by averaging the topic vectors of all of the articles they authored. For robustness, we repeated the analysis with 250 topics instead of 100, and found quantitatively similar correlation between focus and quality, although focus scores were lower due to the finer granularity. The quality of an article is measured as the number of times the article is cited, divided by the number of times other articles in the same area and year are cited. Citations originate within the dataset. By normalizing quality by area, we mitigate the possible biases introduced by some areas being better represented in the dataset than others.
Our database of American Physical Society publications included Physical Review Letters, and Physical Review A-E journal articles. We excluded Reviews of Modern Physics as we were considering the impact of original research rather than review articles. The data set contained 396,134 articles published between 1893 and 2006, with 3,112,706 citations between them. For our purposes, we were limited to the 261,161 articles with PACS (Physics and Astronomy Classification Scheme) codes associated with articles published after 1977. The PACS hierarchy has 5 levels, and we performed our analysis at the level of the 76 main categories, such as 42 (Optics) and the 859 2nd level categories, e.g. 42.50 (Quantum Optics).
Patents. The patent data set contains all 5,529,055 patents filed between 1976 and 2006, in 468 top level categories. We construct a similarity matrix for the 468 categories, reflecting the frequency with which inventors in one category also file patents in another. There are 3,643,520 patents citing 2,382,334 others, for a total of 44,556,087 citations. We excluded inventors with . This makes it unlikely that we would identify two separate individuals as being one. We measure an inventor’s impact according to a citation count normalized by the average number of citations for other patents in the same year and categories as those filed by the inventor.
Q&A forums: We obtained snapshots of activity on Q&A forums with uniquely identified users posting answers to questions in distinct categories. We perform our analysis at the subcategory level, which gives us enough resolution to differentiate the question topics, while supplying a sufficient number of observations in each subcategory. We use best answers as a proxy for answer quality. The best answer is selected by the user who posed the question. If this user does not select a best answer, it may be selected via a vote by other users. The quality metric we used was the score, which compares the number of answers the user gives that were selected as best among others, relative to the expected number of best answers. The expected number depends on the number of other answers provided to each question. (observed - . the expected number of best answers is simply given by , where is the total number of users answering question .
Wikipedia: Our Wikipedia dataset is a meta-history dump file of the English Wikipedia generated on Nov. 4th, 2006. The dump file has the entire revision history of about 1.5 million encyclopedia pages, of which we parsed 100,000, or about 7%. In order to verify that our sample is unbiased with respect to topic distribution, we compare the category and subcategory distributions of our sample to that of a larger corpus of 1 million pages. The two distributions have a nearly perfect correlation ().
Articles are a product of varying number of revisions, from several to 10,000 for single article. Revisions are contributed by either registered or anonymous users. Since anonymous users’ revision histories are non-traceable, we only consider registered users whose unique user names are associated with at least 40 revisions. We excluded Wikipedia administrators from our study because they may perform a primarily editorial role. In like manner, to better filter the noise of measuring the quality of words by the final version of articles, we only choose pages in which ewer than 5% of the revisions occurred in the 30 days prior to the data dump.
A Wikipedia contributor’s focus and entropy were calculated from the second-level categories of the pages they edit. Each Wikipedia article belongs to one or more categories. We truncated each hierarchical category to one of the roughly 500 second-level categories.
The quality of a contribution is measured in terms of , the number of new words added by a user to Wikipedia articles, such that the words were not present in any previous revisions of those articles. We found a high correlation between the number of new words that survive 5 revisions, and the number that survive to the last revision of the article (), consistent with previous analyses of edit persistence [17]. We therefore constructed a simple metric by taking the proportion of new words introduced by the user that are retained in the last version of a sufficiently frequently edited article: [16].
Acknowledgments
We thank IBM for providing the patent data, and JSTOR, APS, and Katy Borner for providing the article citation data. We would also like to thank Michael McQuaid, Jure Leskovec, Scott Page and Eytan Adar for helpful comments. This research was supported by MURI award FA9550-08-1-0265 from the Air Force Office of Scientific Research and NSF award IIS 0855352.
References
- 1. Katz J, Hicks D (1997) How much is a collaboration worth? A calibrated bibliometric model. Scientometrics 40:541–554.
- 2. Jones B, Wuchty S, Uzzi B (2008) Multi-University Research Teams: Shifting Impact, Geography, and Stratification in Science. Science 322:1259.
- 3. Wuchty S, Jones B, Uzzi B (2007) The Increasing Dominance of Teams in Production of Knowledge. Science 316:1036.
- 4. Guimera R, Uzzi B, Spiro J, Amaral L (2005) Team Assembly Mechanisms Determine Collaboration Network Structure and Team Performance. Science 308:697–702.
- 5. Rafols I, Meyer M (2008) Diversity and network coherence as indicators of interdisciplinarity: Case studies in bionanoscience. Scientometrics .
- 6. Page S (2007) The difference: How the power of diversity creates better groups, firms, schools, and societies (Princeton University Press).
- 7. Tetlock P (2005) Expert political judgment: how good is it? how can we know? (Princeton University Press).
- 8. Adamic LA, Zhang J, Bakshy E, Ackerman MS (2008) Knowledge Sharing and Yahoo Answers: Everyone Knows Something. In WWW ’08, pp. 665–674.
- 9. Yang J, Wei X (2009) Seeking and Offering Expertise across Categories: A Sustainable Mechanism Works for Baidu Knows. In ICWSM ’09.
- 10. Nam KK, Ackerman MS, Adamic LA (2009) Questions in, Knowledge iN? A Study of Naver’s Question Answering Community. In CHI ’09.
- 11. Stirling A (2007) A general framework for analysing diversity in science, technology and society. Journal of the Royal Society Interface 4:707–719.
- 12. Blei D, Ng A, Jordan M (2003) Latent dirichlet allocation. The Journal of Machine Learning Research 3:993–1022.
- 13. Valderas; JM, et al. (2007) Why Do Team-Authored Papers Get Cited More? Science 317:1496b–1498.
- 14. Stringer M, Sales-Pardo M, Amaral L (2008) Effectiveness of journal ranking schemes as a tool for locating information. PLoS ONE 3.
- 15. Seglen P (1997) Why the impact factor of journals should not be used for evaluating research. British medical journal 314:497.
- 16. Adler B, de Alfaro L (2007) A content-driven reputation system for the Wikipedia. In Proc. of the 16th Intl. World Wide Web Conf.(WWW 2007).
- 17. Panciera K, Halfaker A, Terveen L (2009) Wikipedians Are Born, Not Made: A Study of Power Editors on Wikipedia. In GROUP ’08.