HI-selected Galaxies as a probe of Quasar Absorption Systems
Abstract
We investigate the properties of HI-rich galaxies detected in blind radio surveys within the hierarchical structure formation scenario using a semi-analytic model of galaxy formation. By drawing a detailed comparison between the properties of HI-selected galaxies and HI absorption systems, we argue a link between the local galaxy population and quasar absorption systems, particularly for damped Ly absorption (DLA) systems and sub-DLA systems. First, we evaluate how many HI-selected galaxies exhibit HI column densities as high as those of DLA systems. We find that HI-selected galaxies with HI masses have gaseous disks that produce HI column densities comparable to those of DLA systems. We conclude that DLA galaxies where the HI column densities are as high as those of DLA systems, contribute significantly to the population of HI-selected galaxies at . Second, we find that star formation rates (SFRs) correlate tightly with HI masses () rather than - (and -) band luminosities: , for .
In the low-mass range , sub-DLA galaxies replace DLA galaxies as the dominant population. The number fraction of sub-DLA galaxies relative to galaxies reaches for and for . The HI-selected galaxies at are a strong probe of sub-DLA systems that place stringent constraints on galaxy formation and evolution.
Subject headings:
galaxies :evolution - galaxies: formation - quasars : absorption lines -radio lines: galaxies1. Introduction
The absorption-line systems found in quasar/gamma-ray burst spectra, the so-called ”quasar absorption systems”, provide us with a unique probe of galaxy formation and evolution processes. The systems offer valuable opportunities to explore the physical and chemical properties of inter-galactic media and/or intervening galaxies (e.g., the amount of neutral gas and metals, the gas dynamics). In particular, because the absorption feature provides basic information about hydrogen gas which is a main component of galactic gas, HI absorption systems have been studied extensively as means of placing stringent constraints on galaxy formation and evolution.
Recently, radio surveys have provided large samples of HI-selected galaxies and significantly improved our understanding of galaxy evolution. The HI-selected galaxies have been explored in blind surveys of the HI emissions, for example, the Slice Survey (SS; e.g., Spitzak & Schneider 1998), the Arecibo Dual-Beam Survey(ADBS; e.g., Rosenberg & Schneider 2000), the HI Parkes All Sky Survey (HIPASS; e.g., Zwaan et al. 2003; Meyer et al. 2004), the HIDEEP survey (HIDEEP; e.g., Minchin et al. 2003), the HI Nearby Galaxy Survey (THINGS; Walter et al. 2008), and the Arecibo Legacy Fast ALFA survey (ALFALFA; e.g., Giovanelli et al. 2005). These surveys result in an accurate measurement of the basic properties of galactic HI-gas (e.g., the HI mass function, HIMF). When the HI-selected galaxies exist on a line of sight to quasar/gamma-ray burst, the HI-selected galaxies can be HI-absorption systems due to having the HI column densities as high as those of HI absorption systems. In this paper, using a model of galaxy formation, we aim to reveal the basic properties of HI absorption systems by focusing on HI-selected galaxies in blind radio surveys.
Among the HI absorption systems, damped Lyman absorption (DLA) systems have been studied because the high HI column densities ( cm-2) are considered to be a good probe of an early stage of star formation processes. The origin of DLA systems has been argued on the basis of the observational properties. It has been considered as, for example, rapidly rotating gaseous disks of massive spiral galaxies (e.g., Wolfe et al. 1986), gas-rich dwarf galaxies (e.g., York et al. 1986), and so on.
Theoretical studies, utilizing numerical simulations and semi-analytic models, have been tackled to revealing the nature of DLA systems and a relationship to galaxy population (e.g. Katz et al., 1996; Kauffmann, 1996; Haehnelt et al., 1998; Gardner et al., 2001; Maller et al., 2001; Okoshi et al., 2004; Okoshi & Nagashima, 2005; Nagamine et al., 2004, 2007; Johansson & Efstathiou, 2006; Razoumov et al., 2006, 2008; Pontzen et al., 2008; Barnes & Haehnelt, 2009; Tescari et al., 2009). Although the studies reproduce many properties of DLA systems, definite conclusion has not been reached yet. For example, at high redshifts (), DLA systems have high number densities per unit redshift (the incidence rate) and large velocity widths of the absorption lines. Using models under an assumption that DLA systems arise mainly in galactic disks of virialized halos, the high number densities require large number of less massive galaxies. However, the predicted velocity widths of absorption lines produced by less massive systems appear to be smaller than the typical values of observed ones (Prochaska & Wolfe, 1997). This suggests that the high number densities are also attributed to large cross sections of the other population, for example, extended gas that resides within/outside virial radii of halos, outflow gas due to supernova explosions, tidal gas related to galaxy interactions, and so on. At high redshifts, the mixed population, in addition to compact disks, may give rise to damped Lyman absorption lines.
There are the dedicated attempts to detect the host galaxies of DLA systems by optically deep-imaging observations (e.g., Steidel et al. 1994, 1997; Le Brun et al. 1997; Rao & Turnshek 1998, 2000; Turnshek et al. 2001; Bouch et al. 2001; Bowen, Tripp & Jenkins 2001; Warren et al. 2001; Mller et al. 2002, 2004; Fynbo et al. 2003; Rao et al. 2003; Chen & Lanzetta 2003; Lacy et al. 2003; Schulte-Ladbeck et al. 2004; Chun et al. 2006; Gharanfoli et al. 2007). A few cases of successful identifications suggest that the host galaxies of DLA systems present mixed morphological types of galaxies. However, in many cases, it is a challenging task to identify the host galaxies in the emission of the optical surveys, because many host galaxies are very faint and/or very compact.
At low redshifts (), it is expected that more DLA hosts can be identified even in the case when their luminosities are low. In the observation, for example, Rao et al. (2003) have compiled data for host galaxies at low redshifts (). However, their sample size is still small (). They argued that the sample is dominated by galaxies with low-luminosities and small impact parameters. Okoshi & Nagashima (2005) have theoretically investigated galaxies having HI column densities as high as those of DLA systems (hereafter, DLA galaxies) at low redshifts using a semi-analytic galaxy formation model. We concluded that DLA galaxies consist primarily of low luminosity galaxies with small sizes (typical radius kpc, surface brightness in the -band to mag arcsec-2). This result is consistent with the observations that, at low redshifts, DLA systems arise primarily in galactic disks rather than tidal gas caused by galaxy interactions or gas driven by galactic winds. Moreover, in our conclusion, (1) DLA galaxies have typical star formation rates (SFRs) yr-1 and (2) that the difficulty in identifying DLA galaxies is due not only to their faintness but also to a masking effect which occurs when the point spread function (PSF) of the respective background quasars masks the DLA galaxies. We suggest that of DLA galaxies suffer from this masking effect. Thus, DLA galaxies in the local universe significantly should consist of the optically-faint and compact systems that require another approach to host galaxy detection in observations.
To understand DLA systems, it is useful to investigate HI-selected galaxies detected in radio surveys because they contain a large amount of neutral gas that potentially gives rise to strong absorption lines when bright emission sources exist behind them. The ADBS, HIPASS, and THINGS provide significantly large samples for DLA galaxies compared to those of the optical counterparts of DLA systems identified in the optical and near-infrared images at (e.g. Rao et al., 2003). The large radio samples show interesting properties (e.g., HI cross-section and HI mass ) of DLA galaxies (e.g. Rao & Briggs, 1993; Rosenberg & Schneider, 2003; Ryan-Weber, Webster & Staveley-Smith, 2003; Zwaan et al., 2005b, 2008). Thus, the study of radio samples can offer statistically valuable information about DLA galaxies and opportunities for exploring the evolution of DLA systems. The advantage of using the radio samples is summarized as follows: (1) the radio survey has no bias against optically low surface brightness galaxies that may be missed by optical and near-infrared surveys, (2) the identification process is free from the masking effect because no bright sources are located behind them, and (3) the sample size is much larger than those of DLA optical counterparts.
By employing our model for DLA galaxies, we investigate the number of HI-selected galaxies
that can be DLA galaxies. Next, we focus on the optical properties (e.g., SFR ) of DLA galaxies
to explore how DLA galaxies should be detected in optical surveys. Finally, we investigate
the number of HI-selected galaxies that can be host galaxies of other
quasar absorption systems such as sub-DLA systems that exhibit HI column
densities lower than those of DLA systems. This study of HI-selected galaxies offers
valuable opportunities for exploring the low-redshift end of the evolution of DLA and
sub-DLA systems.
In Section 2, we describe our models used in this paper. In Section 3, we argue a relationship between the HI-selected galaxies and DLA galaxies. In Section 4, we investigate the optical/infrared properties of the HI-selected galaxies and DLA galaxies. In Section 5, we focus on another population of absorption systems, namely sub-DLA systems, and argue how they contribute to the local galaxy population. In Section 6, we derive several implications from our results. Finally, we draw our conclusion in Section 7.
2. Model
We employ a semi analytic model of galaxy formation for DLA galaxies (Okoshi et al., 2004, hereafter Paper I). It has been shown that this model accounts for the observational properties of local galaxies, such as luminosity functions and cold gas mass fractions (Nagashima et al., 2001). Previously, we have shown that our model of DLA galaxies reproduces several optical/near-IR observations for the host galaxies of DLA systems at low redshift (Okoshi & Nagashima, 2005, hereafter Paper II). We have also found a tight correlation between cross sections and HI masses of DLA galaxies entirely consistent with the ADBS result (Rosenberg & Schneider, 2003). In this paper, we adopt almost the same model as in Paper II and investigate DLA galaxies at redshift by comparing radio and optical properties between DLA galaxies and HI-selected galaxies. The outline of this model is described as follows.
We adopt a standard CDM cosmological model with parameters, , , , (where km s-1 is the Hubble parameter), and , the normalization of the power spectrum of density fluctuations given by Bardeen et al. (1986). The number of progenitors of a dark halo is given by an extended Press-Schechter model. The mass function at is provided by the Press-Schechter mass function (Press & Schechter, 1974; Bond et al., 1991; Bower, 1991; Lacey & Cole, 1993). The realizations of progenitor histories are computed by the method developed by Somerville & Kolatt (1999). We focus on halos with circular velocity km s-1 because we assume that less massive systems ( km s-1) correspond to diffuse accretion masses. The main difference from the previous model is a value adopted for the threshold on the accretion mass, ; km s-1 in Papers I and II.
We assume that baryonic gas comprises cold and hot phases. When a halo collapses, halo gas is assumed to be shock-heated to the virial temperature of the halo and distributed in a singular isothermal sphere (hot gas). The gas component partly cools by radiative cooling processes. The cooled gas is called ‘cold gas’. Here we use a metallicity-dependent cooling function (Sutherland & Dopita 1993). After the cold gas falls onto a central region of the halo, stars are formed from the cold gas. The SFR is assumed to be , where and are the masses of stars and cold gas, respectively, and is the timescale of star formation. We simply assume that the SFRs are constant in the galactic disks. Following our previous models, we assume the timescale of star formation; . In Papers I and II, we found that, to account for several observational properties of the DLA hosts, should be constant with redshift and dependent on the circular velocity of the halos hosting DLAs, i.e., (, )=(, km s-1). Here we determine the parameters (, ) by matching the HI mass function to those that have been observed. Initially, we adopt a set of parameters (, )=(, km s-1) and Gyr, the same set as used for the previous model (Constant Star formation model) in Papers I and II.
Moreover, we also consider another model for star formation, adopting a different set of parameters (, ). Assuming that the star formation timescale , adopting small (large negative) values of indicates that the star formation timescales are longer in less massive galaxies. This leads less massive galaxies to have lower SFRs and then produces high number densities of low galaxies. Here we employ a model in which the star formation rates are low in less massive systems by adopting . Hereafter, we call the two models: High Star formation (HS) model with and Low Star formation (LS) model with . The normalizations of the star formation timescale, (, )=( Gyr, km s-1), are identical for both models.
Supernova feedback processes are incorporated in this model. The rate of reheating by supernova feedback is assumed to be . Because the feedback process should affect the physical condition of the gas more drastically in less massive galaxies, we assume that , where the parameter sets, (, )=( km s-1, ) 111 We here adopt a parameter km s-1 slightly smaller than km s-1 adopted in Papers I and II because this better matches the observational data of HI mass functions as presented below. We have confirmed that this makes little difference to our previous results in Papers I and II. for the HS model and ( km s-1, ) for the LS model, are required to account for the observed optical luminosity functions of local galaxies. The results for optical luminosity functions are argued in Section 3.
We include the merging of galaxies in this model. In our model, when two or more dark halos merge, the central galaxy in the largest progenitor halo becomes the new central one. The other galaxies become satellites dwelling in the largest halo of the central galaxy. We assume that the merging of galaxies in a common halo occurs due to two types of mechanisms: dynamical friction and random collision. When satellite galaxies merge with the central one, the merging occurs on the dynamical friction timescale. In the merging of satellites, they collide randomly within the mean-free timescale. After the merging of two galaxies (e.g., A and B), a starburst occurs and all cold gas is consumed by the star formation if the mass ratio, (), is larger than (major merger). Otherwise, no star formation activity occurs when the mass ratio is smaller than (minor merger). In this paper, we adopt in the same way as in Papers I and II.
We address the definition of the size and the HI column density of a DLA galaxy. In this model, the radial distribution of the HI column density follows an exponential profile with an effective radius of a gaseous disk, , obtained by assuming the specific angular momentum conservation of the cooling hot gas. The dimensionless spin parameter of dark halos has a log-normal distribution with an average of and a logarithmic variance of . Using the above assumptions, we calculate the following quantities. The first is the central column density provided by , where is the mass of a hydrogen atom and is the mean molecular weight. In this procedure, in order to take into account the inclination, of gaseous disks in each galaxy, we create random realizations of the inclinations, and then calculate the cross section and the column density. The second is the size of a DLA galaxy defined by a radius where cm-2. Here we adopt the conventional threshold for the HI column density of DLA systems. The third is the HI column density of a DLA galaxy, which is defined as the column density averaged over radius within .
3. HI-selected Galaxies and DLA Galaxies
First, we present the optical luminosity function and the HI mass function (HIMF) of local galaxies provided by the optical and the radio surveys. These properties are strong indicators used to probe the physical conditions of nearby galaxies with statistically significant confidence because, for the optical luminosity function, the sample size of the Sloan Digital Sky Survey (SDSS) is quite large, more than 30,000 (Blanton et al. 2005), and, for the HIMF, the sample size from the HIPASS is about (Zwaan et al. 2005a) .
3.1. Luminosity Function
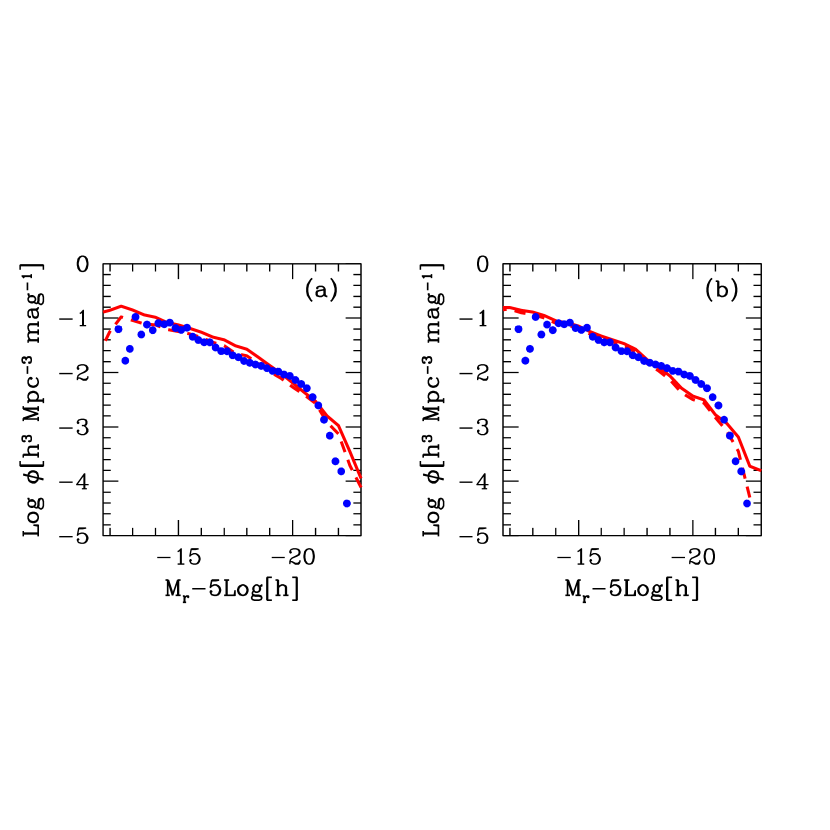
In Figure 1, we show the luminosity function at redshift . Figure 1(a) shows the -band luminosity function of galaxies (solid line) in the band for the HS model. The observational data are given by the SDSS Data Release 2 (filled circles; Blanton et al. 2005). We set the supernova feedback-related parameters, and , so as to account for the faint-end slope of luminosity function that is sensitive to the supernova feedback because it predominantly suppresses the formation of dwarf and faint galaxies. It appears that the abundance of bright galaxies () is slightly higher than the observation. This is partly because, for simplicity, we adopt total magnitudes instead of the Petrosian magnitudes that the SDSS team uses. This makes simulated galaxies more luminous than the observed ones.
In Figure 1(b), we show the -band luminosity function of galaxies (solid line) for the LS model. The LS model reproduces the faint-end slope of the luminosity function. However, the abundance of bright galaxies, particularly at , is slightly lower than that for the HS model that reproduces the observation. For the LS model, by adopting km s-1 instead of km s-1 used for the HS model, the reheating rate by supernova feedback is higher than that for the HS model. The supernova feedback suppresses the formation of bright galaxies more drastically than the HS model.
In Figures 1( a) and 1(b), we also show the optical luminosity functions of DLA galaxies (dashed lines) for the HS and LS models, respectively. Here, ‘DLA galaxies’ are selected by a criterion where the gaseous disks exhibit HI column densities above the threshold, cm-2, while ‘galaxies’ are defined without any thresholds on the HI column density. The shapes of luminosity functions of DLA galaxies are similar to those of galaxies in the whole range of the observed magnitudes, indicating that many (bright and faint) galaxies have gaseous disks with HI column densities large enough to give rise to damped Ly absorption lines when they are on a line of sight to the background quasar. In other words, the low-redshift DLA systems arise not only in bright galaxies but also in faint ones.
3.2. HI mass function
The HI mass function (HIMF) is one of the most important statistical properties of local galaxies. While the optical luminosity function describes the distribution of stellar mass, the HIMF describes the distribution of cold gas mass. The HIMF has an advantage in terms of the ability to trace the HI-mass distribution of galaxies even in the case where the optical luminosities are too faint to identify in optical surveys.
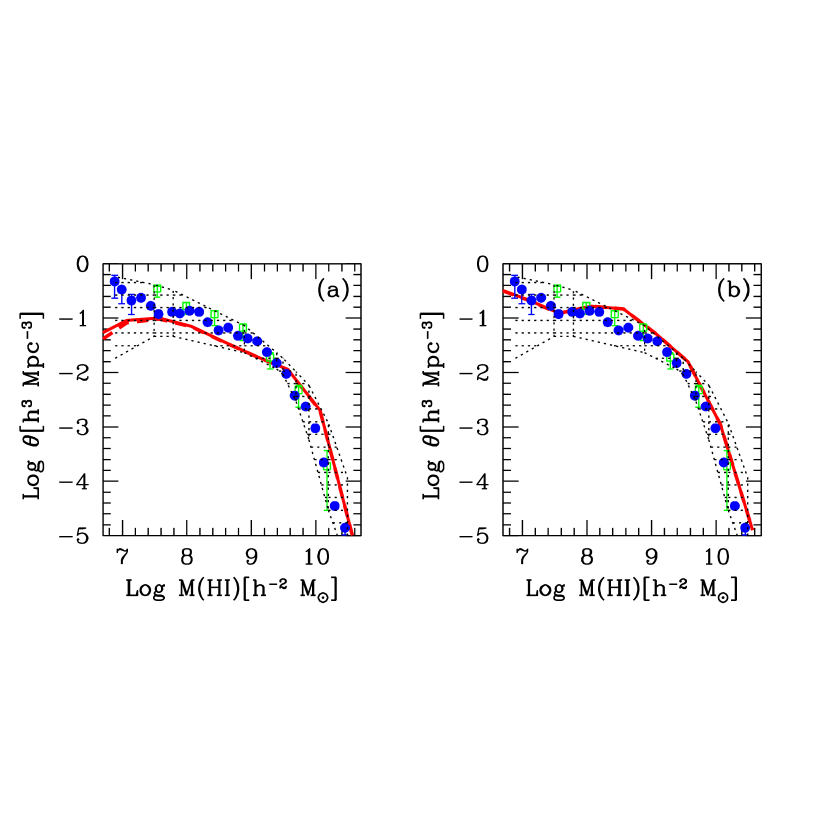
Figure 2(a) shows the HIMF of galaxies for the HS model (solid line). The predicted HIMF is similar to a Schechter-type function. Blind 21cm surveys have shown that HI-selected galaxies follow an HIMF, , that can be well fitted by a Schechter function with a faint-end slope , , e.g., for the HIPASS sample, in the mass range (Zwaan et al., 2005a). However, because the survey fields and/or the sample sizes are different, the slopes of HIMFs still appear to differ from survey to survey (e.g., to ). This may be due to environmental effects in which the slope depends on the local galaxy density. Taking into account this uncertainty, we present the range of HIMFs provided by various blind surveys (the shaded region; Henning et al. 2000; Springob, Haynes & Giovanelli 2005; Rosenberg & Schneider 2002, 2003; Zwaan et al. 1997, 2003, 2005a), together with some individual data for the HIMF (open squares, Rosenberg & Schneider 2002; filled circles, Zwaan et al. 2005a).
The HS model produces an abundance of galaxies within the range of the observational data. Particularly at where the sample size provided by the HIPASS is the largest in the number density (Zwaan et al. 2005a, 2005b), our result is consistent with the observations. However, in the low-mass end, the predicted abundance is somewhat lower than the HIPASS observations. Although the small observational sample at accounts for some uncertainties in the low-mass end, for the HS model, the underprediction is mainly due to the high star formation rates suppressing the formation of low galaxies.
In Figure 2(b), we show the HIMF for the LS model (solid line). The LS model also produces a good match to the observations. In comparison to the data range of number densities at , the LS model produces an abundance of galaxies corresponding to upper limit of observed number densities, while the HS model produces one corresponding to lower limit.
In Figure 2, we also show the HIMFs of DLA galaxies (dashed lines). For the HS and the LS models, the HIMFs of DLA galaxies are obviously similar to those of galaxies (in Figure 2(b), the HIMF is almost identical to those of galaxies). This result suggests that, in the radio blind surveys, the HI-selected galaxies mostly have gaseous disks with the HI column densities as high as those of DLA systems. However, it should be noted that for the HS model, we find that the number densities of DLA galaxies are somewhat smaller than those of galaxies at the low-mass end. This shows that all galaxies do not have gaseous disks with HI column densities that are above the DLA threshold.
3.3. Cold gas mass to -band Luminosity
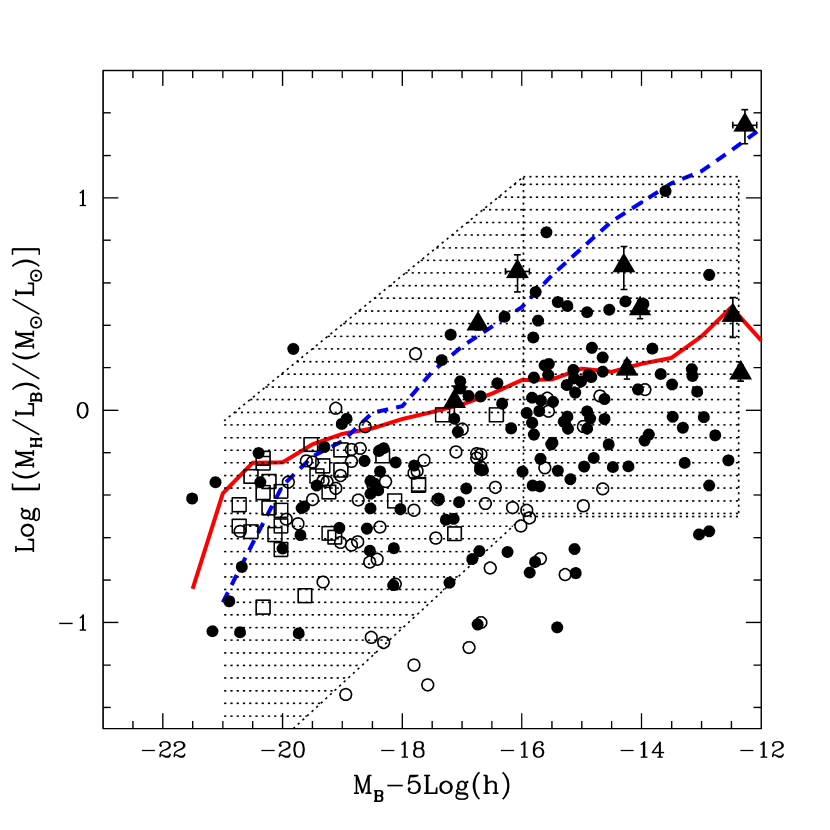
In Figure 3, we show the ratios of cold gas mass relative to the -band luminosity of spiral galaxies for the HS (solid line) and the LS (dashed line) models, respectively. Symbols indicate the observations provided by Huchtmeier & Richter (1988; filled circles), Sage (1993; open circles), and Garnett (2002; open squares). The HI-selected galaxies from the HIPASS are also included; Koribalski et al. (2004; shaded region) and Warren, Jerjen & Koribalski (2006; filled triangles). The HIPASS data from Koribalski et al. (2004) represent the shaded region because the sample size is large. The cold gas masses given by the HIPASS and Huchtmeier & Richter (1988) include only HI.
The results for the HS and LS models show that faint galaxies have large mass fractions of cold gas. The mass fractions of faint galaxies for the LS model are larger than those for the HS model because the star formation timescales are longer in faint galaxies. Our result shows that the predicted cold gas mass fractions are within the range of observational data. However, taking into account the addition of the HIPASS data, the cold gas mass fraction was still unable to constrain the star formation timescale because the range of observed data spans one or two orders of magnitude, particularly at the faint end. When the samples of faint galaxies increase in the future, the ratio of faint galaxies () will constrain the star formation rates more stringently.
3.4. Number Fraction
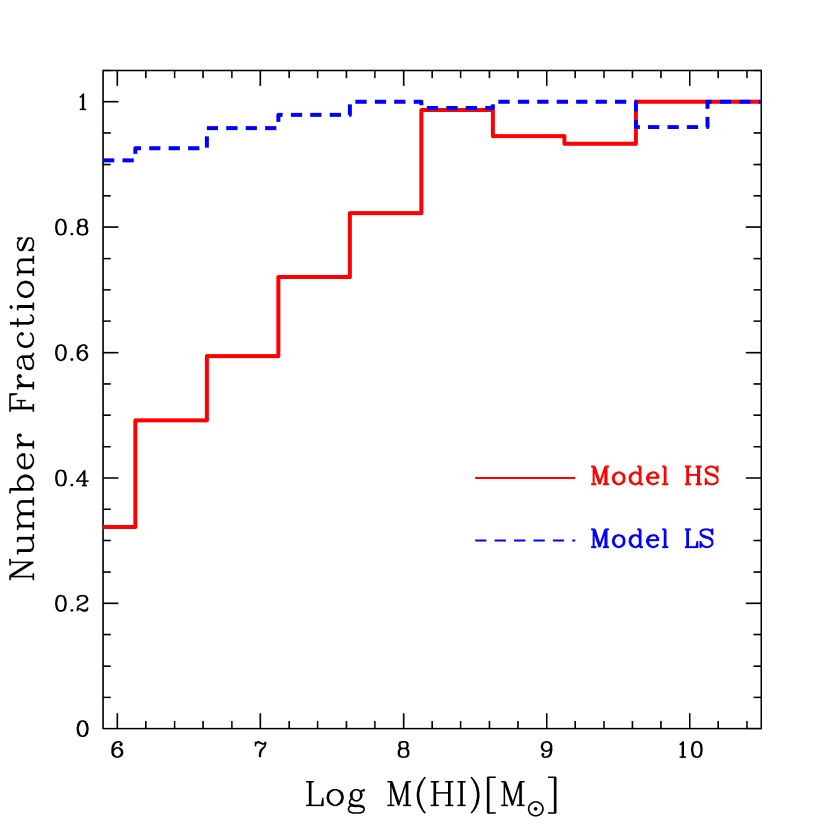
For the purpose of evaluating more precisely how many DLA galaxies contribute to the galaxy population, in Figure 4, we present number fractions of DLA galaxies as a function of HI mass . The number fraction at each bin of HI mass is defined as a ratio of the number densities of DLA galaxies relative to those of galaxies per bin of HI mass. The result for the HS model (solid line) shows that the number fractions are almost unity at , which suggests a trend that the gaseous disks of massive galaxies do have high enough HI column densities to give rise to damped Ly absorption lines if a background bright emission source exists along a line of sight. Noticeably, in the low-mass range , the number fractions begin to decrease toward the low-mass end, e.g., at and at . We find that, at , the number distribution of DLA galaxies is not identical to that of galaxies. This indicates that the small amount of HI gas contained in the less massive systems does not have high enough HI column densities to detect as DLA systems. For the HS model, at the low-mass end, another population becomes dominant instead of DLA galaxies. The population at the low-mass end is argued in Section 5.
The number fractions for the LS model are also shown in Figure 4 (dashed line). While the number fractions are almost unity at , they begin to decrease gradually toward the low-mass end (). In comparison to the result for the HS model, the SFRs of less massive galaxies are low for the LS model. The low SFRs make the HI column densities of low- galaxies as high as those of DLA systems. This increase in HI column density causes the number fractions of DLA galaxies to be large even at the low-mass end . The differences between the numbers of DLA galaxies and galaxies are not as large as those for the HS model. However, for the LS model, we find a trend similar to one for the HS model, in which not all galaxies correspond to DLA galaxies at the low-mass end (e.g., number fraction at ).
4. Optical Properties of HI-selected Galaxies
Here, we investigate the difference between galaxies and DLA galaxies through the optical/infrared properties of HI-selected galaxies. It should be noted that galaxies in our calculation are volume-limited, whereas the observed HI-selected galaxies are not volume-limited but flux-limited . To draw a detailed comparison between them, attention needs to be paid to the difference in the selection criteria. This is an issue that deserves further investigation.
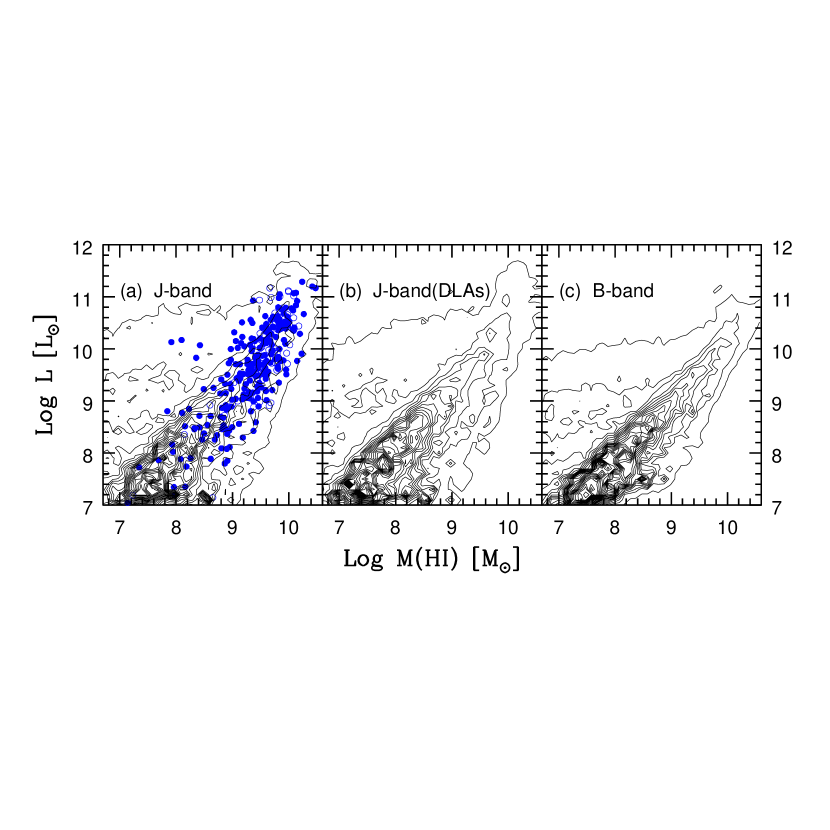
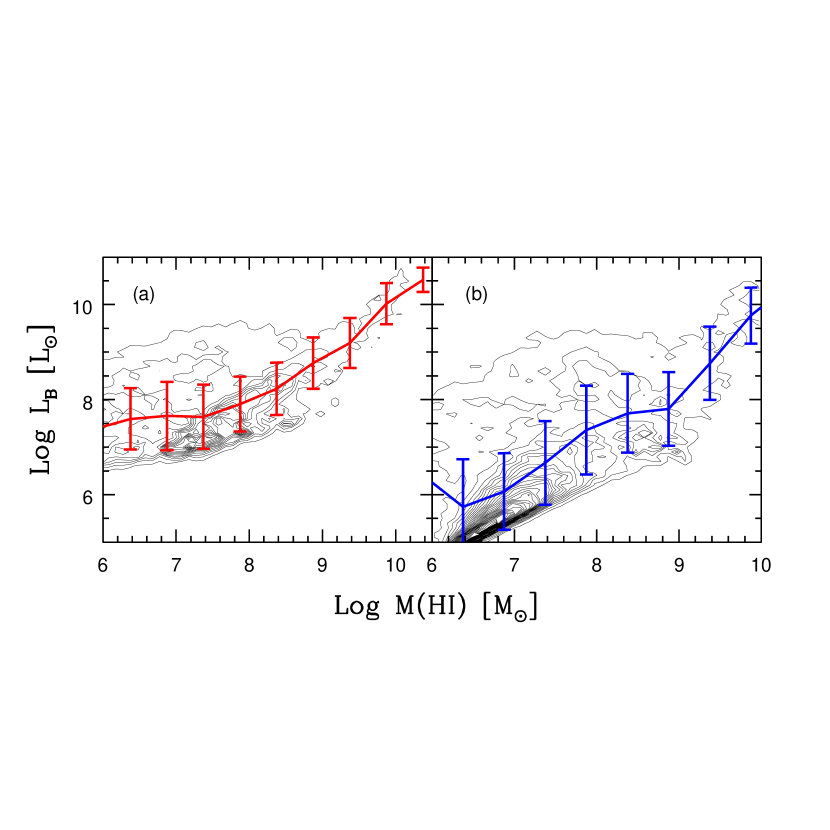
In Figure 5, we show the predicted distribution of galaxies and DLA galaxies in the plane of the HI mass and the luminosity by contours for the HS model. In Figure 5(a), we present the -band luminosities of the galaxies by contours, together with the observational data (filled circles, Rosenberg & Schneider 2000; open circles, Spitzak & Schneider 1998). Our result is broadly consistent with the observations. In the blind surveys, it has been investigated whether the HI-selected galaxies exhibit a correlation between the HI mass and the -band luminosity (Rosenberg & Schneider, 2003; Rosenberg, Schneider & Posson-Brown, 2005). Although our result indicates that at there is a correlation between the luminosities in the band and the HI masses, there is no linear relationship between and .
The abundance of less massive galaxies ( ) in the - plane severely depends on formation processes of less massive galaxies. In our model, we treat halos with km s-1 as a diffuse accretion mass. We assume that a suppression of galaxy formation within halos with the circular velocities less than occurs mainly due to the ionizing background radiation. The presence of the ionizing radiation prevents the gas from collapsing into a dark halo because the radiation raises the temperature and pressure of the gas. As a result of previous studies using hydrodynamic simulations, the suppression mechanism should be large in low-mass halos with km s-1 (e.g., Thoul & Weinberg 1996; Quinn, Katz & Efstathiou 1996; Weinberg, Hernquist & Katz 1997; Navarro & Steinmetz 1997; Gnedin 2000; Bullock, Kravtsov & Weinberg 2000; Kitayama & Ikeuchi 2000; Hoeft et al. 2006; Okamoto, Gao, & Theuns 2008). The suppression of galaxy formation in the low-mass halos with km s-1 reduces the number densities of less massive galaxies. This directly affects the shape of the luminosity function of galaxies by making a shallower faint-end slope (Nagashima, Gouda & Sugiura, 1999; Somerville, 2002; Benson et al., 2002). In the - plane, the luminosity distribution, particularly at the faint end, also depends sensitively on . If the suppression threshold, km s-1, the abundance of faint galaxies ( ) shows a significant increase. The abundance of less massive galaxies is a potentially useful probe that places constraints on .
In Figure 5(b), we show the number distributions of DLA galaxies in the - plane by contour lines for the HS model. The -band luminosities are broad and span approximately four orders of magnitude, to at . The luminosity distribution of DLA galaxies does not significantly differ from that of galaxies (Figure 5(a)). We find that, for each bin of HI mass ( ), the averaged luminosities of galaxies match those of DLA galaxies within one of error. The main reason is that most galaxies have gaseous disks where the HI column densities above the DLA threshold, particularly at (see Figure 4).
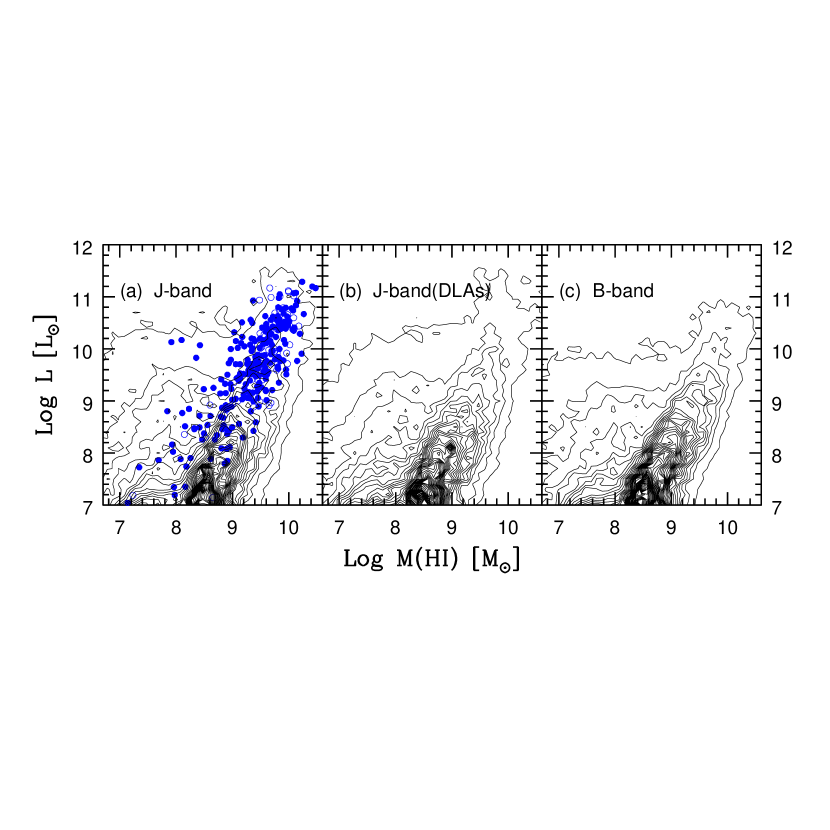
In Figure 6, for the LS model, we plot the abundances of galaxies (Figure 6(a)) and DLA galaxies (Figure 6(b)) in the plane of the HI mass and the -band luminosity. In Figure 6(a), our result is consistent with the observations, particularly at . It is evident that the number distributions in the - planes show no difference between DLA galaxies and galaxies because most galaxies correspond to DLA galaxies for the LS model as shown in Figure 4. Both models successfully reproduce the observed abundance of galaxies at the bright end of -band luminosities (). However, our models produce wide spreads at the faint end () in the - planes. Thus, the wide spreads cannot put stringent constraints on the star formation rates.
Figures 5(c) and 6(c) show the -band luminosity distributions of galaxies as a function of HI mass for the HS and LS models, respectively. Obviously, the -band luminosity correlates with the HI mass more tightly than the -band luminosity because the -band luminosity is more acutely sensitive to the SFR than the -band luminosity. In observations, this correlation has been suggested by a survey for optical counterparts of the HI-selected samples. For example, Doyle et al. (2005) found the optical counterparts of among the sample of HI-selected galaxies. They argued that there is a clear trend that more luminous galaxies have higher radio fluxes. This is consistent with our result. The results can be of great interest in comparing the radio properties of nearby galaxies to the optical (e.g., the -band ) ones.
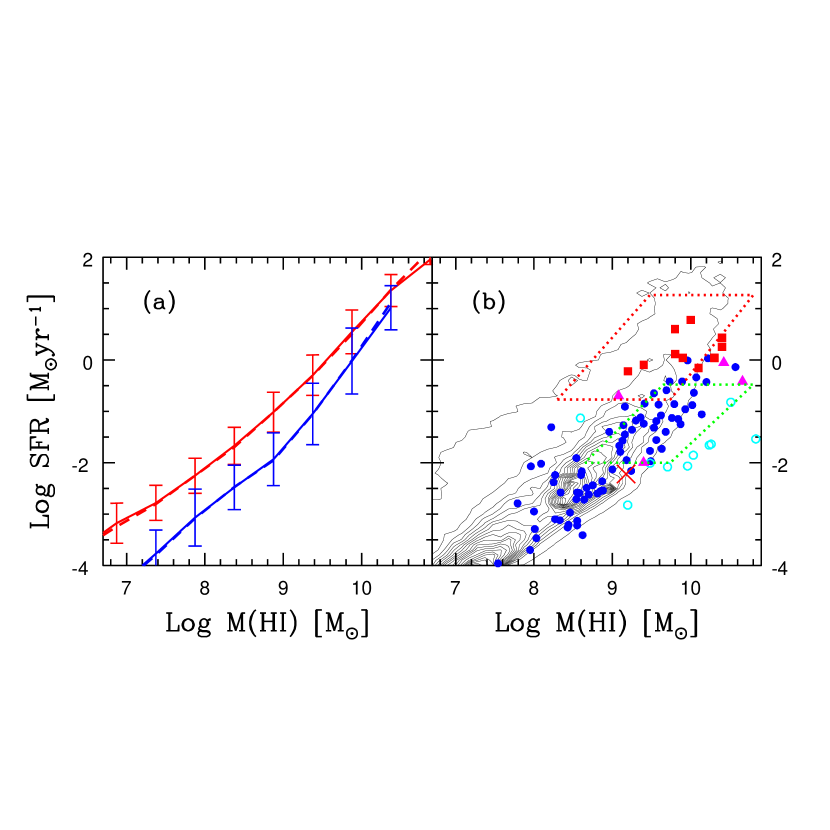
Furthermore, we focus on a relationship between SFRs and HI masses in galaxies. In our model, the SFR is proportional to the cold mass with a typical timescale as . This means that the star formation timescale is induced directly from the slope of the SFR- relation. Figure 7 shows the SFRs in galaxies as a function of HI mass. Figure 7(a) presents the averages of SFRs in galaxies with one error bars for the HS model (red solid-line) and the LS model (blue solid-line), respectively. It is evident that massive galaxies exhibit high SFRs. When this relation SFR is fitted by averaged least squares, we find the slope (the HS model) and (the LS model) in the range of HI mass . Moreover, we also show the SFRs in DLA galaxies as a function of HI mass for the HS model (red dashed-line) and the LS model (blue dashed-line), respectively. The average SFRs in DLA galaxies are almost identical to those in galaxies. The LS model predicts the SFRs lower than the HS model because, for the LS model, the star formation timescales are longer particularly for less massive galaxies.
Surveys for emission lines from nearby galaxies have been attempted to investigate the star formation activity. For example, the emission-line images in the H band provide valuable measurements of the ionizing flux against the interstellar medium (ISM) and of the SFRs in the ISM (e.g., Kennicutt 1983, 1998, and references therein). Because large samples of HI-selected galaxies obtained from the blind radio surveys have become available, some optical surveys have aimed to detect the H emissions from the HI-selected galaxies. For example, the Survey for Ionization in Neutral Gas Galaxies (SINGG) focuses on detecting the H emissions from the HIPASS galaxies (e.g., Meurer et al. 2006, and references therein). The SFRs of galaxies are successfully estimated by the H images of the HIPASS samples.
In Figure 7(b), we plot a contour map between the SFR and the HI mass in galaxies for the LS model. The SFRs range widely from to yr-1 in the mass range . Together with the SFRs based on the SINGG (filled circles; Meurer et al. 2006), we also show the SFRs determined from the intensities of infrared (red dotted box) and radio (green dotted box) emissions from the HIPASS galaxies: HIPASS Optical Catalogue (HOPCAT; Doyle & Drinkwater 2006). Furthermore, the SFRs in low surface brightness galaxies based on the optical and infrared imaging data are also plotted individually (open circles, van Zee et al. 1997; filled triangles, O’Neil, Oey, & Bothun 2007; and filled squares, Rahman et al. 2007). Our result is consistent with the observations because the scatter is similar to those in the observations for the wide range of the HI masses. At low-mass end , our model would be constrained more stringently by further observational measurements of the SFRs in less massive galaxies. This contour map also shows that the scatter of the SFR is generally smaller than those in the -band luminosity. We conclude that, including the less massive galaxies (), the HI mass correlates with the SFR, e.g., the luminosity more tightly than the -band luminosity. We also show the result of a direct measurement of SFR, yr-1, in the nearest galaxy ( at ) giving rise to a damped Ly absorption line (cross; Schulte-Ladbeck et al. 2004). We find that our prediction is consistent with the SFR in the DLA galaxy that is also within the range of the SFRs obtained from the HIPASS sample.
The -band luminosities in the - planes (Figures 5 and 6) show scatters larger than the SFRs in the SFR- plane (Figure 7(b)). This stems from the fact that the -band luminosity is sensitive to the stellar mass rather than the HI mass. Galaxies have a variety of stellar masses even if they have the same amount of HI gas. Therefore, the variety of the stellar masses produces substantial scatters of the -band luminosity, as shown in the - planes. Furthermore, the -band luminosity correlates with the HI mass more tightly than the -band (Figures 5(c) and 6(c)) because the -band luminosity is more sensitive to the SFR than the -band luminosity.
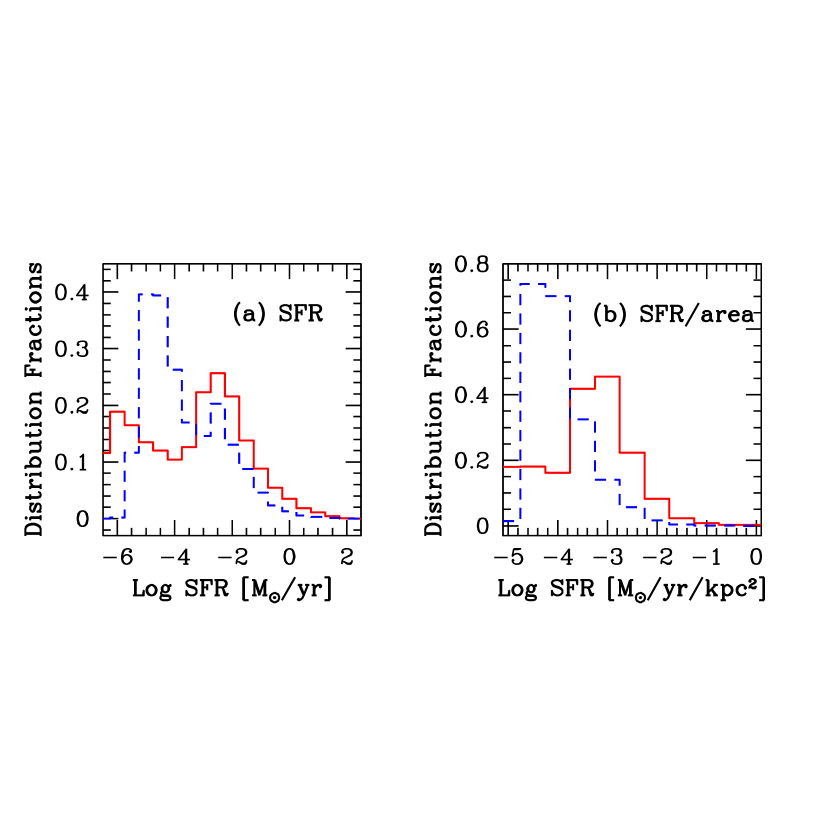
Figure 8(a) shows the distribution functions of galaxies as a function of the logarithmic SFR for the HS model (solid line) and the LS model (dashed line) . It is obvious that the SFRs range widely from to yr-1. We find the mean values of the logarithmic SFRs SFR [ yr for the HS model and for the LS model. For the LS model, the number fractions of galaxies with low SFRs (e.g., yr-1) are higher than those for the HS model, because the star formation timescales for the LS model are relatively long in less massive systems. This result suggests that less massive galaxies with low SFRs ( yr-1) are numerically dominant.
Figure 8(b) shows the distribution functions of galaxies as a function of the logarithmic SFR per unit area for the HS model (solid line) and the LS model (dashed line). The difference between the two models is clearer than that shown in Figure 8(a). The LS model obviously predicts smaller SFRs per unit area than the HS model. The mean values of the logarithmic SFRs per unit area in units of yr-1 kpc-2 are for the HS model and for the LS model. When the large sample of SFRs per unit area in the HI-selected galaxies becomes available, in addition to the SFRs, the SFRs per unit area are a good probe of star formation activities.
5. HI-selected Galaxies and Sub-DLA systems
We focus on HI-rich systems that contribute to the galaxy population at the low-mass end and make further implications concerning the relationship between the HI-selected galaxies and quasar absorption systems. In general, quasar absorption systems optically thick against ionizing photons are classified into three morphological types: DLA system ( cm-2), sub-DLA system ( cm-2), and Lyman-limit system ( cm-2). The sub-DLA system gives rise to HI absorption lines with strong damping wings in quasar spectra in a manner similar to DLA systems. From aspects of the study of physical and chemical processes in gas optically thick against the ionizing radiation background, sub-DLA systems are also of particular interest. In recent studies, the basic properties of sub-DLA systems have been explored in comparison with those of DLA systems (e.g., Proux et al. 2003, 2005, 2006, 2007; Dessauges-Zavadsky et al. 2003; Christensen et al. 2005; Tripp et al. 2005; Briggs & Barnes 2006; Prochaska et al. 2006; York et al. 2006; Khare et al. 2007; Kulkarni et al. 2007; O’Meara et al. 2007; Meiring et al. 2007, 2008). These studies offer several interesting findings; e.g., (1) sub-DLA systems are more abundant than DLA systems. The number density of sub-DLA systems observed in each column-density bin is obviously higher than that of DLA systems at a given redshift; (2) the metallicities of sub-DLA systems are higher than those of DLA systems; and (3) the metallicity evolution is positive: an increase in metallicity with decreasing redshift, from at to at ( Proux et al. 2003, 2007).
Here, we argue how the galaxies, in which the HI column densities are as high as those of sub-DLA systems, contribute to the galaxy population at redshift . In Figure 4, we showed the number fractions of DLA galaxies relative to galaxies. Our result shows that the number fractions of DLA galaxies obviously decrease toward the low-mass end. This indicates that another population contributes to the local galaxy population. We refer to galaxies having gaseous disks that exhibit HI column densities, cm-2, corresponding to those of sub-DLA systems as sub-DLA galaxies. In our model, the size of a sub-DLA galaxy is given by the radius where cm-2. The HI column density of a sub-DLA galaxy is defined as the HI column density averaged over the radius within . It has been argued that HI gaseous disks are truncated at a column density of cm-2 (e.g., Maloney 1993; Corbelli and Salpter 1993). The truncated column density depends roughly on the number density and the flux of the ionizing photons . It is simply estimated as cm-2 ( cm-2 s-1)( cm-3)-1 under a gas temperature of K, which is consistent with the column densities of sub-DLA systems. Therefore, sub-DLA galaxies having the gaseous disks with cm-2 provide us with useful information about the physical condition for gas in the outer part of galactic disks and for surroundings of disks.
5.1. Number Fraction
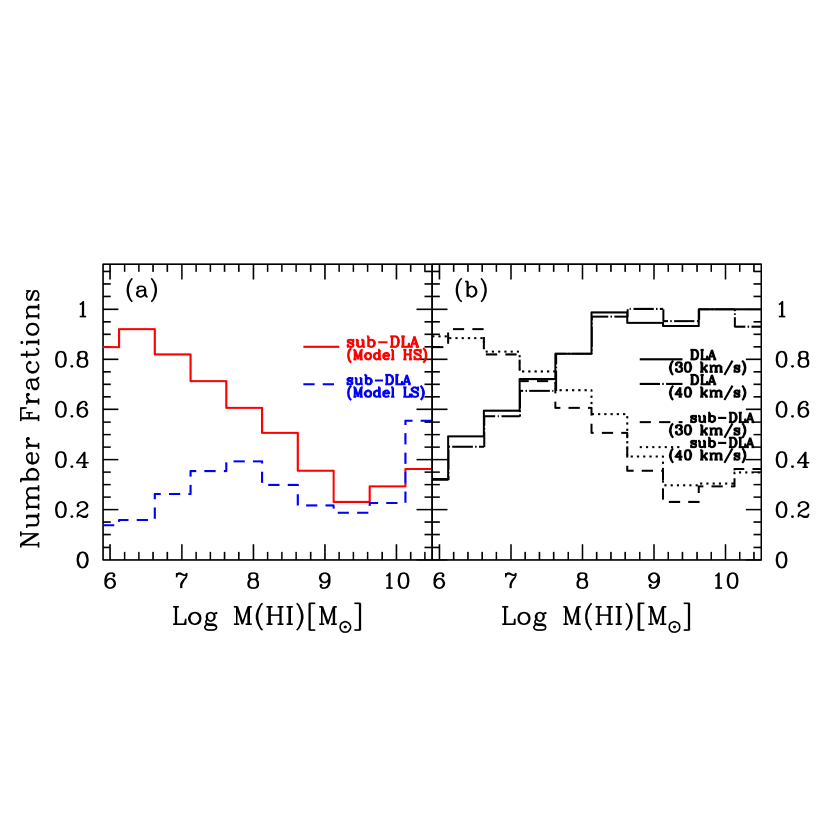
In Figure 9(a), we show the number fractions of sub-DLA galaxies relative to galaxies per bin of HI mass for the HS model (solid line) and the LS model (dashed line). The number fraction at each bin of HI mass is defined as a ratio of the number density of sub-DLA galaxies relative to that of galaxies per bin of HI mass. In contrast to DLA galaxies, the number fractions of sub-DLA galaxies increase toward the low-mass end, particularly for the HS model. Sub-DLA galaxies are dominant at the low-mass end while DLA galaxies are dominant at the high-mass end. For the HS model the number fractions attain at and at , respectively. For sub-DLA galaxies, we find that the mean HI gas mass , the mean logarithmic HI-mass , and the cross section weighted mean HI mass , while for DLA galaxies , , and the cross section weighted . The results indicate that sub-DLA galaxies are primarily composed of less massive galaxies rather than DLA galaxies. It should be noted that, in our result, some systems are identified not only as DLA galaxies but also as sub-DLA galaxies because the gaseous disks having central column densities higher than the DLA threshold of cm-2 extend to the edge at which is as low as the sub-DLA threshold of cm-2. This causes a case where, in a bin of HI mass, the sum of the number fractions for DLA and sub-DLA galaxies is not unity (Figures 4 and 9( a)). For the LS model, at , the number fractions of sub-DLA galaxies are lower than those for the HS model, at and at . The LS model predicts, for sub-DLA galaxies, the mean HI gas mass , the mean logarithmic HI-mass , and the cross section weighted mean HI mass , while, for DLA galaxies, , , and the cross section weighted .
The main reason for the difference between the number fractions for the models is that, for the LS model, the SFRs are relatively low in less massive systems. As shown in Figure 8(b), the high SFRs for the HS model result in higher surface densities of stars compared to the LS model. This means that the consumption of neutral gas by star formation result in a decrease in the HI-column density. This, in turn, increases the number fraction of sub-DLA galaxies particularly at the low-mass end. We want to emphasize that, even for the LS model, the number fractions are not negligible for sub-DLA galaxies, i.e., for each bin of HI mass ( ).
The number fraction may be greatly dependent on the suppression mechanism of forming galaxies embedded in less massive halos. In our model, the isolated halo must have larger than the threshold, , which corresponds to the effective Jeans scale. In Figure 9(b), for the HS model, we present number fractions of DLA galaxies (dash-dotted line) and sub-DLA galaxies (dotted line) when km s-1, together with those of DLA galaxies (solid line) and sub-DLA galaxies (dashed line) when km s-1. Because provides the lowest mass of dark halos, adopting a small generally prompts the formation of less massive systems. However, we find that the number fractions show little difference for the cases adopting km s-1 and km s-1. This means that the number fractions are almost independent of the suppression threshold. Adopting large results in reducing the number of galaxies and DLA galaxies simultaneously, and thus does not affect the number fractions. This is also the case for the sub-DLA galaxies. These results suggest that the uncertainties in the threshold on halo circular velocity or the ionization history in the universe do not change our results.
The majority of HI-selected galaxies detected in the latest radio surveys have gaseous disks where the HI column densities are above the DLA threshold. However, our results suggest that gaseous disks of less massive galaxies () have HI column densities above the sub-DLA threshold. When the observations have sufficiently lower detection limits (), the observed populations will switch from being dominated by DLA galaxies to being dominated by sub-DLA galaxies. Sub-DLA galaxies will provide us with stringent constraints on formation and evolution processes of galaxies.
5.2. Cross Section
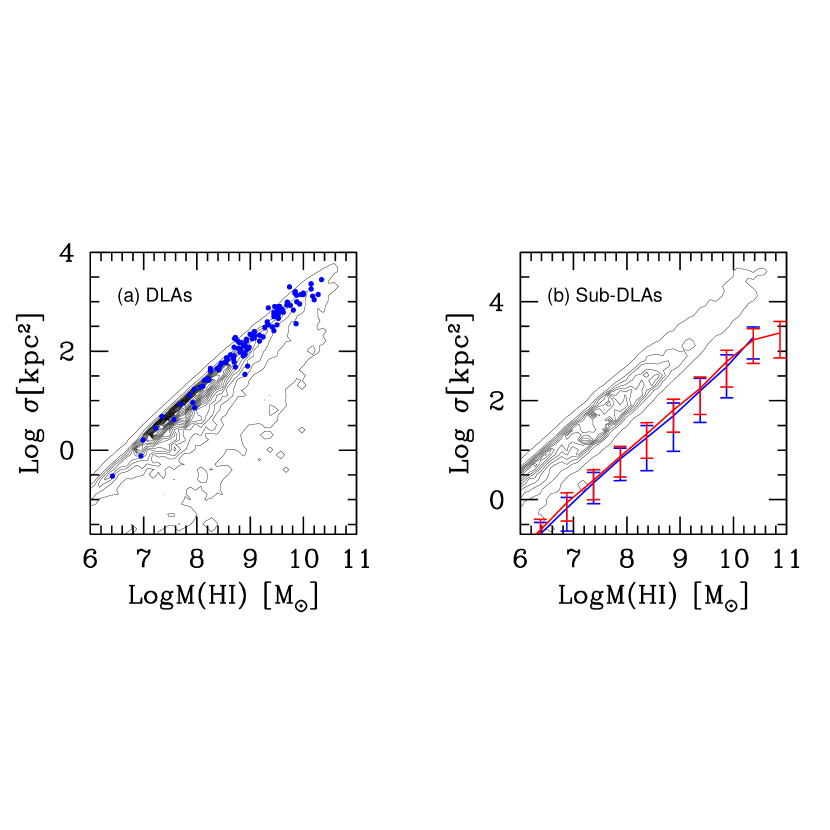
Here, we argue how sub-DLA galaxies are detected in radio observations. In Figure 10(a), we present a contour map for the cross sections of DLA galaxies as a function of the HI mass for the HS model. Obviously, the cross sections correlate strongly to the HI masses, and the disk sizes of less massive galaxies are small; kpc at and kpc at . In the observation, Rosenberg & Schneider (2003) investigated cross sections of DLA galaxies on the basis of the HI-selected samples including the ADBS ( galaxies). The observational data are also plotted as dots in Figure 10(a). Our result is entirely consistent with the observation because the - contours obviously trace the observations in the range of HI mass .
In Figure 10(b), we plot the mean logarithmic cross sections of DLA galaxies with one error bars for the HS model (red line). It is evident that the logarithmic cross section, , is linearly proportional to the logarithmic HI mass, ; . For the HS model, we find (red line) at when the relation is fitted by averaged least squares. In Figure 10(b), for comparison to the result for the HS model, the mean cross sections of DLA galaxies for the LS model is also plotted (blue line). For the LS model, the - relation has a slope of (blue line). We find that there is no significant difference between the - relations predicted by the two models.
In Figure 10(b), we present a contour map for the cross sections of sub-DLA galaxies as a function of HI mass for the HS model. Our result shows that the cross section, , tightly correlates to the HI mass. In the range of the HI mass , we find the slopes ( ) for the HS model and for the LS model when the relation is fitted by averaged least squares. We find that the slope of the - relation is insensitive to the SFRs in the disks. For comparison to the - relation for DLA galaxies (red line), sub-DLA galaxies have cross sections obviously larger than DLA galaxies because the disk radius at the sub-DLA limit cm-2 is typically larger than that at the DLA limit cm-2 under our assumption that the radial distribution of HI column density follows an exponential profile. The HI column densities are relatively low in the outer part of a gaseous disk whereas the HI column densities are high in the inner part. This means that the outer parts (large cross sections) of disks correspond to sub-DLAs while the inner parts (small cross-sections) to DLAs.
5.3. Size
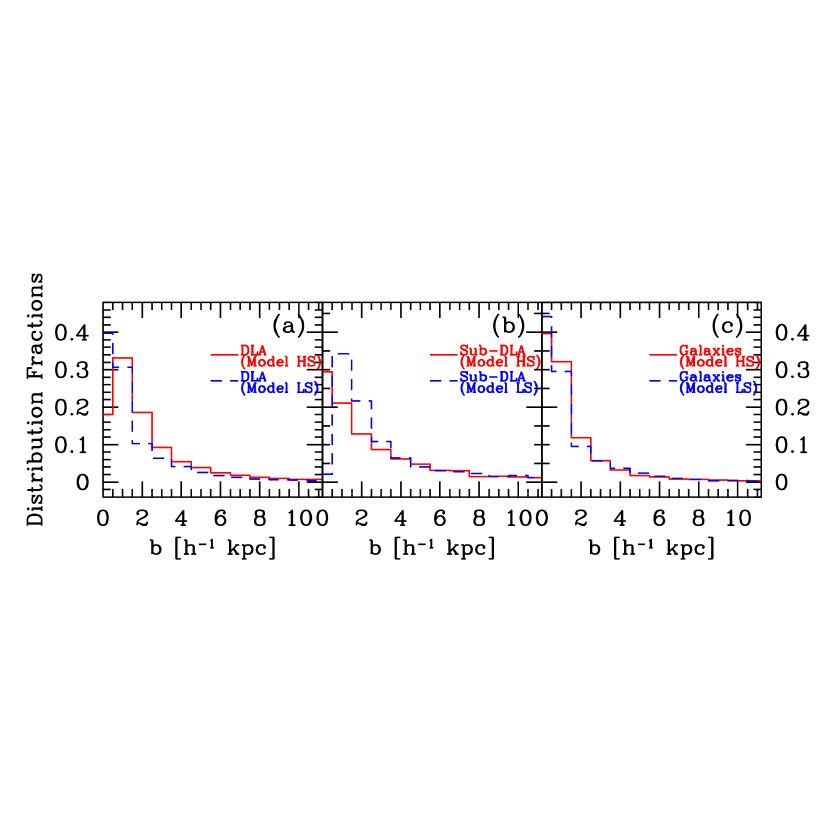
In Figure 11, we present the distribution functions of (a) DLA galaxies, (b) sub-DLA galaxies, and (c) galaxies as a function of the disk radii for the HS model (solid line) and the LS model (dashed line). The number fraction is defined as a ratio of the number within each bin of a radius relative to the total number. Figure 11(a) shows that the number fraction increases toward small radii. The mean disk radii of DLA galaxies are kpc for the HS model and kpc for the LS model. The LS model predicts a mean radius of gaseous disks smaller than the HS model because, for the LS model, less massive galaxies with small radii contribute to the population of DLA galaxies (Figure 4). By contrast, at large radii, the number fractions for the HS model are higher than those for the LS model.
In Figure 11(b), the distribution functions of sub-DLA galaxies are similar to those of DLA galaxies. We find the mean radii of gaseous disks, kpc for the HS model and kpc for the LS model. Conversely to the results for DLA galaxies, the HS model produces a mean disk radius smaller than that for the LS model. This is because, for the HS model, less massive galaxies () with small disk radii contribute primarily to the sub-DLA population (Figure 9).
For both models, the mean radii of sub-DLA galaxies are larger than those of DLA galaxies because a truncated column density for sub-DLA galaxies smaller than that for DLA galaxies results in the mean disk radii of sub-DLA galaxies larger than those of DLA galaxies. This result suggests that some massive galaxies with large disks could also be identified as host galaxies of sub-DLA systems rather than DLA systems when a line of sight to the background bright source is located at the disk edge where the HI column density is cm-2.
Zwaan et al. (2005b) investigated the properties of DLA galaxies at in comparison to those of DLA systems at on the basis of an HIPASS sample of radio emission line maps using the Westerbrock Synthesis Radio Telescope. They conclude that DLA systems arise in galactic disks because the basic observational quantities of DLA galaxies are consistent with those of DLA systems obtained from the optical and UV surveys. They also argue which morphological types of galaxies have HI column densities as high as DLA systems on the basis of their statistical analysis of the galaxy population at redshift . For example, they find that the median impact parameter between the line of sight to a background quasar and the galactic center is kpc, which is larger than the typical value of kpc for the HS model in our calculation. This discrepancy stems from our model taking into account less massive systems below the observational detection limit. Our result suggests that less massive systems () partly contribute to the population of DLA galaxy at (Figure 4). For DLA galaxies with the HI mass , we find the average values kpc (the HS model), consistent with the observation. Therefore, we want to emphasize that, although the number fraction of DLA galaxies to galaxies is small in the low-mass range (), the contribution of less massive galaxies to DLA galaxies is not negligible.
Figure 11(c) is similar to Figure 11(a) but for galaxies. The radius is defined as that at which cm-2 given by ionization equilibrium against the UV background radiation mentioned above. It should be noted again that there is no criterion when picking out ‘galaxies’ while the sub-DLA galaxies are picked out by a condition on the central HI column density of cm-2. The number fraction of galactic radii increases toward small radii, in a manner similar to those of DLA and sub-DLA galaxies. We find that there is little difference in the distribution between the HS and the LS models. The mean radii are kpc for the HS model and kpc for the LS model. This indicates that the difference between the SFRs does not significantly affect the number fractions. The result shows that the accumulated number fractions at kpc attain for the HS and the LS models, and those at kpc attain for the HS model and for the LS model.
5.4. Star Formation Rate
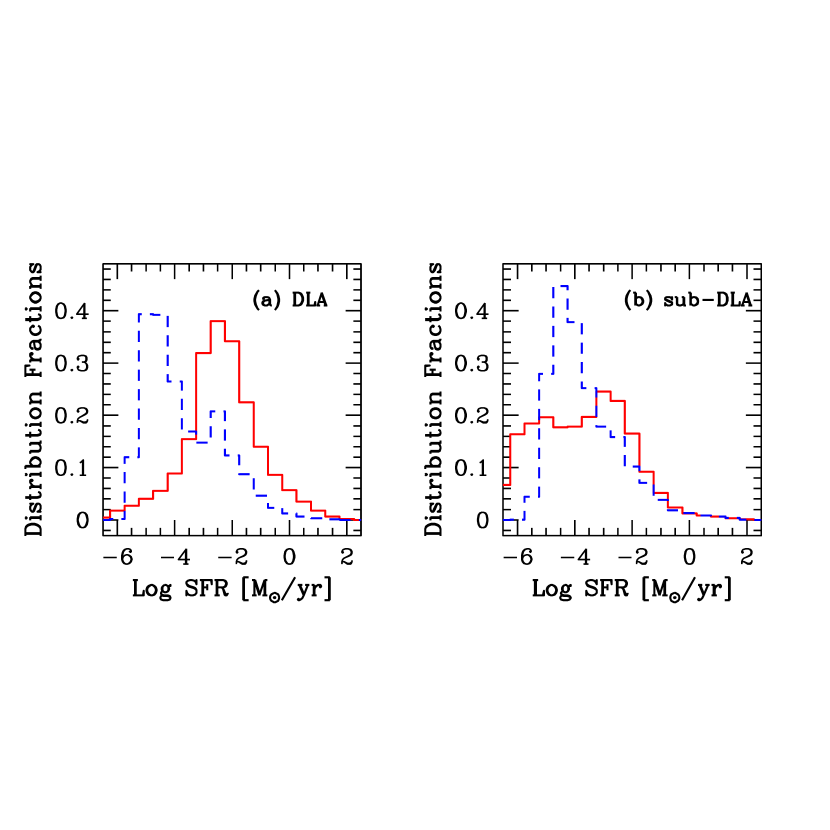
Figure 12(a) shows the distribution functions of DLA galaxies as a function of the logarithmic SFR for the HS model (solid line) and the LS model (dashed line). The SFRs in DLA galaxies widely range from to yr-1 similar to those in galaxies shown in Figure 8(a). We find the mean values of the logarithmic SFRs: (SFR) [ yr for the HS model and for the LS model. In comparison to the result (Figure 8(a)) for galaxies without any threshold on HI column density of gaseous disk, it appears that in the range of the SFRs yr-1 the HS model predicts the smaller number fractions than those of galaxies. This suggests that the galaxies with low SFRs do not significantly contribute to DLA galaxies but they do for sub-DLA galaxies.
Figure 12(b) shows the distribution functions of sub-DLA galaxies as a function of the logarithmic SFR for the HS model (solid line) and the LS model (dashed line). We find that the mean values of the logarithmic SFRs, (SFR) [ yr for the HS and the LS models. The mean values show little difference between the two models. For the HS model, sub-DLA galaxies are composed primarily of galaxies with low SFRs ( yr-1), which is in contrast with the result for DLA galaxies where the SFRs are high ( yr-1). This stems from the fact that sub-DLA galaxies consist mainly of the less massive galaxies while DLA systems consist mainly of massive ones (Figure 9(a)). We also find that there is no significant difference between the number fractions of sub-DLA galaxies and galaxies in the range of the SFRs, yr-1 (Figure 8(a)).
5.5. Luminosity
In Figure 13, we show the -band luminosity distribution as a function of HI mass of sub-DLA galaxies for (a) the HS model and (b) the LS model. The average luminosities with error bars are shown as solid lines. Our results show that massive sub-DLA galaxies are luminous in the -band. We find that sub-DLA galaxies have the optical luminosities that range widely up to , with the mean values of the band luminosities for the HS model and for the LS model. The mean luminosities in the band differ little because the mean SFR for the LS model matches that for the HS model (Figure 12(b)). In the - plane, the luminosity distributions of sub-DLA galaxies are clearly different for the two models. For the LS model, sub-DLA galaxies with low HI-mass exhibit low -band luminosities down to while for the HS model there are no sub-DLA galaxies with luminosities . This difference is attributable to the fact that, for the LS model, the number fractions of sub-DLA galaxies with low SFRs are larger than those for the HS model (Figure 12(b)). In addition to the H luminosities, the -band luminosities of sub-DLA galaxies are a good probe to investigate the SFRs in less massive galaxies. Together with previous results, we conclude that sub-DLA galaxies, which typically comprise less massive systems ( and ), are compact ( kpc) and optically faint ().
6. Discussion
6.1. HI Mass Functions
Our models produce a good match to the HIMFs given by various blind radio surveys as shown in Figure 2. However, it appears that the HS model slightly underpredicts the number densities at the low-mass end. A different model that adopts a different threshold for the halo circular velocity of less than km s-1 may provide better agreement with the observations.
As argued in Section 5, the suppression of forming dwarf galaxies in halos with small circular velocities may be caused by the ionizing background radiation. Because the radiation intensity remains uncertain at low redshift, this may allow to adopt a threshold smaller than km s-1 for calculating the HIMF. The circular velocity threshold , which gives the lowest circular velocity for galactic halos, sensitively depends on the intensity of UV radiation and the reionization process. Thus, the threshold should affect the number of less massive galaxies and the shape of HIMFs. For example, Somerville (2002) investigated the effect of suppressing the formation of less massive galaxies due to the squelching of gas infall by the ionizing background radiation in order to resolve the excess number of dwarf galaxies predicted by a semi-analytic model. They find that halos with km s-1 are not able to accrete gas. This suggests that photoionization squelching suppresses formation of less massive galaxies in halos with km s-1. However, Okamoto et al. (2008) argued that, in Somerville (2002), the fitting function, concerning accreted gas in a halo, overestimates the mass of the halo within which gas can cool. On the basis of the result obtained by the numerical simulation, the authors require the threshold to be less than km s-1. For the HS model in our calculation, adopting a small threshold of km s-1 may produce an increase of less massive galaxies and give better agreement with the observed abundance at the low-mass end of HIMFs.
The underestimate of HIMFs at low-mass end might also be caused by the shape of the adopted halo mass function used here. In this calculation, we adopt a mass function of dark halo progenitors given by an extended Press–Schechter formalism. The results of the numerical simulations show some discrepancies between the mass function of dark halos and those given by the extended Press-Schechter formalism, in particular for those at the low mass end (e.g., Somerville et al. 2000; Yahagi, Nagashima & Yoshii 2004; Li et al. 2007). Although no definite conclusion has yet been reached regarding which mass functions should be adopted here, this may cause an underestimation of the number densities of less massive galaxies at .
It should be noted that there are uncertainties in the determination of the HIMF slope from observations. The low-mass end of the HIMF suffers from statistical uncertainties due to the small sample size. For example, the ADBS sample includes only a dozen galaxies and the HIPASS does galaxies with . Additionally, there are also uncertainties in the distance estimation (Masters et al., 2004). However, the HIMF slope should place stringent constraints on the formation of dwarf galaxies as well as the optical luminosity function. This is a clear point that deserves further investigation.
It is also valuable to note the total HI mass density parameter, that is the HI mass density of galaxies as a fraction of the cosmic critical density. We find for the HS model and for the LS model. In comparison to the observations, we find that the HI mass density parameter for the HS model is consistent with the HIPASS measurement (Zwaan et al., 2005a).
6.2. Number Densities
Here we address the number density per unit redshift . Our results present of DLA galaxies at for the HS model and for the LS model. The LS model produces larger than the HS model because, for the LS model the low SFRs in DLA galaxies cause high HI column densities above the DLA threshold. In observations, the ADBS sample for DLA galaxies at yields (Rosenberg & Schneider, 2003), the HIPASS (Ryan-Weber, Webster & Staveley-Smith, 2003) and (Zwaan et al., 2005b). These are consistent with our results. Because our models reproduce the and cross sections, our result suggests that, even in the case that less-massive DLA galaxies () are taken into account, DLA systems at arise primarily in galactic disks rather than tidal gas caused by galaxy interactions or gas driven by galactic winds.
Furthermore, our models predict of sub-DLA galaxies: for the HS model and for the LS model. These are roughly times larger than those of DLA galaxies. We also find that there is no difference between the sub-DLA for the two models. The reason is considered as follows. At a given redshift, the is described as , where is the number fraction of sub-DLA galaxies to galaxies, is the number density of galaxies, and is the cross section of the galactic disk. We showed that there is little difference in the cross-sections between the models. However, for the HS model, the number fractions of sub-DLAs are larger than those for the LS model, while the LS model produces the number densities higher than those of the HS model. This results in no significant difference between the values and for the two models. Our result is also consistent with an estimation of at redshift on the basis of an analysis of the HI column density distributions of high-redshift sample (Proux et al., 2005).
6.3. Further Implications
Many ideas concerning the nature of DLA systems have been proposed through observational/theoretical studies: large, massive spiral galaxies (e.g., Wolfe et al. 1986), gas-rich dwarf galaxies (e.g., York et al. 1986), proto-galactic infalling gas that is not virialized (e.g., Haehnelt et al. 1998), and so on. Although it is not clear which scenarios are valid, a dramatic change in the nature of DLAs may occur at redshift from the results of the numerical simulations (e.g., Gardner et al. 2001; Nagamine et al. 2004, 2007) and semi-analytic models (e.g., Kauffmann 1996; Maller et al. 2001; Okoshi et al. 2004; Okoshi and Nagashima 2005; Johansson and Efstatiou 2006). At redshift , the radio observations suggest that compact HI objects () mainly exhibit the HI column densities comparable to those of DLA systems. They are consistent with our results showing that compactly bound systems including less massive ones () show the basic properties of DLA systems.
If the compactly bound objects also comprise sub-DLA galaxies, how can they be detected in the observations? In future, when the large samples including less massive galaxies at become available, it is probable to identify them as sub-DLA galaxies rather than DLA ones. The HI-selected samples have an advantage in terms of detectability of the optical counterparts over those of quasar absorption systems, sub-DLA systems. Because the HI-selected samples provided by the blind surveys are not behind bright background quasars, they do not suffer from the masking effect. No glare of background quasars does not prevent from the detection of weak optical emission lines from the HI-selected galaxies if their surface brightness is very low. If the host galaxies of sub-DLA systems are compact, the masking effect would be serious in the searches particularly for the optical counterparts of sub-DLA systems just as much as DLA systems. In the optical surveys for less massive galaxies (), it would be quite valuable to pay attention to some of the difficulties in detecting the sub-DLA hosts due to the compactness and the faintness.
Some observations suggest that a sub-DLA host comprises compact and less massive systems (). For example, Tripp et al. (2005) explored a nearby sub-DLA system with at on the periphery of the Virgo Cluster by using the Space Telescope Imaging Spectrograph on board the Hubble Space Telescope. They argue that they could not find any bright galaxies in the proximity of the line of sight toward the background quasar PG1216+019. The nearest galaxy is a sub- galaxy with a projected distance of kpc. However, a radio observation successfully detected the radio emissions using the Westerbrock Synthesis Radio Telescope (Briggs & Barnes, 2006). The emission feature is very compact; it is located within arcsec ( kpc) of the quasar sight line. They argue that, because the velocity spread of the emission line is between and km s-1, the radio emission feature indicates the HI masses, . The result also suggests that compactly bound objects will be identified as the host galaxies of sub-DLA systems. Indeed, it may not be surprising that sub-DLA galaxies are very optically faint, consistent with our result, e.g., the mean luminosity in the band is at for the LS model. This observation agrees with our prediction that sub-DLA galaxies with low HI-masses are very faint and compactly bound objects.
Sub-DLA systems may be associated with high velocity clouds (HVCs). Some radio observations show that the HVCs near M31 and M33 have typical HI column densities of - cm-2, HI masses of - and sizes of kpc (Westmeier, Braun & Thilker, 2005; Grossi et al., 2008). On the basis of estimates of the dynamical and virial masses, the HVCs are likely gravitationally bounded systems. For HI clouds in the Milky-Way halo, some of the absorption features in the spectra toward the background quasars are similar to those of intervening quasar absorption systems (Ben Bekhti et al., 2008). These properties are consistent with those of sub-DLA systems predicted by our models. It is probable that these systems are the sub-DLA hosts. To reveal the sub-DLA hosts, it needs to statistically compare the radio characteristics of the HVCs with the properties of intervening HI absorption systems toward quasar/gamma-ray burst.
Further investigation of the sub-DLA hosts requires a large sample of less massive objects (), which would be the candidates for sub-DLA galaxies. Indeed, a program aimed at obtaining a census of such less massive objects in a radio survey is now on going. A recent HI blind survey, the Arecibo Legacy Fast ALFA (ALFALFA) Survey, aims to detect on the order of extragalactic HI emission sources out to including ones with HI masses by covering deg2 of sky (Giovanelli et al., 2005). This survey is specifically designed to determine the basic properties of HI-selected galaxies statistically, including the determination of the HIMF, particularly at the faint end (). In conjunction with optical studies, the ALFALFA survey will provide us with the basic properties of the optically faint and less massive galaxies including several results presented here: the SFR- relation, the relationship between HI cross section and , and the HI diameter function. The ALFALFA survey is able to map the peripheries of HI-selected galaxies to a HI column-density limit on the order of cm-2 that corresponds to the threshold of the sub-DLA systems. This means that the survey also provides valuable opportunities for exploring the nature of quasar absorption systems, e.g., sub-DLA systems. In the near future, comprehensive studies based on large samples of low HI-mass objects will reconcile the local galaxy population with the quasar absorption systems.
7. Conclusion
We have investigated the properties of HI-selected galaxies in comparison with quasar absorption systems
at redshift within a hierarchical galaxy formation scenario using a semi-analytic model.
By drawing a detailed comparison between the properties of the HI-selected galaxies and the HI absorption
systems, we find that DLA galaxies consist primarily of optically-faint, compactly bound-systems.
Furthermore, for the purpose of reconciling the quasar absorption system with the galaxy population, we
have investigated the properties of local HI-selected galaxies. The main conclusions are summarized as follows.
1. The SFRs in HI-selected galaxies correlate tightly with the HI masses, SFR
, in the range of HI mass
(Figure 7). The SFR ranges widely from
to yr-1 with the mean logarithmic SFR
SFR [ yr (Figure 8). In contrast, the relationship
between the -band luminosity and the HI mass is quite broad (Figures 5 and 6).
2. There is no statistically significant difference between HI mass functions of DLA galaxies and galaxies at
(Figure 2). This suggests that DLA galaxies correspond
primarily to HI-selected galaxies detected in blind radio surveys at
(Figure 4).
3. Sub-DLA galaxies will replace DLA ones as the dominant population (Figure 9) at the low-mass end
(). The number fractions of sub-DLA galaxies to galaxies are
between and at and between and at
. If the detection limits on the HI mass in the blind radio surveys
are low enough to detect less massive systems (), the
population detected by the surveys will switch to being dominated by sub-DLA galaxies instead of DLA ones.
In addition to being a good probe of DLA systems, the HI-selected galaxies can be a strong probe of sub-DLA
systems.
References
- Bardeen et al. (1986) Bardeen, J. M., Bond, J. R., Kaiser,N. & Szalay,A. S. 1986, ApJ, 304, 15
- Barnes & Haehnelt (2009) Barnes, L.A., & Haehnelt, M.G. 2009, MNRAS, 397, 511
- Ben Bekhti et al. (2008) Ben Bekhti, N., Richter, P., Westmeier, T., & Murphy, M.T. 2008, A&A, 487, 583
- Benson et al. (2002) Benson,A.J., Lacey,C.G., Baugh,C.M., Cole,S., & Frenk,C.S. 2002, MNRAS, 333, 156
- Blanton et al. (2005) Blanton, M.R., et al. 2005, ApJ, 631, 208
- Bond et al. (1991) Bond, J. R., Cole, S., Efstathiou,G., & Kaiser, N. 1991, ApJ, 379, 440
- Bouché et al. (2001) Bouché, N., Lowenthal, J. D., Chrarlton, J. C., Bershady, M. A., Churchill, C. W., & Steidel, C. C. 2001, ApJ, 550, 585
- Bowen, Tripp & Jenkins (2001) Bowen, D. V., Tripp, T. M., & Jenkins, E. B. 2001, AJ, 121, 1456
- Bower (1991) Bower, R. 1991, MNRAS, 248, 332
- Briggs & Barnes (2006) Briggs, F.H. & Barnes, D.G. 2006, ApJ, 640, L127
- Bullock, Kravtsov & Weinberg (2000) Bullock, J.S., Kravtsov, A.V., & Weinberg, D.H. 2000, ApJ, 539, 517
- Christensen et al. (2005) Christensen, L., Schulte-Ladbeck, R.E., Sanchez, S.F., Becker, T., Jahnke, K., Kelz, A., Roth, M.M., & Wisotzki, L. 2005, A&A, 429, 477
- Chen & Lanzetta (2003) Chen, H-W.,& Lanzetta, K. M. 2003, ApJ, 597, 706
- Chun et al. (2006) Chun, M.R., Gharanfoli, S., Kulkarni, P., & Takamiya, M. 2006, AJ, 131, 686
- Corbelli & Salpter (1993) Corbelli, E., & Salpter, E.E. 1993, ApJ, 419, 104
- Dessauges-Zavadsky et al. (2003) Dessauges-Zavadsky, M., Proux, C., Kim, T-S., M., D’Odorico, S., & McMahon, R.G. 2003, MNRAS, 345, 447
- Doyle & Drinkwater (2006) Doyle, M.T. & Drinkwater, M.J. 2006, MNRAS, 372, 977
- Doyle et al. (2005) Doyle, M.T. et al. 2005, MNRAS, 361, 34
- Fynbo et al. (2003) Fynbo, J. P. U., Ledoux, C., Møller, P., Thomsen, B., & Burud, I. 2003, A&A , 407, 147
- Gardner et al. (2001) Gardner, J.P., Katz, N., Hernquist L., & Weinberg, D.H. 2001, ApJ, 559, 131
- Garnett (2002) Garnett, D.R. 2002, ApJ, 581, 1019
- Gharanfoli et al. (2007) Gharanfoli, S., Kulkarni, V., Chun, M.R., & Takamiya, M. 2007, AJ, 133, 130
- Giovanelli et al. (2005) Giovanelli, R.G., et al. 2005, AJ, 130, 2598
- Gnedin (2000) Gnedin, N.Y. 2000, ApJ, 542, 535
- Grossi et al. (2008) Grossi, M., Giovanardi, C., Corbelli, E., Giovanelli, R., Haynes, M.P., Martin, A.M., Saintonge, A., & Dowell, J.D. 2008, A&A, 487, 161
- Haehnelt et al. (1998) Haehnelt, M., Steinmetz, M., & Rauch, M. 1998, ApJ, 495, 647
- Henning et al. (2000) Henning, P.A. et al. 2000, AJ, 119, 2686
- Hoeft et al. (2006) Hoeft, M., Yepes, G., Gottlber, S., & Springel, V. 2006, MNRAS, 371, 401
- Huchtmeier & Richter (1988) Huchtmeier, W. K. & Richter, O.G. 1988, A&A, 203, 237
- Johansson & Efstathiou (2006) Johansson, P.H., & Efstathiou, G. 2006, MNRAS, 371, 1519
- Katz et al. (1996) Katz, N., Weinberg, D.H., Hernquist, L., & Miralda-Escud, J. 1996, ApJ, 457, L57
- Kauffmann (1996) Kauffmann, G. 1996, MNRAS, 281, 475
- Kennicutt (1983) Kennicutt, R.C., Jr. 1983, ApJ, 272, 54
- Kennicutt (1998) Kennicutt, R.C., Jr. 1998, ARA&A, 36, 189
- Khare et al. (2007) Khare, P., Kulkarni, V.D.,Proux, C., York, D.G., Lauroesch, J.T., & Meiring, J.D. 2007, A&A, 464, 487
- Kitayama & Ikeuchi (2000) Kitayama, T., & Ikeuchi, S. 2000, ApJ, 529, 615
- Koribalski et al. (2004) Koribalski, B.S., et al. 2004, AJ, 128, 16
- Kulkarni et al. (2007) Kulkarni, V.D., Khare, P., Proux, C., York, D.G., Lauroesch, J.T., & Meiring, J.D. 2007, ApJ, 661, 88
- Lacey & Cole (1993) Lacey, C. G., & Cole, S. 1993, MNRAS, 262, 272
- Lacy et al. (2003) Lacy,M., Becker, R.H., Storrie-Lombardi, L.J. 2003, AJ, 126, 2230
- Le Brun et al. (1997) Le Brun, V., Bergeron, J., Boissé, P., & Deharveng. J. M. 1997, A&A, 321, 733
- Li et al. (2007) Li, Y., Mo, H.J., van den Bosch, F.C., & Lin, W.P. 2007, MNRAS, 379, 689
- Maller et al. (2001) Maller, A. H., Prochaska, J. X., Somerville, R. S., & Primack, J. R. 2001, MNRAS, 326, 1475
- Maloney (1993) Maloney, P. 1993, ApJ, 414, 41
- Masters et al. (2004) Masters, K.L., Haynes, M.P., & Giovanelli, R. 2004, ApJ, 607, L115
- Meiring et al. (2008) Meiring, J.D., Kulkarni, V.P., Lauroesch, J.T., Proux, C., Khare, P., York, D.G., & Crotts, A.P.S. 2008, MNRAS, 384, 1015
- Meiring et al. (2007) Meiring, J.D., Lauroesch, J.T., Kulkarni, V.P., Proux, C., Khare, P., York, D.G., & Crotts, A.P.S. 2007, MNRAS, 376, 557
- Meurer et al. (2006) Meurer, G. R. et al. 2006, ApJS, 165, 307
- Meyer et al. (2004) Meyer, M.J., et al. 2004, MNRAS, 350, 1195
- Minchin et al. (2004) Minchin, R.F., et al. 2003, MNRAS, 346, 787
- Møller, Fynbo & Fall (2004) Møller, P., Fynbo, J. P. U., & Fall, S. M. 2004, A&A, 422, L33
- Møller et al. (2002) Møller, P., Warren, S. J., Fall, S. M., Fynbo, J. P. U., & Jakobsen, P. 2002, ApJ, 574, 51
- Nagamine et al. (2004) Nagamine, K., Springel, V., & Hernquist, L. 2004, MNRAS, 348, 421
- Nagamine et al. (2007) Nagamine, K., Wolfe, A.M., Hernquist, L., & Springel, V. 2007, ApJ, 660, 945
- Nagashima, Gouda & Sugiura (1999) Nagashima, M., Gouda,N., & Sugiura N. 1999, MNRAS, 305, 449
- Nagashima et al. (2001) Nagashima, M., Totani, T., Gouda,N., & Yoshii, Y. 2001, ApJ, 557, 505
- Navarro & Steinmetz (1997) Navarro, J.F., & Steinmetz, M. 1997, ApJ, 478, 13
- Okamoto, Gao & Theuns (2008) Okamoto, T., Gao, L., & Thuens, T. 2008, MNRAS, 390, 920
- Okoshi & Nagashima (2005) Okoshi, K.,& Nagashima,M. 2005, ApJ, 623, 99 (Paper II)
- Okoshi et al. (2004) Okoshi, K., Nagashima, M., Gouda, N., & Yoshioka S. 2004, ApJ, 603, 12 (Paper I)
- O’Meara et al. (2007) O’Meara, J.M., Prochaska, J.X., Burles, S., Prochter, G., Bernstein, R.A., & Burgess, K.M. 2007, ApJ, 656, 666
- O’Neil, Oey & Bothun (2007) O’Neil, K., Oey, M.S., & Bothun, G. 2007, AJ, 134, 547
- Proux et al. (2005) Proux, C., Dessauges-Zavadsky, M., D’Odorico, S., Kim, T-S., & McMahon. R.G. 2005, MNRAS, 363, 479
- Proux et al. (2006) Proux, C., Dessauges-Zavadsky, M., D’Odorico, S., Kim, T-S., & McMahon, R.G. 2006, MNRAS, 372, 369
- Proux et al. (2007) Proux, C., Dessauges-Zavadsky, M., D’Odorico, S., Kim, T-S., & McMahon, R.G. 2007, MNRAS, 382, 177
- Proux et al. (2003) Proux, C., McMahon, R.G., Storrie-Lombaridi, L.J., & Irwin M.J. 2003, AJ, 346, 1103
- Pontzen et al. (2008) Pontzen, A., et al. 2008, MNRAS, 390, 1349
- Press & Schechter (1974) Press, W., & Schechter, P. 1974, ApJ, 187, 425
- Prochaska et al. (2006) Prochaska, J.X., O’Meara, J.M., Herbert-Fort, S., Burles, S., Prochter, G.E., & Bernstein, R.A. 2006, ApJ, 648, L97
- Prochaska & Wolfe (1997) Prochaska, J.X., & Wolfe, A.M. 1997, ApJ, 487, 73
- Quinn, Katz & Efstathiou (1996) Quinn, T., Katz, N., & Efstathiou, G. 1996, MNRAS, 278, L49
- Rahman et al. (2007) Rahman, N., Howell, J.H., Helou, G., Mazzarella, J.M., & Buckalew, B. 2007, ApJ, 663, 908
- Rao & Briggs (1993) Rao, S. M., & Briggs, F. 1993, ApJ, 419, 515
- Rao et al. (2003) Rao, S. M., Nestor, D.B., Turnshek,D. A., Lane, W. M., Monier E. M.,& Bergeron, J. 2003, ApJ, 595, 94
- Rao & Turnshek (1998) Rao, S. M., & Turnshek, D. A. 1998, ApJ, 500, L115
- Rao & Turnshek (2000) Rao, S. M., & Turnshek, D. A. 2000, ApJS, 130, 1
- Razoumov et al. (2008) Razoumov, A.O., Norman, M.L., Prochaska, J.X., Sommer-Larsen, J., Wolfe, A.M., & Yang, Y. 2008, ApJ, 683, 149
- Razoumov et al. (2006) Razoumov, A.O., Norman, M.L., Prochaska, J.X., & Wolfe, A.M. 2006, ApJ, 645, 55
- Rosenberg & Schneider (2000) Rosenberg,J.L., & Schneider,S.E. 2000, ApJS, 130, 177
- Rosenberg & Schneider (2002) Rosenberg, J.L., & Schneider, S.E. 2002, ApJ, 567, 247
- Rosenberg & Schneider (2003) Rosenberg, J.L., & Schneider, S.E. 2003, ApJ, 585, 256
- Rosenberg, Schneider & Posson-Brown (2005) Rosenberg,J.L., Schneider, S.E. & Posson-Brown, J. 2005, AJ, 129, 1311
- Ryan-Weber, Webster & Staveley-Smith (2003) Ryan-Weber, E.V., Webster, R.L. & Staveley-Smith, L. 2003, MNRAS, 343, 1195
- Sage (1993) Sage, L.J. 1993, A&A, 272, 123
- Schulte-Ladbeck et al. (2004) Schulte-Ladbeck, R.E.,Rao, S.M., Drozdovsky, I.O., Turnshek, D.A., Nestor, D.B., & Pettini, M. 2004, ApJ, 600, 613
- Somerville (2002) Somerville,R.S. 2002 ApJ, 572, L23
- Somerville et al. (2000) Somerville, R. S., Lemson, G., Kolatt,T.S., & Dekel, S. 2000, MNRAS, 316, 479
- Somerville & Kolatt (1999) Somerville, R. S., & Kolatt,T.S. 1999, MNRAS, 305, 1
- Spitzak & Schneider (1998) Spitzak,J.G., & Schneider,S.E. 1998, ApJS, 119, 159
- Springob, Haynes & Giovanelli (2005) Springob, C.M., Haynes, M.P, & Giovanelli, R. 2005, ApJ, 621, 215
- Steidel et al. (1997) Steidel, C. C., Dickinson, M., Meyer, D. M., Adelberger, K. L., & Sembach, K. R. 1997, ApJ, 480, 568
- Steidel et al. (1994) Steidel, C. C., Pettini, M., & Persson, S. E. 1994, AJ, 108, 2046
- Sutherland & Dopita (1993) Sutherland, R., & Dopita, M.A. 1993, ApJS, 88, 253
- Tescari et al. (2009) Tescari, E., Viel, M., Tornatore, L., & Borgani, S. 2009, MNRAS, 397, 411
- Thoul & Weinberg (1996) Thoul, A.A., & Weinberg, D.H. 1996, ApJ, 465, 608
- Tripp et al. (2005) Tripp, T.M., Jenkins, E.B., Bowen, D.V., Prochaska, J.X., Aracil, B., & Ganguly, R. 2005, ApJ, 619, 714
- Turnshek et al. (2001) Turnshek, D.A., Rao, S., Nestor, D., Lane, W., Monier, E., Bergeron, J., & Smette, A. 2001, ApJ, 553, 288
- van Zee et al. (1997) van Zee, L., Haynes, M.P., Salzer, J.J., & Broeils, A.H. 1997, AJ, 113, 1618
- Walter et al. (2008) Walter, F., Brinks, E., de Blok, W.J.G., Bigiel, F., Kennicutt, R.C., Thornley, M.D., & Leroy, A. 2008, AJ, 136, 2563
- Warren, Jerjen, & Koribalski (2006) Warren, B.E., Jerjen, H., & Koribalski, B.S. 2006, AJ, 131, 2056
- Warren et al. (2001) Warren, S. J., Møller, P., Fall, S. M., & Jakobsen, P. 2001, MNRAS, 326, 759
- Weinberg, Hernquist, & Katz (1997) Weinberg, D.H., Hernquist, L., & Katz, N. 1997, ApJ, 477, 8
- Westmeier, Braun & Thilker (2005) Westmeier, T., Braun, R., & Thilker, D. 2005, A&A, 436, 101
- Wolfe et al. (1986) Wolfe, A. M., Turnshek, D. A., Smith, H. E., & Cohen, R. D. 1986, ApJS, 61, 249
- Yahagi, Nagashima, & Yoshii (2004) Yahagi, H., Nagashima, M., & Yoshii, Y. 2004, ApJ, 605, 709
- York et al. (1986) York, D.G., Dopita, M., Green, R., & Bechtold, J. 1986, ApJ, 311, 610
- York et al. (2006) York, D.G., et al. 2006, MNRAS, 367, 945
- Zwaan et al. (1997) Zwaan, M.A., Briggs, F.H., Sprayberry, D., & Sorar, E. 1997, ApJ, 490, 173
- Zwaan et al. (2005a) Zwaan, M.A., Meyer, M.J., Staveley-Smith, L., & Webster, R.L. 2005a, MNRAS, 359, L30
- Zwaan et al. (2005b) Zwaan, M.A., van der Hulst, J.M., Briggs, F.H., Verheijen., M.A.W., & Ryan-Weber., E.V. 2005b, MNRAS, 364, 1467
- Zwaan et al. (2008) Zwaan, M.A., Walter, F., Ryan-Weber., E.V., Brinks, E., de Blok, W.J.G., & Kennicutt, R.C. 2008, AJ, 136, 2886
- Zwaan et al. (2003) Zwaan, M.A. et al. 2003, ApJS, 125, 2842