Preparation to the CMB PLANCK data analysis, estimation of the contamination due to the galactic polarized emissions
Abstract:
This work is point of the preparation to the analysis of the PLANCK satellite data. The PLANCK satellite is an ESA mission which has been launched the 14th of may 2009 and is dedicaced to the measurement of the Cosmic Microwave Background (CMB) in temperature and polarization. The presence of diffuse Galactic polarized emissions disturb the measurement of the CMB anisotropies, in particular in polarization. Therefore a precise knowledge of these emissions is needed to obtain the level of accuracy required for PLANCK. In this context, we have developed and implemented a coherent 3D model of the two mains polarized Galactic emissions : synchrotron and thermal dust. We have compared these models to preexisting data: the 23 GHz band of the WMAP data, the 353 GHz Archeops data and the 408 MHz all-sky continuum survey. We extrapolate these models to the frequencies where the CMB dominates and we are able to estimate the contribution of polarized foreground emissions to the polarized CMB emission measured with PLANCK.
1 Introduction
The PLANCK satellite, currently in flight, should give the more accurate measurement of the anisotropies of the CMB in temperature and polarization with a sensitivity of and an angular resolution of 5 arcmin [3]. In particular its estimation of the BB-modes should set an upper limit on the tensor-scalar ratio (expected at 0.1 [7]). The knowledge of this ratio should confirm the existence of primordial gravitational waves generated during the inflation and would set the energy scale of the inflation [15] and provide constraint on inflationnary models [1]. In order to obtain its optimal sensitivity it is required to estimate the foreground emissions and the residual contamination due to these foreground emissions on the CMB signal. Indeed for the full sky these emissions have the same order of magnitude than the CMB in temperature and dominate by a factor of 10 in polarization [3]. The principal polarized Galactic microwave emissions come from 2 effects : thermal dust emission and synchrotron emission. The synchrotron has already been measured by the 408 MHz all-sky continuum survey [11], by Leider between 408 MHz and 1.4 GHz [25], by Parkes at 2.4 GHz [6], by the MGLS Medium Galactic Latitude Survey at 1.4 GHz [24] and by the satellite WMAP Wilkinson Microwave Anisotropies Probe (see e.g. [12]). The synchrotron emission is due to ultrarelativist electrons spiraling in a large-scale magnetic field and is dominant at low frequencies. The dust thermal emission which have already been well constrained by IRAS [21], COBE-FIRAS [4] and Archeops [16, 2] is due to dust grains which interact with the Galactic magnetic field and emit a polarized submillimetric radiation [4] and dominates at high frequencies. The polarization of these two radiation is orthogonal to the field lines. To obtain a realistic model of these emissions we propose models based on a 3D modelling of the Galactic magnetic field and of the matter density in the Galaxy. The models are optimized using preexisting data and then are used to estimate the bias due to these emissions on the CMB measurement.
2 3d modelling of the Galaxy
A polarized emission is described by the Stokes parameters I, Q and U [14]. For the polarized foreground emissions integrating along the line of sight we obtain, for synchrotron [20]:
| (1) | |||||
| (2) | |||||
| (3) |
where , and are the magnetic field components along, longitudinal and transverse to the ligne of sight. is the polarization fraction set to 75% [20]. is a template temperature map obtained from the 408 MHz all-sky continuum survey [11]. The maps are extrapolated to the Planck frequencies using the spectral index which is a free parameter of the model.
For the thermal dust emission :
| (4) | |||||
| (5) | |||||
| (6) |
where the polarization fraction is set to 10 % [19],
is the spectral index (set at 2.0) and is an
empiric factor, fit to the Archeops data. The
map is the model 8 of [8].
The models are based on a exponential distribution of relativistic electrons on the Galactic disk following [5] where the radial scale is a free parameter. The distribution of dust grains is also choose exponential [2]. The Galactic magnetic field is composed of two parts: a regular component and a turbulent component. The regular component is based on the WMAP team model [18] which is close to a logarithmic spiral to reproduce the shape of the spiral arms [9, 22]. The pitch angle between two arms is a free parameter of the model. The turbulent component is described by a law of Kolmogorov [9, 10] spectrum of relative amplitude .
3 Comparison to data
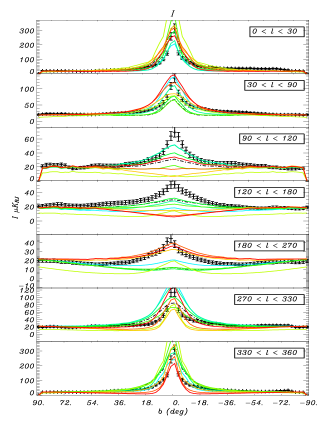
We computed Galactic profiles in temperature and polarization for various bands of longitude and latitude and various values of the free parameters. In order to optimize these 3D models we compare them to Galactic profiles computed from preexisting data using a test. For the synchrotron emission in temperature, we use the 408 MHz all-sky continuum survey [11] as shown on Figure 1. In polarization we compared to the K-band WMAP 5 years data. Thermal dust emission model is optimized using the polarized Archeops data [2] at 353 GHz.
The best fit parameters for the 3D model in polarization
are given in the Table 1. The results are consistent for
the 3 sets of data, and in particular we obtain compatible results
for the synchrotron and thermal dust emission models. is
not strongly constrained but its range of best fit value is compatible
with previous results [23, 17, 10].
is badly constrained as was already the case in Sun et al [23]. The
best fit value of the pitch angle is compatible with results
obtained by other study [23, 18].
The best fit value for the spectral index of the synchrotron
emission is lower than value found by [23, 18] but it is
probably due to the choice of normalisation using the 408 MHz template.
| (95.4 % CL) | (95.4 % CL) | ||||
| (95.4 % CL) | |||||
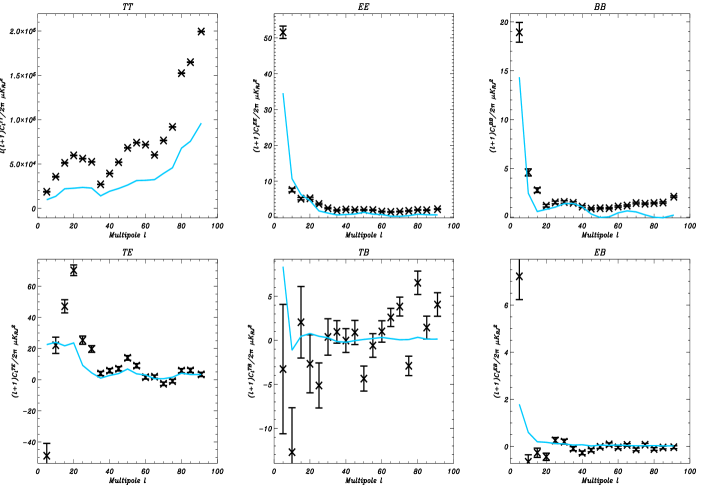
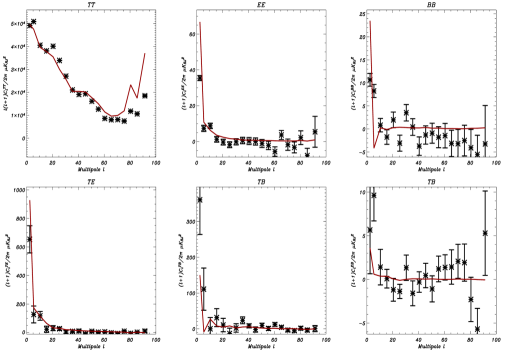
Using the best fit parameters obtained for the Galactic emissions models we computed maps and power spectra in temperature and polarization for synchrotron and dust thermal emission. We compare them to maps and power spectra built respectively using polarized WMAP and ARCHEOPS data. Like represented in the Figure 2 the synchrotron emission model is efficient to reproduce the global feature of the data in polarization. We show on Figure 3 the angular power spectra computed from the Archeops data at 353 GHz and the thermal dust model using the method presented in [19]. Our model efficient to reproduce the features of the spectra at all scales.
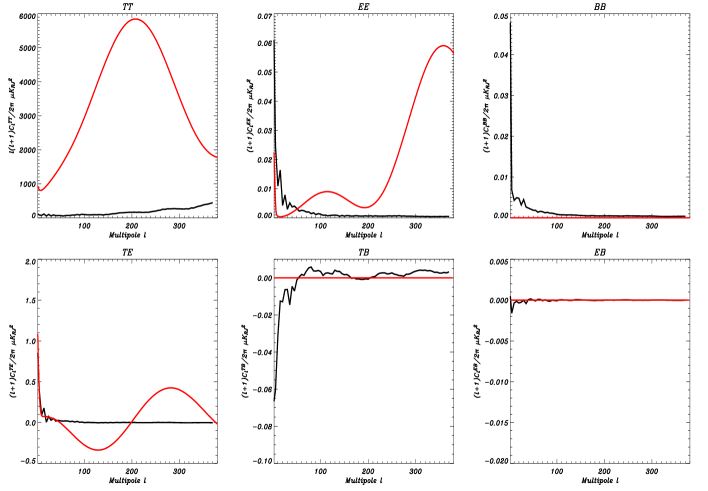
From the above best fit parameters we estimate the contamination of the CMB PLANCK data by the polarized galactic emissions. Figure 4 shows the temperature and polarization power spectra at 143 GHz for the CMB111We simulate CMB assuming cosmological parameters for a model CDM like proposed in [13] with a ratio tensor-scalar of 0.03. (red) and the Galactic foreground emissions applying a Galactic cut of . The residual foreground contamination seems to be weak but for the BB-modes for which an accurate foreground substraction is extremely important for the detection of the primordial gravitational waves.
4 Conclusions
We propose in this study consistent models of the main Galactic polarized emissions based on a 3D modelisation of the Galaxy. By comparison with preexisting data we are able to give consistent constraints on the parameters of the synchrotron and dust thermal emissions models compatibles with thus appear in the literature. From this we build map and power spectra enable to reproduce the features of the data at various frequencies. Using a rough mask we then estimate the residual contamination due to these foregrounds on the assumed CMB PLANCK data.
References
- [1] D. Baumann et al, IAP Conf.Proc., 1141 (2009).
- [2] A. Benoît et al, First detection of polarization of the Submillimeter diffuse Galactic dust emission, A&A, 424 571 (2004) [astro-ph/0306222].
- [3] The Planck Consortia, Planck : The Scientific Program, 2004.
- [4] F. Boulanger et al, A&A, 312 256 (1996).
- [5] R. Drimmel & D.N. Spergel, Three Dimensionnal Structure of the Milky Way Disk, ApJ, 556 (2001) 181 [astro-ph/0101259].
- [6] A. Duncan et al, Polarimetric structure in the First Galactic quadrant from the 2.695 GHz Effelsberg survey, A& A, 350 447 (1999).
- [7] G. Efstathiou et al, (2009), astro-ph/09024803.
- [8] D.P. Finkbeiner, M. Davis & D.J. Schlegel, ApJ, 524 867 (1999).
- [9] J.L. Han et al, A&A, 642 868 (2006).
- [10] J.L. Han, K. Ferrière & R.N. Manchester, A&A, 610 820 (2004).
- [11] C.G.T. Haslam et al, A 408 MHz all-sky continuum survey, A&AS, 47 1 (1982).
- [12] G. Hinshaw et al, Five years Wilkinson Microwave Anisotropy Probe observations: Data processings, sky maps and basics results, ApJS, 180 225 (2007).
- [13] E. Komatsu et al, Five years Wilkinson Microwave Anisotropy Probe observations: Cosmological interpretation, ApJS, 180 330 (2009).
- [14] A. Kosowsky, Ann. Phys., 246 49 (1996).
- [15] D.H. Lyth, Phys. Lett. B, 147 403 (1984).
- [16] J.-F. Macías-Pérez, G. Lagache, F. Maffei et al, A&A, 467 1313 (2007) [astro-ph/0603665].
- [17] M.-A. Miville-Deschênes et al, A&A accepted, (2008) astro-ph/08023345.
- [18] L. Page et al, ApJSS, 170 335 (2007) [astro-ph/06030450].
- [19] N. Ponthieu, J.-F. Macías-Pérez, M. Tristram et al, A&A, 444 327 (2005) [astro-ph/0501427].
- [20] G.B. Ribicki & A. Lightman, Radiative Process in the Astrophysics, New York, Wiley-Interscience, (1979).
- [21] D.J. Schlegel, D.P. Finkbeiner & M. Davies, ApJ, 500 525 (1998).
- [22] Y. Sofue, M. Fujimoto & R. Wielebinski, ARA&A, 24 259 (1986).
- [23] X.H. Sun et al, A &A manuscrit, (2008) astro-ph/0711.1572v1.
- [24] B. Uyaniker et al, A&A.S.S. accepted, 138 31 (1999) [astro-ph/9905023].
- [25] M. Wolleben et al, A&A, 448 411 (2006) [astro-ph/0510456].