Isocaling and the Symmetry Energy in the Multifragmentation Regime of Heavy Ion Collisions
Abstract
The ratio of the symmetry energy coefficient to temperature, , in Fermi energy heavy ion collisions, has been experimentally extracted as a function of the fragment atomic number using isoscaling parameters and the variance of the isotope distributions. The extracted values have been compared to the results of calculations made with an Antisymmetrized Molecular Dynamics (AMD) model employing a statistical decay code to account for deexcitation of excited primary fragments. The experimental values are in good agreement with the values calculated but are significantly different from those characterizing the yields of the primary AMD fragments.
pacs:
21.65.Ef, 24.10.-i, 24.10.Pa,25.70.Gh, 25.70.PqI. INTRODUCTION
In Fermi energy heavy ion collisions, fragments are copiously produced. The mass distributions of these fragments exhibit a power low behavior which has been discussed in terms of the Modified Fisher Model Minich82 ; Bonasera08 . The isotope distributions of these fragments play a key role in these analyses. Theoretical studies indicate that the isotope formation is governed by the free energy at the density and temperature of the emitting system. The experimental observation of isoscaling for two similar reactions with different neutron to proton ratios, N/Z, demonstrates that the free energies and therefore the yields of the fragments are also closely related to the N/Z of the emitting system Xu00 ; Tsang01 ; Botvina02 ; Ono03 . Thus the experimental yield of isotope with N neutrons and Z protons can be given by Minich82 ; Bonasera08 ; Albergo85 ; Tsang01 :
| (1) |
where is a constant and G(N,Z) is the nuclear free energy at the time of the fragment formation. and are the chemical potential of neutron and proton, and T is the temperature of the emitting source. The factor F(N,Z) is the correction factor for the feeding from the statistical decay processes. The factor, , originates from the entropy of the fragment Minich82 . The symmetry energy term in the free energy, G(N,Z), is usually expressed as:
| (2) |
where A=N+Z and is the symmetry energy coefficient which depends on the nuclear density and the temperature T of the emitting source.
From Eq.(1) , the ratio of the isotope yields for two similar reaction systems with different N/Z ratios, can be written as:
| (3) |
This relation is known as the isoscaling relation. The isoscaling parameters, and ) are the differences of the neutron or proton chemical potentials between the systems 1 and 2, divided by the temperature. C is a constant. System 1 is normally taken as the more neutron rich of the two.
As discussed in refs. Botvina02 ; Moretto08 ; Ono04_1 , the isoscaling parameters and the symmetry energy coefficient are closely related. For a multifragmentation regime, as pointed out in ref. Ono04_1 , this relation is given by:
| (4) |
where for the two reaction systems and is the average mass number of isotopes for a given Z.
There are two issues for the determination of the values in Eq.(4). One is the source temperature T. Since the beginning of the experimental study of heavy ion collisions in the multifragmentation regime, significant efforts have been made to extract the source temperature, but different methods of temperature extraction can lead to different results and uncertainties still remain Kelic06 . Another issue is the effect of the secondary decay process, expressed by F(N,Z) in Eq.(1). In experiments fragments have typically cooled down to the ground state before they are detected. Indeed, in previous works, excitation energies of the primary fragments have been evaluated by studying the associated light charged particle multiplicities Marie98 ; Hudan03 . Such data raise the question of the degree of confidence for the experimentally extracted symmetry energy coefficient, in which this important effect is not properly corrected. In fact in a separate paper using the same data set presented here we have demonstrated that the secondary decay processes significantly effect the isobaric yield ratios and the experimentally extracted symmetry energy coefficient Huang10 . In this paper, we focus on the relation between the ratio and isoscaling parameters and between the ratio and the widths of the isotope distributions. The experimentally extracted values of extracted from both observables are compared to those extracted from the model calculations.
II. EXPERIMENT
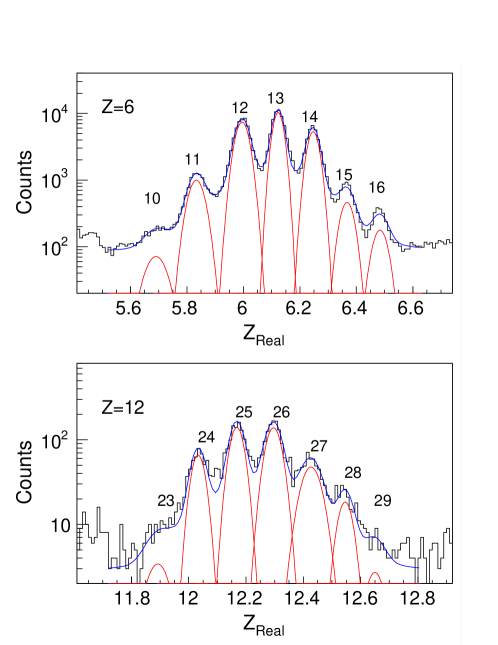
The experiment was performed at the K-500 superconducting cyclotron facility at Texas AM University. 64,70Zn and 64Ni beams were used to irradiate 58,64Ni, 112,124Sn, 197Au and 232Th targets at 40 A MeV. Intermediate mass fragments (IMFs) were detected by a detector telescope placed at 20∘. The telescope consisted of four Si detectors. Each Si detector was 5cm x 5cm. The nominal thicknesses were 129, 300, 1000, 1000 m. All Si detectors were segmented into four sections and each quadrant had a 5∘ opening angle in polar and azimuthal angles. Therefore the energies of the fragments were measured at two polar angles of the quadrant detector, namely = 17.5∘ 2.5∘ and = 22.5∘ 2.5∘. Typically 6-8 isotopes for a given atomic numbe up to Z=18 were clearly identified with the energy threshold of 4-10 A MeV, using the E-E technique for any two consecutive detectors. The E-E spectrum was linearized empirically. Mass identification of the isotopes were made using a range-energy table Hubert90 . In the analysis code, isotopes are identified by a parameter . For the isotope with A=2Z, = Z is assigned and other isotopes are identified by interpolation between them. Typical spectra are shown in Fig.1. The energy spectrum of each isotope was extracted by gating the isotope in a 2D plot of vs energy. The yields of light charged particles (LCPs) in coincidence with IMFs were also measured using 16 single crystal CsI(Tl) detectors of 3cm thickness set around the target. The light output from each detector was read by a photo multiplier tube. The pulse shape discrimination method was used to identify p, d, t, h and particles. The energy calibration for these particles were performed using Si detectors (50 -300 m) in front of the CsI detectors in separate runs.
The yield of each isotope was evaluated, using a moving source fit. For LCPs, three sources (projectile-like(PLF), nucleon-nucleon-like(NN) and target-like (TLF)) were used. The NN-like sources have source velocities of about a half of the beam velocity. The parameters are searched globally for all 16 angles. For IMFs, since the energy spectra were measured only at the two angles of the quadrant detector, the spectra were parameterized using a single NN-source. Using a source with a smeared source velocity around half the beam velocity, the fitting parameters were first determined from the spectrum summed over all isotopes for a given Z, assuming A=2Z. Then all extracted parameters except for the normalizing yield parameter were used for the individual isotopes. This procedure was based on the assumption that, when the spectrum is plotted in energy per nucleon, the shape of the energy spectrum is the same for all isotopes for a given Z. Indeed the observed energy spectra of isotopes are well reproduced by this method. For IMFs, a further correction was made for the background. As seen in Fig.1, the isotopes away from the stability line, such as 10C and 29Mg, have a very small yields and the background contribution is significant. In order to evaluate the background contribution to the extracted yield from the source fit, a two Gaussian fit to each isotope combined with a linear background was used. The fits are shown in Fig.1. Each peak consists of two Gaussians. The second Gaussian (about 10% of the height of the first one) is added to reproduce the shape of the valley between two isotopes. This component is attributed to the reactions of the isotope in the Si detector. The centroid of the Gaussians was set to the value calculated from the range-energy table within a small margin. The final yield of an isotope was determined by correcting the yield evaluated from the moving source fit by the ratio between the two Gaussian yields and the linear background. Rather large errors ( ) are assigned for the multiplicity of the NN source for IMFs, originating from the source fit besides the background estimation. The errors from the source fit are evaluated from the different assumptions of the parameter set for the source velocity and temperature.
III. ISOSCALING
At the top of Fig. 2, the yield ratio of Eq.(3) for the reactions 64Ni + 124Sn and 64Ni + 58Ni is plotted as a function of N. The parameter is determined by individual fits to yield ratios for isotopes with a given Z. The extracted values are plotted in the bottom of Fig. 2. As seen in the figure, the extracted parameter shows a steady decrease as Z increases for Z 4. The parameter generally shows much similar variation with increasing N, and has the opposite sign. Hereafter and are denoted as and . Isoscaling parameters, and , have been evaluated for all possible combinations between two reactions. For 18 different reactions are considered here. More than 150 different combinations have been studied.
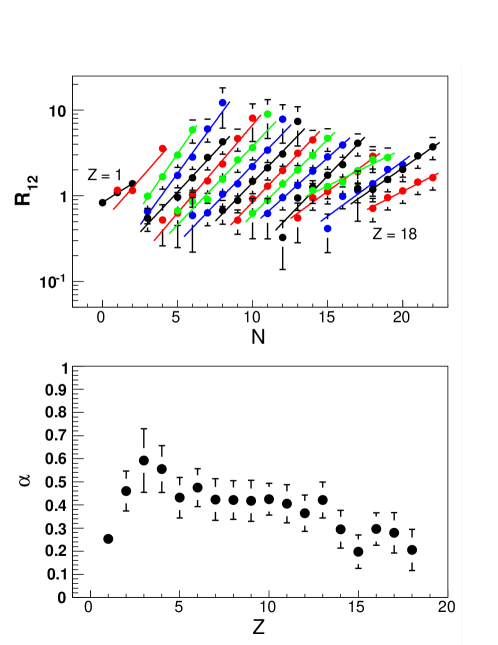
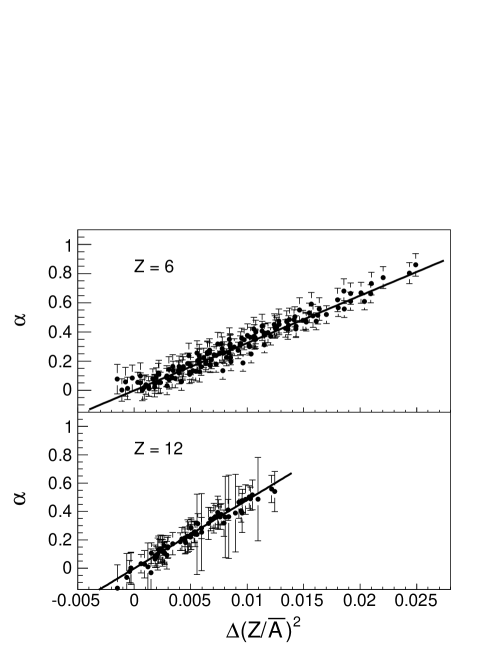
In Fig. 3 the extracted values are plotted as a function of for Z=6 and Z=12. Each data point represents a combination of two reactions. As seen in the figure, the values are linearly related to . The slope associated with this relationship increases gradually as Z increases. The correlations have been fit by a linear function for each Z and the slope values, which correspond to the value 4/T in Eq.(4), have been extracted.
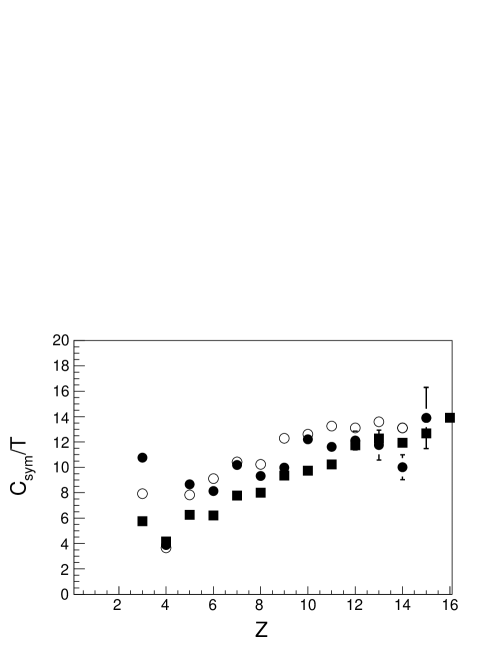
In Fig. 4 the extracted values of /T are plotted as a function of Z and shown by solid circles. A clear trend is observed for the parameter, /T. The value increases from 4 to 14 as Z increases from 4 to 15. The value for Z=3 is much larger than Z=4. This is partially caused by the isotope distribution. Since 5Li is unstable and decays before arriving to the detector, deviates from the actual centroid of the isotope distribution. An attempt has been made to fit the distribution by a Gaussian function and determine as the centroid value. This procedure makes /T around 3 for Z=3, but the uncertainty is significant, especially for neutron deficient systems. Therefore in the plot the experimental Z/ value appears without correction.
IV. SYMMETRY ENERGY AND VARIANCE OF THE ISOTOPE DISTRIBUTION
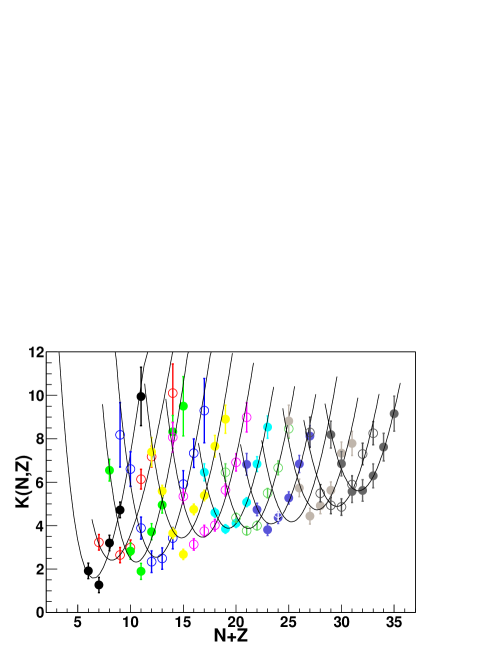
The multiplicity distributions of the isotopes for a given Z show a quadratic distribution when they are plotted on a logarithmic scale. Since the symmetry energy term is the only term proportional to (N-Z)2 in the free energy, this suggests that the variance of the distributions is closely related to the symmetry energy coefficient. In order to explore the relation between the symmetry energy term in the free energy and the variance of the isotope distribution, Ono et al. introduced a generalized function K(N,Z) for the free energy in ref. Ono04_1 as given below.
| (5) |
Here i represents each reaction. The summation is taken over i for the different N/Z reaction systems in order to get isotope multiplicity distribution in a wide range from proton rich to neutron rich isotopes. The average weights, wi(N,Z), are determined by minimizing the statistical errors in K(N,Z) for a given (N,Z). The isoscaling parameter, , is the isoscaling parameter value evaluated in the previous section. For each Z the parameters, (Z), are determined by optimizing the agreement of the quantities [-lnY(N,Z) + + (Z)] from different reactions. A typical K(N,Z) distribution from the experiment is shown in Fig. 5. The isotope distributions for a given Z exhibit a smooth quadratic distribution and they can be fit by a function:
| (6) |
Where , (Z), (Z) are the fitting parameters. As one can see the functional form, (Z) is related to the symmetry energy coefficient given in Eq.(4) as:
| (7) |
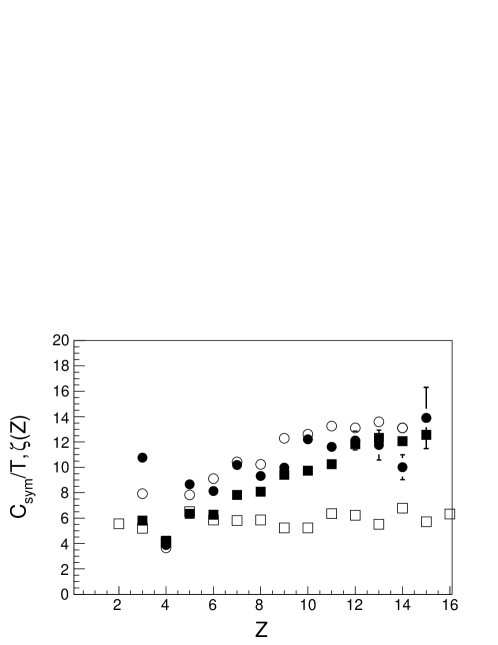
In Fig. 4, the values of (Z) extracted using this technique are shown by solid squares. The values are generally about 1 or 2 units smaller than the /T values evaluated in the previous section (solid circles), but the general trend is in good agreement. The difference in the extracted values for Z=3 originate from the different determination of the average value of A. In the analysis in this section the average masses of these isotopes are determined by the centroid of the quadratic distributions.
V. COMPARISONS WITH MODEL SIMULATIONS
The experimentally detected fragments are the final products of the reaction. Excited primary fragments will have cooled down by statistical decay before they arrive in the detector. Excitation energies of the primary fragments have been evaluated experimentally by measuring the light charged particle multiplicities in coincidence with the fragments Marie98 ; Hudan03 . Typical excitation energies of 2 to 3 MeV/nucleon have been derived. In order to study the effect of the secondary decay process on the experimentally extracted ratio, /T, the simulation codes of an Antisymmetrized Molecular Dynamics (AMD) model Ono96 ; Ono99 ; Hudan06 and a statistical decay code, Gemini Charity88 , have been used. These codes have often been used to study the fragment production in Fermi energy heavy ion reactions and the global features of the experimental results have been well reproduced Ono02 ; Wada98 ; Ono04_2 ; Wada00 ; Wada04 ; Hudan06 . Since the AMD calculation requires a lot of CPU time, only two of the experimental reaction systems have been studied. The systems examined are 64Zn+112Sn and 64Ni+124Sn at 40 AMeV. All calculations shown in this paper have been performed in a newly installed computer cluster in the Cyclotron Institute Wada09 . In order to obtain yields of the final products, the deexcitation of primary fragments formed at 300 fm/c was followed using the Gemini code until they cooled to the ground state. Using the same analysis described in the section III, the scaling parameters, and were then extracted from the simulated events as a function of Z. The average mass number of the isotopes for a given Z was also evaluated from the calculations. The calculated variation of /T is shown by open circles in Fig. 4. The values are typically one to two units higher than the experimental values (open circles) but exhibit an essentially identical trend. For the primary fragments at t = 300 fm/c the same analysis has been made. These fragments are identified using a coalescence technique in phase space. The evaluated symmetry coefficients using = 5 are shown in Fig. 6. =5 corresponds to a radius of 5 fm in configuration space. For the primary fragments the calculated values are close to the experimental values observed for Z 6 but, in contrast to the experimental results, they remain more or less constant for all Z. The rather flat distribution of /T values over the entire range of Z is consistent with the picture of the origin of the primary fragments from a common emitting source with a given density and temperature. These comparisons indicate that the /T values are significantly modified by the secondary process for Z 4
VI. SUMMARY
The symmetry energy coefficient to temperature ratio, /T , as a function of Z has been extracted from experimental data in two different ways, namely from isoscaling parameters and from the variance of the observed isotope distributions. The results from the two techniques are in reasonable agreement. Experimental values increase from 4 to 12 as Z increases from 4 to 15. The values and trends observed for the final fragments are well reproduced by the AMD plus Gemini model simulations. However these values are significantly different from the values extracted for the primary fragments, especially for Z 4, suggesting that the derivation of the observed ratio of symmetry energy coefficient to temperature is significantly perturbed by the secondary decay processes.
Acknowledgements.
We thank the staff of the Texas AM Cyclotron facility for their support during the experiment. We thank L. Sobotka for letting us to use his spherical scattering chamber. We also thank A. Ono and R. Charity for letting us to use their calculation codes. This work is supported by the U.S. Department of Energy under Grant No. DE-FG03-93ER40773 and the Robert A. Welch Foundation under Grant A0330. One of us(Z. Chen) also thanks the “100 Persons Project” of the Chinese Academy of Sciences for the support.References
- (1) R. W. Minich et al., Phys. Lett. B118, 458 (1982).
- (2) A. Bonasera et al., Phys. Rev. Lett. 101, 122702 (2008).
- (3) H. S. Xu et al., Phys. Rev. Lett. 85, 4, (2000).
- (4) M. B. Tsang et al., Phys. Rev. C64, 054615 (2001).
- (5) A.S. Botvina, O. V. Lozhkin and W. Trautmann, Phys. Rev. C65, 044610 (2002).
- (6) A. Ono et al., Phys. Rec. C68, 051601(R) (2003).
- (7) S. Albergo et al., Nuovo Cimento, A89, 1 (1985).
- (8) L. G. Moretto, C. O. Dorso, J. B. Elliott, and L. Phair, Phys. Rev. C77, 037603 (2008).
- (9) A. Ono, et al., Phys. Rev. C70, 041604(R) (2004).
- (10) A. Keli, J. B. Natowitz and K. H.Schmidt, Eur. Phys. J.A30,203 (2006).
- (11) N. Marie et al., Phys. Rev. C58, 256 (1998).
- (12) S. Hudan et al., Phys. Rev. C76, 064613 (2003)
- (13) M.Huang et al., arXiv:1001.3621 [nucl-ex] 22Jan2010.
- (14) R.Wada et al., annual report of the Cyclotron Institute, Texas A&M University, (2005), II-3, unpublished.
- (15) F. Hubert, R. Bimbot and H. Gauvin, At. Data Nucl. Data Tables 46, 1 (1990).
- (16) A. Ono and H. Horiuchi, Phys. Rev C53, 2958 (1996).
- (17) A. Ono, Phys Rev C59, 853 (1999)
- (18) A. Ono and H. Horiuchi, Prog. Part. Nucl. Phys. 53, 501 (2004).
- (19) R. J. Charity et al., Nucl. Phys. A483, 371 (1988).
- (20) A. Ono, et al., Phys. Rev. C66, 014603 (2002).
- (21) R. Wada et al., Phys. Lett. B422, 6, (1998).
- (22) R. Wada et al., Phys. Rev. C62, 034601 (2000).
- (23) R. Wada et al., Phys. Rev. C69, 044610 (2004)
- (24) S. Hudan, R. T. de Souza and A. Ono, Phys. Rev. C73, 054602 (2006).
- (25) R.Wada et al., annual report of the Cyclotron Institute, Texas A&M University, (2009), unpublished.