TYPE I PLANET MIGRATION IN NEARLY LAMINAR DISKS – LONG TERM BEHAVIOR
Abstract
We carry out 2-D high resolution numerical simulations of type I planet migration with different disk viscosities. We find that the planet migration is strongly dependent on disk viscosities. Two kinds of density wave damping mechanisms are discussed. Accordingly, the angular momentum transport can be either viscosity dominated or shock dominated, depending on the disk viscosities. The long term migration behavior is different as well. Influences of the Rossby vortex instability on planet migration are also discussed. In addition, we investigate very weak shock generation in inviscid disks by small mass planets and compare the results with prior analytic results.
1 INTRODUCTION
The discovery of close orbiting extrasolar planets led to extensive studies of disk planet interactions and the forms of migration that can explain their location. Early theoretical work established the so-called type I and type II migration regimes for low mass embedded planets and high mass gap forming planets (Goldreich & Tremaine 1980; Lin & Papaloizou 1986; Ward 1997), respectively.
Although it is suggested that migration is necessary to account for the observed distribution of planets (Ida & Lin 2008), the problem is that analytic theories and numerical simulations have shown that migration timescales of type I are quite short (Tanaka et al. 2002) so that the planet tends to migrate to its central star before it has time to become massive enough to open a gap in the disk. This problem thus becomes a competition between two timescales: type I migration and core accretion for planet mass growth (Pollack et al. 1996; Hubickyj et al. 2005). Several mechanisms have been suggested to address this challenging problem, which include thermal effects of the disk (Jang-Condell & Sasselov 2004), radial opacity jump (Menou & Goodman 2004), magnetic turbulent fluctuations (Nelson & Papaloizou 2004) and effects of co-orbital material (Masset et al. 2006). Non-isothermal slowing down of type I migration is studied by Paardekooper & Mellema (2006), Baruteau & Masset (2008), and Kley et al. (2009).
Recently, Li et al. (2009; hereafter Paper I) found that the low mass planet migration can have a strong dependence on the disk viscosity. They found that the type I migration is halted in disks of sufficiently low viscosity. This is caused by a density feedback effect which results in a mass redistribution around the planet. The simulations confirm the existence of a critical mass () beyond which migration is halted in nearly laminar disks. The critical masses are in good agreement with the analytic model of Rafikov (2002).
This paper is a follow-up study to Paper I. By performing a series of high resolution, 2-D hydrodynamic simulations, we present a more detailed analysis on the density feedback effect, and describe the long term ( orbits) behavior of migration. The paper is organized as follows. In §2 we give a brief description of our simulations. In §3 we discuss the density wave damping mechanism for different disk viscosities and the consequent long term migration behavior, including the density feedback and the Rossby vortex instability (RVI). Possible 3-D effects are discussed in §4. Summary and discussions are given in §5. A study on the shock excitation in inviscid disks is given in the Appendix.
2 Simulations
The 2-D hydrodynamic simulation set-up and the numerical methods we used here are the same as that in Paper I (more details on the code are given in Li & Li 2009). We choose an initial surface density profile normalized to the minimum mass solar nebulae model (Hayashi 1981) as , where in this paper. (The migration dependence on in the low viscosity limit has been explored in Paper I so we will not vary in this study.) The disk is assumed to be isothermal throughout the simulated region, having a constant sound speed . The dimensionless disk thickness is set as , where is the Keplerian velocity at the initial planet location . (Simulations with higher were given in Paper I.) The dimensionless kinematic viscosity (normalized by at the planet’s initial orbital radius) is taken as a spatial constant and ranges from to . This corresponds to an effective viscous . For most runs, we have chosen the planet mass to be . The planet’s Hill radius is , which is . A pseudo-3D softening is used (Li et al. 2005). Fully 2-D disk-self gravity is included (Li, Buoni, & Li 2009). The disk is simulated with . Runs are made typically using a radial and azimuthal grid of , though we have used higher resolution to ensure convergence on some runs. Simulations typically last more than ten thousand orbits so that we can study the long term behavior of migration.
3 Results
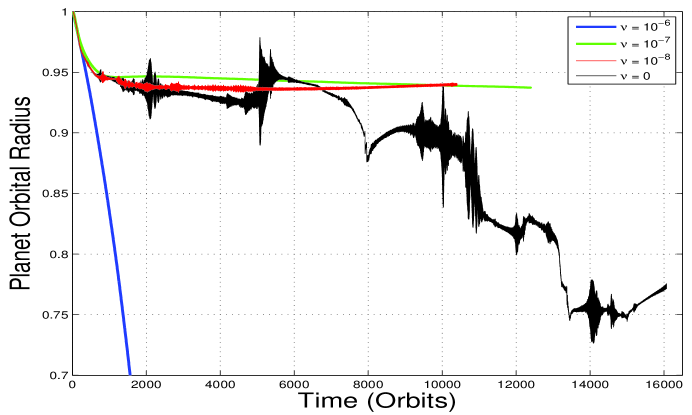
Figure 1 shows the orbital radius evolution of a protoplanet in a 2-D laminar disk with different disk viscosities. When the disk viscosity is relatively large ( or ), the migration rate agrees well with the theoretical results given by Tanaka et al. (2002) for type I migration. When the disk viscosity is low, the migration behavior differs markedly from the usual type I migration (see also Fig. 1 in Paper I). Such slowing down behavior was explained in terms of the density feedback effect (Ward 1997; Rafikov 2002) in Paper I. Here, we have extended the evolution to be about ten times longer ( orbits) than those in Paper I. But before we discuss the long term behavior in detail, we present some additional analysis of the density feedback effect first.
3.1 Density Wave Damping Mechanism for Different Viscosities
The critical physics issue in deciding the density feedback effect is the density wave damping mechanism. Where and how the density waves generated by the protoplanet damp will contribute critically to the torque on the planet. Furthermore, such damping process will modify the density distribution around the planet, which directly affects the torque as well. This effect was partially analyzed in Paper I. In principle, the density wave can damp both due to disk viscosity (a viscous process) and by shocks (a nonlinear process). The relative importance of these processes will naturally depend on the disk viscosity.
To quantify the damping process, we have evaluated the Reynolds stress and viscous stress. An effective, azimuthally averaged based on the Reynolds stress can be defined as:
| (1) |
where indicates the azimuthal average, , and are disk surface density and pressure, respectively. This method was previously discussed in Balbus & Hawley (1998) and Li et al. (2001). Similarly, the azimuthally averaged based on the viscous stress can be defined as:
| (2) |
and this quantity scales as .
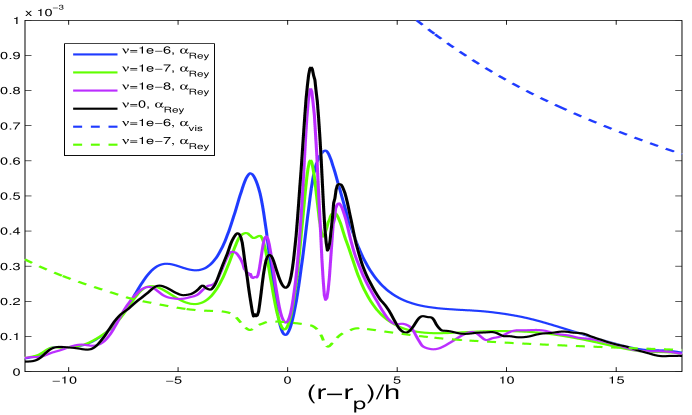
In Figure 2, we present both and as a function of disk radius. The results are based on the runs at 400, 1000, 760 and 700 orbits for and , respectively. These times are chosen so that the planet is at roughly the same orbital radius in all the runs. For , the viscous transport is much bigger than the Reynolds transport (by more than a factor of 2 around the planet). For , , which is smaller than around the planet. This means that the dominant wave damping mechanism around the planet changes from being viscous damping to being shock-dominated damping when the disk viscosity changes from to . For even smaller disk viscosity, shocks dominate the wave damping. The peaks of are approximately away from the planet, consistent with the excitation of shocks. Note that as disk viscosity changes, the shock strength and structure will be changed somewhat. This could account for the changes in for .
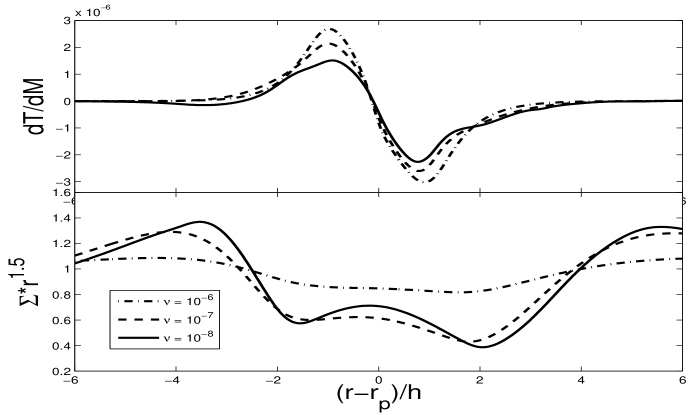
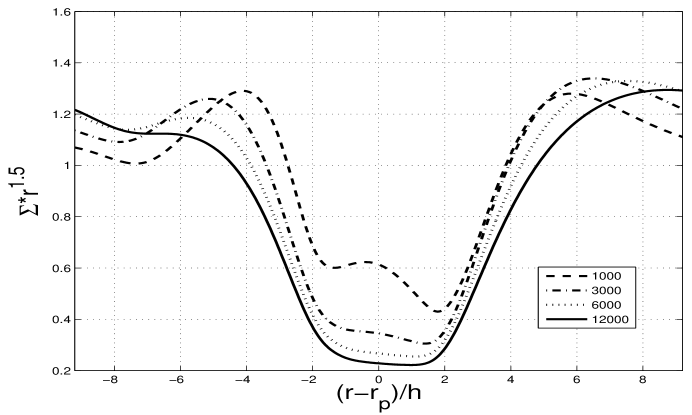
The wave damping by shocks causes the density profiles at the shocks to be significantly modified. To confirm this effect further, we analyze the torque density profiles by examining where is the torque on the planet by disk material and is the mass within each radial ring. We choose three runs with and pick the planet radial location at to compare (this corresponds to and orbits for these runs respectively). From Figure 1, their migration trend at this location is quite different (i.e., the total torque on the planet is very different). The profiles are given in the top panel of Figure 3. For different viscosities, the difference in is not large, within a factor of 2. But the torque amplitude on the planet in the case is about a factor of 100 larger than that of the two cases for and . This shows that the difference should be caused by the density variations. The bottom panel of Figure 3 shows the radial disk density profile around the planet. The density imbalance between the inner Lindblad and outer Lindblad regions are much stronger for the lower viscosity cases than the case for .
In the usual picture of wave damping, as the viscosity decreases, the density waves are expected to propagate farther away (Takeuchi et al. 1996). As a result, the peak positions of are expected to be farther away from the planet. We did not find such behavior in the simulation results because the shock dissipation dominates the wave damping when the viscosity is sufficiently small. This also indicates that, for these choices of planet mass and disk sound speed, shocks are always produced.
We want to emphasize that, even though the effective “viscosity” caused by shocks is not high (see Figure 2), it is the density imbalance due to the angular momentum transport by the shocks that causes a big change in the total torque on the planet. For planet’s mass above the critical values described in Rafikov (2002) and Paper I, the above analysis indicates that there exists a critical disk viscosity, below which the density wave damping will be dominated by the shock dissipation and the density feedback effect can slow down (or halt) the migration. For planet mass less than the critical values, however, even when the disk viscosity is low enough so that the shock dissipation is dominant, the density imbalance caused by the shock dissipation is too weak or taking too long to be able to change the migration behavior.
3.2 Long Term Evolution
The long term evolution ( orbits) for different disk viscosity (Figure 1) is complicated. For three low viscosity cases, , and , the migration is significantly slowed down or even reversed, but the detailed behavior is different. (Note that for , there is still some low level of numerical viscosity, which we estimate to be roughly equivalent to .) We now discuss each case in detail.
3.2.1 The case
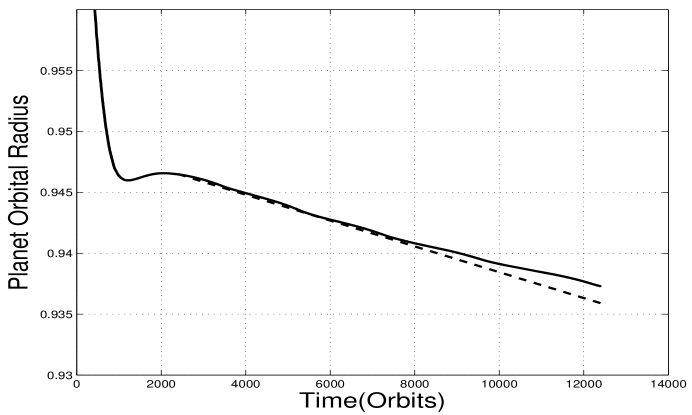
For , Figure 1 shows that the planet has a steady migration rate. Figure 4 shows the comparison between the simulation and the viscous drift rate calculated using . It looks like that the density feedback effects take the planet migration into a “viscous” limit, where the migration is consistent with being on the viscous time scale after about 2500 orbits. The corresponding surface density profile evolution is shown in Figure 5. It can be verified that the density distribution remains smooth and evolves on the viscous timescale as well. This implies that the shock damping of the density waves causes the planet and surrounding disk material to migrate with approximately the same timescale. This situation is similar to the previous type II migration study where a gap has formed in the disk. Upon more detailed analysis, however, the accretion rate throughout the disk is not quite a constant. This suggests that the steady migration observed so far could change if we follow it to even longer timescales.
Figure 5 shows that a wide density “depression” (not quite a gap) is forming. Given the wide gap, one might have expected the excitation of the secondary instability such as the Rossby vortex instability (RVI), but this instability is suppressed in this case by the disk viscosity.
3.2.2 The case
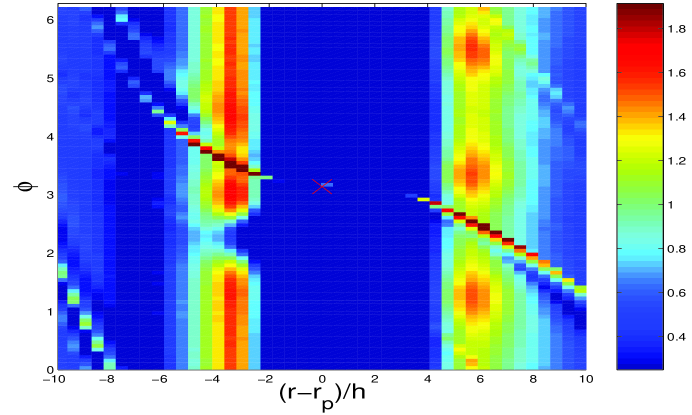
For , the planet’s migration is essentially halted and gradually going in the reverse direction at late stages. Figure 6 shows the density distribution at orbits. The density “depression” is steeper than what was seen in the case. For such a low viscosity, the RVI is also excited at a low level. Figure 6 shows that the azimuthal density variation is more pronounced in the low azimuthal wave number . This is because, during the nonlinear stage of RVI, vortices will merge (Li et al. 2005), and one is often left with only large scale variations in disk surface density. (More detailed discussions on RVI will be given below.)
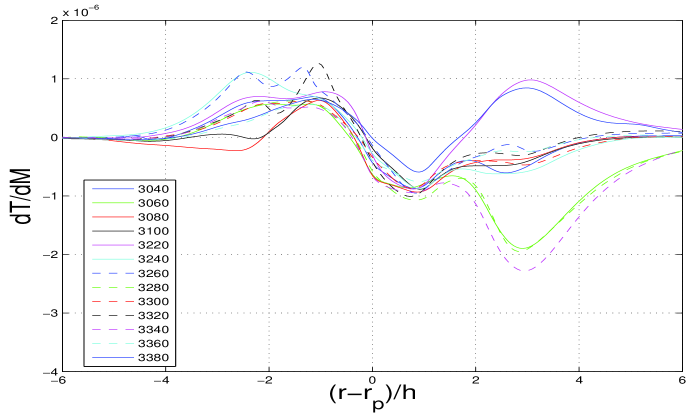
Because of the RVI, the behavior of becomes more complicated. This is shown in Figure 7 where we have plotted the evolution of over a period between orbits. This coincides with a period when the RVI is mildly excited (see Figure 1). The peaks around in are still consistent with the shock damping. The drastic changes around are due to the azimuthal asymmetries in surface density caused by RVI, which give rise to the sign change in . We have confirmed that the Lindblad resonance positions for these low modes are coincident with the positions where change dramatically around , as shown in Figure 7.
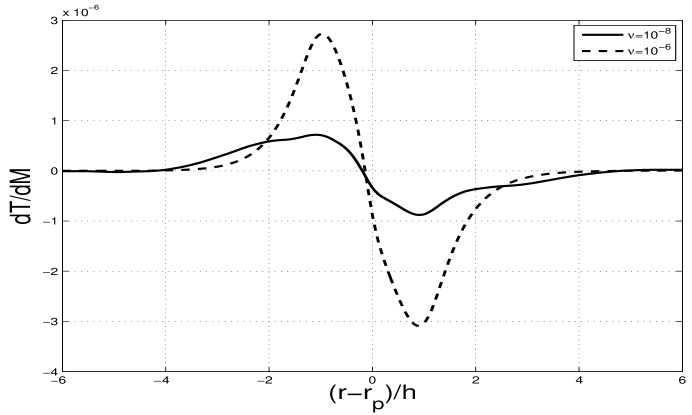
When averaged over a few hundred orbits, however, the changes in cancel out as evident in Figure 8. The averaged profile, when compared with that from the case, shows that RVI causes the torque contribution to extend to a larger radial extent (the tails between ), though the peak amplitudes of at are smaller by about a factor of 4. This implies that the excitation of RVI has a minor impact on the overall migration in this case.
It is not clear why the migration is slowly going outward, nor whether this trend will continue at much longer times than what was simulated. This is a regime where both the density feedback effects by shock dissipation and the influence by mild RVI are playing some roles in planet migration. Though it seems reasonable to expect that the planet migration is significantly slowed down when compared to the usual type I rate, it is difficult to get a definite answer.
3.2.3 The case
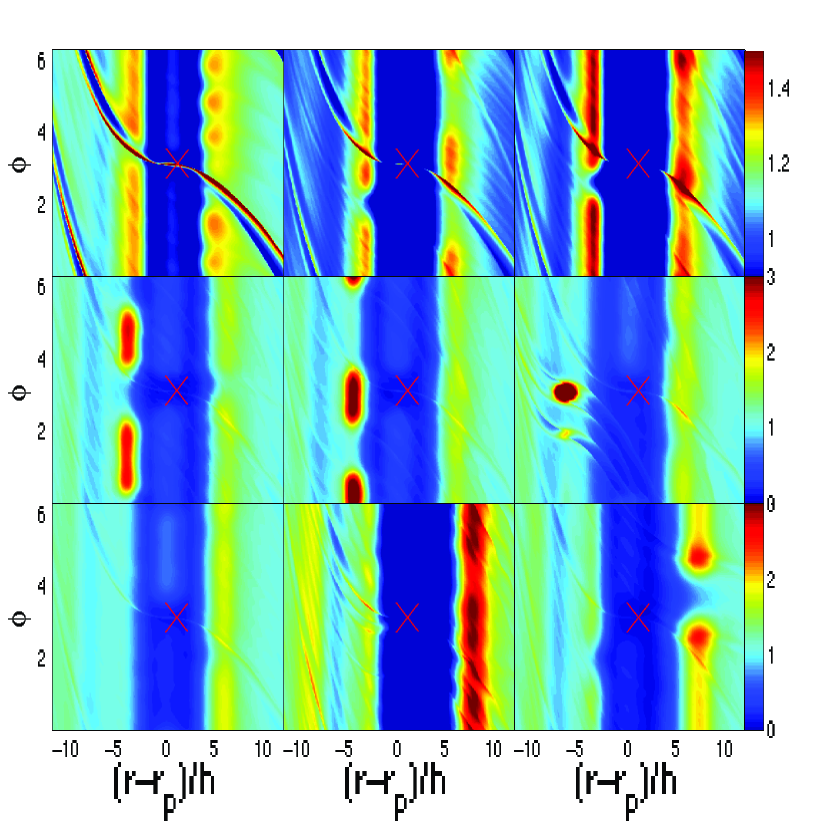
For , the planet migrates in a more complex way, now strongly influenced by the RVI. Large amplitude oscillations in the semi-major axis evolution appear and sometimes exhibit rapid radial drops. Figure 9 presents several snapshots of the disk surface density, showing the evolution of RVI. The vortices exert strong torques to the planet as they move past the planet. It seems that the planet’s migration is still inward overall, though it undergoes many oscillations, reversals, and fast drops (see the black curve in Figure 1). Several factors could have contributed to this type of evolution. First, the low disk viscosity makes the shocks stronger (cf. Figure 2), causing a stronger disk response and faster disk density evolution. The excitation of RVI is associated with the inflexion points (which are regions of density depressions) in the radial profile of potential vorticity (Lovelace et al. 1999; Li et al. 2000). Second, these vortices tend to have slightly different azimuthal speeds so they will merge (Li et al. 2001; 2005), forming large scale density structures azimuthally. Third, they are anti-cyclones with high densities, so they produce their own spiral shocks around them. Their influence on the surrounding flow and the existence of spiral shocks lead to an effective angular momentum transport (mostly outward) so these vortices will gradually migrate inwards (see results also in Li et al. 2001). This is seen in the current simulations as well. Fourth, when the vortices migrate away inwardly (on a relatively fast timescale), the planet migration is subsequently affected because the disk density profile is significantly changed by these vortices. Fifth, because the shocks by the planet is strong, new generations of vortices are produced after the previous generation has migrated away. All these highly non-linear effects, unfortunately, make it very difficult to predict the behavior of planet migration.
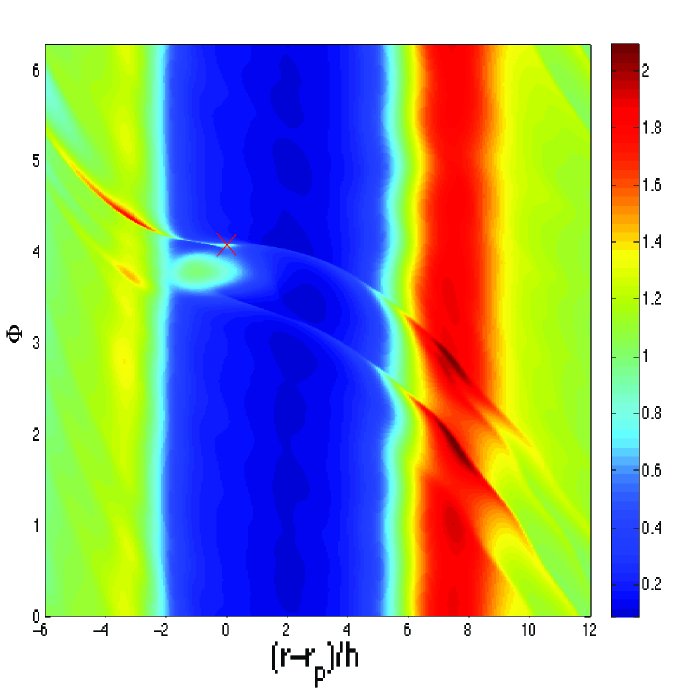
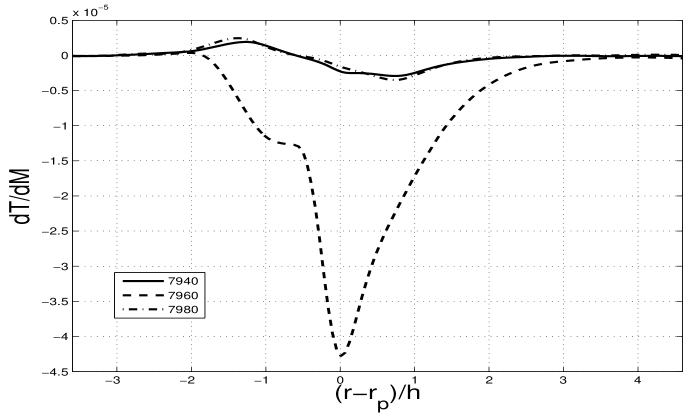
One curious observation is the fast radial drop during the planet migration, as indicated, say, between and orbits (cf. Figure 1). In Figure 10, we show the density distribution at the time of a rapid drop (7960 orbits). It is interesting to see that the drop is coincident with this close encounter between the planet and the density blob. The mass of the dense blob is estimated to be the same order of the planet, about or . The profiles at the time around the rapid drop are shown in Figure 11. We can identify that at the time of 7960 orbits, a huge negative torque occurs and could contribute to the rapid drop of the planet.
4 Possible 3-D Effects
Our results indicate that the disk gas density distribution near the planet sensitively controls migration. Migration stoppage in low viscosity disks is a consequence of a systematic mild redistribution of gas mass near the planet, favoring outward over inward torques. It does not require complete removal of gas near the planet, as in the type 2 regime (Li et al 2009). The redistribution is in turn controlled by shocks. The location and structure of these shocks have an important influence on the feedback torque on the planet. The nature of the shocks that occur in 3-D can be quite different from the 2-D case analyzed in this paper. In a 2-D isothermal disk with pressure, only one type of wave is excited, a rotationally modified acoustic wave. In a 3-D disk that is not vertically isothermal and/or has a nonzero vertical buoyancy frequency, this wave is modified and other types of waves may be excited (Lubow & Pringle 1993; Korycansky & Pringle 1995). Their damping properties differ from the 2-D case. If the disk is not vertically isothermal, as suggested by steady-state models of dead zones (e.g., Terquem 2008), then the main wave that is excited, the mode, becomes more confined near the disk surface as it propagates, through ’wave channelling’ (Lubow & Ogilvie 1998; Bate et al 2002). The wave becomes more nonlinear as it propagates and undergoes more rapid shock damping than in the 2-D case. Since the material that gets shocked lies above the disk midplane, it is not clear how effective the breaking surface waves will be in affecting migration in comparison to the isothermal case. But, the rate of change of disk angular momentum produced by waves is determined by the angular momentum flux they carry. For given disk surface density near a resonance, the mode carries about the same amount of angular momentum flux as the 2-D acoustic mode. So if the mode damps closer to the planet than the 2-D acoustic mode, then its effects on the migration torque could be more important. It is possible that the upper layers are successively shocked from the outside-in towards the midplane and displaced radially. The process may become less effective, as the remaining gas becomes less optically thick and more isothermal. These suggestions are speculative. Further analysis is required to determine the importance of the mode effects on migration.
Modes other than the mode that are excited in a 3-D disk can damp rapidly. For a vertically isothermal disk undergoing adiabatic wave perturbations, the fraction of the wave energy that goes into these alternative modes is given by [see Eq. (B4) in Bate et al 2002]. For , this fraction is only about . It is possible that the damping of these waves may produce a feedback torque that is more significant in strength than of the total feedback torque. The reason is that the wave damping will likely occur closer to the planet than the 2-D mode investigated in this paper. For example, vertically propagating gravity waves are produced that damp in the disk atmosphere. For a gas, the ratio is and the damping effects of these modes are more important. The damping of these waves occurs well above the disk midplane and it is not clear how much the feedback torque on the planet is modified. As discussed above, the disk may be affected from the outside-in, towards the midplane. A proper 3D analysis of the disk evolution in the low viscosity case is required.
5 Summary and Discussion
We have carried out 2-D global hydrodynamic simulations to study the migration of a protoplanet in a protoplanetary disk. The disk surface density is taken to have the same value in the minimum mass solar nebula model, but we have taken the normalized disk sound speed to be relatively low, . In Paper I, we have shown the existence and the concrete values for critical planet masses (depending on the disk mass and sound speed) above which the density feedback effects will slow down the type I migration significantly. Here, we have mainly focused on the long term behavior of planet migration in such low viscosity disks. We find the following results:
1) When the disk viscosity is high (e.g., , or ), the density wave damping is dominated by the disk viscosity. The migration can be described as the typical type I migration.
2) When the viscosity is relatively low (e.g., is between and , or and ), the density wave damping is dominated by shocks. This then modifies the disk surface density profile quite significantly, which produces a density feedback effect that alters the planet migration, slowing it down into a viscous time scale or halting the migration altogether. The new migration timescale, orbits, is considerably longer than the usual type I migration time. This range of the disk is interestingly consistent with the expected values in the “dead zone” of protoplanetary disks where protoplanet cores are believed to arise. If the cores of protoplanets can manage to grow above the critical masses (as given in Paper I) without migrating away, then these cores can spend a long time in the dead zone (essentially the disk lifetime).
3) When the disk viscosity is even lower (e.g., ), the density feedback effect is still present but the RVI starts to dominate the nonlinear evolution of the disk. The planet migration is severely affected by the RVI. Large amplitude oscillations appear in the planet semi-major axis evolution and the rapid drop of the planet occurs sometimes as RVI-induced density blob experiences close encounters with the planet. The overall migration seems still inward and becomes unpredictable. It is not quite clear whether realistic disks will ever have such low viscosities.
We have only studied the long term migration behavior of a protoplanet. This mass is above the critical mass limit discussed in Paper I. For lower planet masses, however, even for low viscosity disks, the shocks produced by the planet will tend to be weak, so the density feedback effects discussed in this paper and Paper I will not be strong enough to slow down the migration significantly. In this limit, the Type I migration still poses a serious threat to the survivability of these small mass protoplanets (say, ), if no other mechanisms can stop the migration.
The critical masses for stopping planet migration are sensitive to the disk interior temperature. Dead zones may have higher temperatures than assumed here. For a steady state disk, the surface density varies inversely with . The higher surface density, due to the lower in a dead zone, gives rise to a higher optical depth and therefore higher temperature at the disk midplane (e.g., Terquem 2008). If the disk temperatures reach a value corresponding to , then the critical masses can become substantially higher than determined here and the effects of the feedback effect on planet migration become much less important. In addition, realistic 3-D simulations are certainly desirable to address how layered vertical structures (with both magnetically active and less-active regions) will affect the wave damping and planet migration.
Appendix A Shock Damping for Low Mass Proto-Planets in Inviscid Disks
In this paper, we have studied the density wave damping by shocks when the disk viscosity is low and how this damping affects the disk density evolution and planet migration over orbits. The existence of the shocks, however, deserves further analysis. Prior studies (e.g., Goodman & Rafikov 2001) have suggested that shocks will always be produced in an inviscid disk, even for very small planet masses. Other nonlinear studies (e.g., Korycansky & Papaloizou 1996) have examined similar issues, pointing out the importance of parameter , where is ratio of planet mass to the central star. (Their definition omitted the factor of 3.) For , the planet masses considered in Korycansky & Papaloizou (1996) are all larger than , which is above the critical mass limit shown in Li et al. (2009). This means that shocks should always be produced in an inviscid disk for this planet mass. Here, we present some numerical results using 2-D global hydrodynamic simulations, extending the planet mass to values smaller than one Earth mass. To isolate the effects of shock production, we place the planet on a fixed circular orbit and turn off the disk self-gravity.
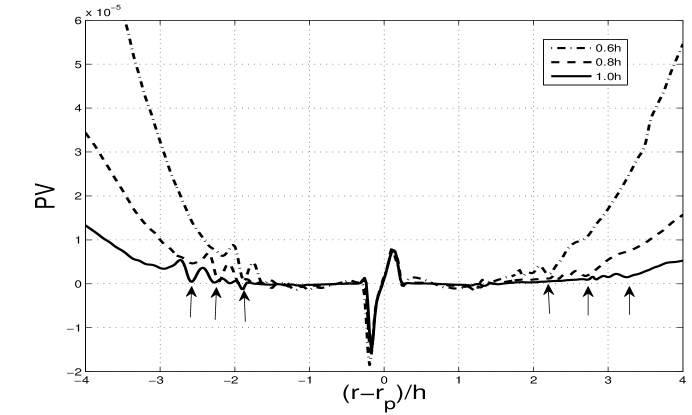
Such simulations are numerically challenging because the simulations have to capture and resolve very weak shocks. We have used an initial disk surface density profile that goes as and the disk is isothermal and has a constant so that the initial disk potential vorticity (PV) profile is nearly flat (the weak radial dependence of PV from the pressure gradient is fully captured). We then monitor the changes in PV. Figure 12 shows the azimuthally averaged radial PV profile around a protoplanet of . The normalized disk scale height is . This gives . We used a constant softening distance of .
In an ideal flow, PV should be conserved. There are (at least) two non-ideal regions in our simulations. One is the co-orbital region where the planet mass is introduced. This process is necessarily non-ideal, no matter how slowly the planet mass is introduced. This will produce changes in PV. This is because, when the planet is introduced, the flow lines around the planet change from being non-interacting to horseshoe orbits. This non-ideal process could produce changes in PV. Judging from Figure 12, this process affects the PV in a region spreading over . The other region is associated with the density wave propagation where the waves could steepen into weak shocks (e.g., Goodman & Rafikov 2001). We believe this is represented by the PV changes at and using the highest resolution run. It is difficult to determine the exact values of the starting locations of the shocks. Based on Figure 12, we identify and as the shock starting positions at the right and left side of the planet, respectively. Note that on both sides of the planet, there exists an “ideal” flow region where the PV remains largely unchanged (). Even with these high resolutions, the simulations have not completely converged, though the shock locations are roughly consistent among the two highest resolution runs. (Note that for higher planet masses, such as , the shocks are much stronger and the convergence can be achieved with these resolutions.)
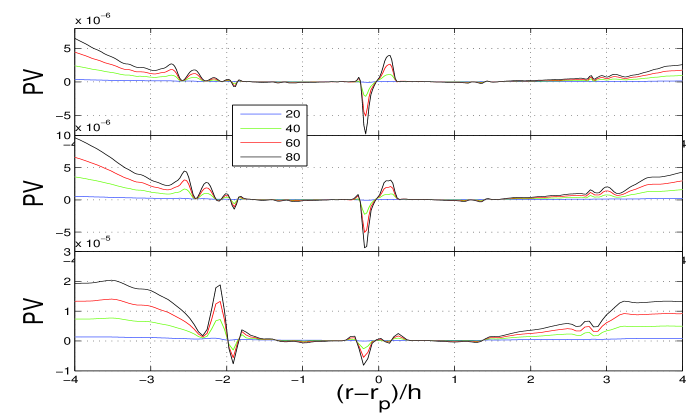
It is interesting to see that even for as low as , shocks are clearly produced. We have also found that the shock location and strength depend on the softening distance we use. This is not surprising because larger softening distance will weaken the strength of wave excitation. Since we do not really know what is the most appropriate softening to use in a 2-D simulation, we have tried three values, and . Figure 13 shows the PV profile produced by a planet in a disk with . The time is 146 orbits. The shock gets stronger when the softening is smaller, as indicated by the magnitude in PV. In addition, the starting location of the shock moves further away from the planet when the softening distance increases, as indicated by the PV profiles to the right of the planet.
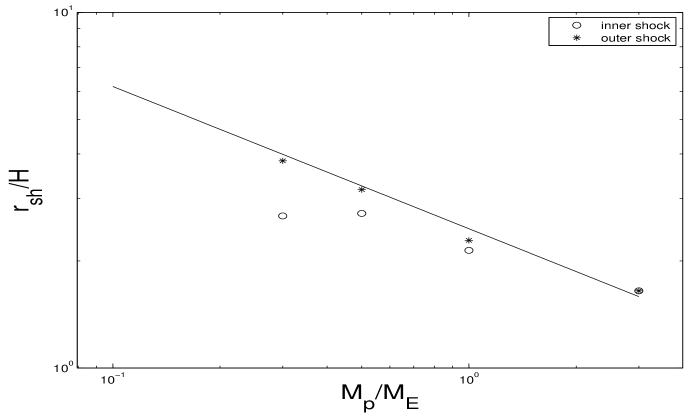
We have also tried to make quantitative comparison between our simulations and the results by Goodman & Rafikov (2001). Figure 14 shows our best estimates from simulations along with their predictions [eq. (30)] in Goodman & Rafikov (2001). (Note that their study was done in a shearing sheet configuration.) For these simulations we have used a softening of . The agreement is quite amazing, at least for this choice of softening. In their analysis, they matched a linear wave excitation process with the nonlinear propagation. It is hard for us to ensure that the wave excitation in simulations is strictly in the linear regime (though increasing softening distance seems to be going in that direction). We have tried to extend our simulations to planet but we are less confident about the numerical effects, so we omit that result.
References
- Balbus & Hawley (1998) Balbus, S. A., & Hawley, J. F., 1998, Rev. Mod. Phys., 70, 1
- (2) Baruteau, C., & Masset, F., 2008, ApJ, 672, 1054
- Bate et al (2002) Bate, M., Ogilvie, G. I., Lubow, S. H., & Pringle, J. E. 2002, MNRAS, 332, 575
- Goldreich & Tremaine (1980) Goldreich, P. & Tremaine, S, 1980, ApJ, 241, 425
- Goodma & Rafikov (2001) Goodman, J., & Rafikov, R. R. 2001, ApJ, 552, 793
- Hayashi (1981) Hayashi, C. 1981, Progress of Theoretical Physics Supplement, 70, 35
- (7) Hubickyj, O., Bodenheimer, P., & Lissauer, J. J. 2005, Icarus, 179, 415
- (8) Ida, S., & Lin, D. N. C. 2008, ApJ, 673, 487
- (9) Jang-Condell, H., & Sasselov, D. D. 2004, ApJ, 619, 1123
- Kley et al. (2009) Kley, W., Bitsch, B., & Klahr, H. 2009, arXiv0908.1863
- Korycanski & Papaloizou (1996) Korycansky, D. G., & Papaloizou, J. C. B. 1996, ApJS, 105, 181
- Korycanski & Pringle (1995) Korycansky, D. G., & Pringle, J. E. 1995, MNRAS, 272, 618
- Li et al. (2001) Li, H., Colgate, S. A., Wendroff, B., & Liska, R. 2001, ApJ, 551, 874
- Li et al. (2005) Li, H., et al. 2005, ApJ, 624, 1003
- Li et al. (2000) Li, H., Finn, J. M., Lovelace, R. V. E., & Colgate, S. A. 2000, ApJ, 533, 1023
- Li et al. (2009) Li, H., Lubow, S. H., Li, S., & Lin, D. N. C. 2009, ApJL, 690, 52
- li et al. (2009) Li, S., Buoni, M. J., & Li, H. 2009, ApJS, 181, 244
- Lin & Papaloizou (1986) Lin, D. N. C., & Papaloizou, J. C. B., 1986, ApJ, 309, 846
- Lovelace et al. (1999) Lovelace, R. V. E., Li, H., Colgate, S. A., & Nelson, A. F., 1999, ApJ, 513, 805
- Lubow & Ogilvie (1998) Lubow, S. H., & Ogilvie, G. I. 1998, ApJ, 504, 983
- Lubow & Pringle (1993) Lubow, S. H., & Pringle, J. E. 1993, ApJ, 409, 360
- Masset et al. (2006) Masset, F. S., Morbidelli, A., Crida, A., & Ferreira, J. 2006, ApJ, 642, 478
- Menou & Goodman (2004) Menou, K., & Goodman, J. 2004, ApJ, 606, 520
- (24) Nelson, R. P., & Papaloizou, J. C. B. 2004, MNRAS, 350, 849
- (25) Paardekooper, S. J., & Mellema, G. 2006, A&A, 459, 17
- (26) Pollack, J. B., et al. 1996, Icarus, 124, 62
- (27) Rafikov, R. R. 2002, ApJ, 572, 566
- Takeuchi et al. (1996) Takeuchi, T., Miyama, S.M., & Lin, D. N. C. 1996, ApJ, 460, 832
- Tanaka et al. (2002) Tanaka, H., Takeuchi, T., & Ward W. R. 2002, ApJ, 565, 1257
- Terquem (2008) Terquem, C. E. J. M. L. J. 2008, ApJ, 689, 532
- Ward (1997) Ward, W. R. 1997, Icarus, 126, 261