Star formation, starbursts and quenching across the Coma supercluster
Abstract
We analyse Spitzer MIPS 24m observations, and Sloan Digital Sky Survey (DR7) optical broadband photometry and spectra, to investigate the star formation properties of galaxies residing in the Coma supercluster region. We find that star formation (SF) in dwarf galaxies is quenched only in the high density environment at the centre of clusters and groups, but that passively-evolving massive galaxies are found in all environments, indicating that massive galaxies can become passive via internal processes. The SF-density relation observed for the massive galaxies is weaker relative to the dwarfs, but both show a trend for the fraction of star-forming galaxies () declining to in the cluster cores. We find AGN activity is also suppressed among massive galaxies residing in the cluster cores.
We present evidence for a strong dependence of the mechanism(s) responsible for quenching star formation in dwarf galaxies on the cluster potential, resulting in two distinct evolutionary pathways. Firstly, we find a significant increase (at the 3 level) in the mean equivalent width of H emission among star-forming dwarf galaxies in the infall regions of the Coma cluster and the core of Abell 1367 with respect to the overall supercluster population, indicative of the infalling dwarf galaxies undergoing a starburst phase. We identify these starburst galaxies as the precursors of the post-starburst k+A galaxies. Extending the survey of k+A galaxies over the whole supercluster region, we find 11.4% of all dwarf ( mag ) galaxies in the Coma cluster and 4.8% in the Abell 1367 have post-starburst like spectra, while this fraction is just 2.1% when averaged over the entire supercluster region (excluding the clusters). This points to a cluster-specific evolutionary process in which infalling dwarf galaxies undergo a starburst and subsequent rapid quenching due to their passage through the dense ICM. In galaxy groups, the star formation in infalling dwarf galaxies is instead slowly quenched due to the reduced efficiency of ram-pressure stripping.
We show that in the central Mpc of the Coma cluster, the () near/mid infra-red colour of galaxies is correlated with their optical colour and H emission, separating all mid-infrared (MIR) detected galaxies into two distinct classes of ‘red’ and ‘blue’. By analysing the spatial and velocity distribution of galaxies detected at 24m in Coma, we find that the (optically) red 24m detected galaxies follow the general distribution of ‘all’ the spectroscopic members, but their (optically) blue counterparts (i) are almost completely absent in the central Mpc of Coma, and (ii) have a remarkable peak in their velocity distribution, corresponding to the mean radial velocity of the galaxy group NGC 4839, suggesting that a significant fraction of the ‘blue’ MIR galaxies are currently on their first infall towards the cluster. The implications of adopting different SFR tracers for quantifying evolutionary trends like the Butcher-Oemler effect are also discussed.
keywords:
galaxies: clusters: general,galaxies: evolution, galaxies: fundamental parameters, infrared: galaxies1 Introduction
The Coma supercluster is the nearest rich supercluster of galaxies (Chincarini & Rood, 1976; Gregory & Thompson, 1978), consisting of two rich Abell clusters, separated by Mpc, but connected by a prominent filament of galaxies and poorer groups (e.g. Fontanelli, 1984), which is part of the supercluster identified as the “Great Wall” in the first major redshift survey of galaxies in the nearby Universe (Geller & Huchra, 1989). At a distance of Mpc, it affords a closer look at the properties of individual galaxies (1 kpc 2.1 arcsec), but its large angular scale on the sky presents observational challenges for the narrow fields of view of most instruments.
It is interesting to note that even though they are the two most significant structures in the supercluster, the two Abell clusters are remarkably different in every respect. The optical luminosity function of galaxies in the Coma cluster, for instance, has a much steeper faint-end slope than that of its neighbour Abell 1367 (Iglesias-Páramo et al., 2003). Early studies (e.g. Dressler, 1980) revealed that the fraction of spiral galaxies in the Coma cluster is anomalously low compared to Abell 1367. In addition, galaxies in the core of the Coma cluster were identified to be unusually deficient in neutral hydrogen (e.g. Sullivan & Johnson, 1978; Giovanelli & Haynes, 1985; Bernstein et al., 1994), ionized hydrogen (Raychaudhury et al., 1997) and molecular gas (H2/CO) (Boselli et al., 1997a). Bothun, Schommer, & Sullivan (1984) found a strong HI gradient in Coma galaxies- many of the inner, HI poor spirals being quite blue, suggesting that some gas removal process has acted quite recently, while Abell 1367 was found to be a mixture of HI poor and rich galaxies.
The availability of more detailed analyses of star formation, based on multi-wavelength data, and of spectral indices sensitive to stellar ages, has made this field more interesting. Estimates of star formation activity from mid-infrared (IR) (Boselli et al., 1997b) and Galaxy Evolution Explorer (GALEX) ultraviolet (Cortese, Gavazzi, & Boselli, 2008) photometry show that star formation in Coma on the whole is substantially suppressed compared to that in the field, while Abell 1367 has an abundance of bright star-forming galaxies (Cortese, Gavazzi, & Boselli, 2008).
In a hierarchical model of the formation of structures in the Universe, it is not surprising that a rich cluster, with a relaxed appearance in its X-ray image, such as Coma, would represent the end product of the gradual assimilation of several galaxy groups over time. In spite of the claim of Dressler & Shectman (1988) that the Coma cluster does not have significant substructure, it has subsequently been shown to have at least three major subclusters in the optical (e.g. West, 1998) and X-ray maps (e.g. Davis & Mushotzky, 1993; Adami et al., 2005). At the other end of the supercluster, Abell 1367 is also found to be elongated with three major subclusters, along the axis of the filament, with a population of star-forming galaxies infalling into the SE cloud and possibly the other two as well (Cortese et al., 2004). This has prompted a multitude of studies attempting to link the dynamical history of the supercluster with the properties of individual galaxies to investigate both the process of building clusters, as well as the effect of large-scale structure on the star formation history of galaxies (e.g. Haines et al., 2006).
By employing the spectral analysis of galaxies in Coma, together with the X-ray map of Neumann et al. (2003), Poggianti et al. (2004) found that the post-starburst (k+A) galaxies, in which star formation has been quenched within the last 1-1.5 Gyr, are associated with the X-ray excess attributed to the substructure in Coma. However, this work was limited to 3 fields in the Mpc region surrounding the centre of Coma.
In addition to star formation indices measured from optical spectra, the availability of Spitzer MIPS mid-IR observations has been recently utilised by several authors to characterise the star formation properties of the obscured component in galaxies in clusters and groups (e.g. Saintonge, Tran, & Holden, 2008; Haines et al., 2009; Wolf et al., 2009; Bai et al., 2010), since the 24m flux can be used as a representation of the dust-reprocessed overall IR flux.
Hereafter, we will refer to the pair of clusters Coma and Abell 1367, along with the associated filament of galaxies as the Coma Supercluster. In this paper, we use the Spitzer MIPS 24m observations, wherever available, along with the broadband colours and spectral star formation indicators from the Sloan digital sky survey (SDSS). We adopt the distance modulus of the Coma Supercluster to be , and use cosmological parameters , and km s-1 Mpc-1 for calculating the magnitudes and distances. We note that at the redshift of Coma (z ), our results are independent of the choice of cosmology. In the next section, we present our data and reduction methodology, and summarise our main results in §3 and §4. We discuss their implications, and compare the properties of galaxies in various parts of the supercluster in §5, summarising in §6.
2 Observational Data
We base our work on the photometric and spectroscopic data acquired by the SDSS Data Release 7 (Adelman-McCarthy et al., 2006, (DR7)), which for the first time covers the entire region of the Coma Supercluster presented in this paper. Over a smaller area, we also use archival 24m mid IR (MIR) images, from the Multi-band Imaging Photometer (MIPS) instrument aboard Spitzer (Rieke et al., 2004), available over a significant fraction of the two main clusters.
2.1 Optical data
We select the galaxies belonging to the Coma supercluster from the SDSS spectroscopic catalogue only, requiring the member galaxies to be within RA deg and Dec deg on the sky, and with a radial velocity within 2,000 km s-1 of the mean redshift of the Coma cluster (6,973 km s-1) or the Abell 1367 cluster (6,495 km s-1) respectively (Rines et al., 2003). All our galaxies are brighter than SDSS magnitude ( for Coma), which is the completeness limit of the SDSS spectroscopic galaxy catalogue.
2.2 MIPS 24m data
For the mid-infrared study of Coma and Abell 1367, we use archival 24m Spitzer MIPS data covering in the case of Coma (PID: 83, PI G. Rieke) and for Abell 1367 (PID: 25, PI G. Fazio). The Coma 24m dataset consists of four contiguous mosaics (see Fig. 1) obtained in medium scan mode, with scan leg spacing equal to the half array width, producing homogeneous coverage over the mosaic, with an effective exposure time per pixel of 88 sec. Bai et al. (2006), who used this data to determine the 24m luminosity function of Coma, estimate the 80% completeness limit to be 0.33 mJy, corresponding to a star formation rate (SFR) of 0.02 M at the redshift of Coma. The Abell 1367 24m dataset consists of a single mosaic obtained in medium scan mode, with scan leg spacing equal to the full array width, producing an effective exposure time per pixel of 40 sec.
The SExtractor package (Bertin & Arnouts, 1996) was used to automatically detect sources, and obtain photometric parameters. The images were first background-subtracted, and then filtered with Gaussian functions, with full width half maximum (FWHM) matching the 24m point-spread function (PSF). Aperture photometry was obtained for all objects having 8 contiguous pixels above the 1 rms background noise level. Following SWIRE, we measured the fluxes within circular apertures of diameter 21, 30, 60, 90 and 120′′. For the vast majority of sources, the 6′′ FWHM point-spread function of MIPS leaves the object unresolved at 24m, and hence we estimate the total 24m flux of these objects from the flux contained within the 21′′ aperture, corrected by a factor 1.29.
However, at the redshift of the Coma and Abell 1367 clusters, many of the brighter galaxies (spirals in particular) are larger than our nominal 21′′ diameter aperture, such that a significant fraction of their 24m flux is missed. For these galaxies, we use instead one of the larger apertures, matched to contain the optical flux as parametrized by R90z (the radius which contains 90% of the band flux) as measured from the SDSS image. Finally, for some of the bright cluster galaxies (9 in total), the value of R90z is under-estimated. To correct for this, SM eyeballed the 24m images of these objects, and estimated an appropriate radius, in each case, for extracting the ‘total’ 24m flux. In the case of the brighter spiral galaxies in Coma and Abell 1367, the 24m emission often shows significant structure due to spiral arms and star-forming regions, necessitating a high value of the deblending parameter, to prevent the galaxy being shredded by SExtractor. Particular care was required to correctly deblend the face-on spiral NGC 3861 from NGC 3861B, while keeping NGC 3861 intact. We note that for 50% of our sample the typical measurement error in the 24m flux is mJy (which is of the measured flux), and for the error is mJy. In total, 90% of our galaxies have 24m flux measured with uncertainty.
2.3 Matching the SDSS spectroscopic catalogue with the 24m sources
To match the SDSS spectroscopic catalogue for the Coma supercluster with the MIR 24m data, we choose the nearest optical counterpart within 5′′ of each 24m source. This accounts for a displacement of no more than 2.5 kpc between the centres. We note that 80% of the matches are found to have centres within 2′′ of each other. 16 of our sources above the detection threshold were found to have multiple matches within the matching radius of 5′′.
Our final dataset comprises of 3,787 galaxies () with spectroscopic redshifts from SDSS, and radial velocity within 2,000 km s-1 of Coma or Abell 1367, in the 500 square degree region of the sky covered by the Coma supercluster. Out of these, 197 within 2 Mpc of the centre of Coma and 24 within 0.65 Mpc of the centre of Abell 1367 are found to have a 24m counterpart. The probability that a background MIPS source lies within the matching radius of 5′′ by chance, depends only on the density of the 24m sources. For the completeness limit (0.33 mJy) adopted here, this density is deg-2 (see fig. 3 of Shupe et al., 2008). This gives the required probability as 0.018, implying that our sample of 197 24m detected galaxies in Coma may have 3–4 interlopers. A sample of the catalogue of data for the 24m detected galaxies is provided in Table LABEL:tbl:sb-table.
| RA | Dec | z | 24m flux | flag111 Classification on the basis of BPT diagram,where 0: unclassified 1: star-forming 2: AGN 3: AGN according to Miller et al. (2003) criteria (see text) | |||
| (J2000) | (J2000) | mag | mag | mag | (mJy) | ||
| 194.4574 | 28.6243 | 0.0250 | 17.80 | 17.35 | 17.24 | 0.31 | 1 |
| 195.1548 | 28.6641 | 0.0236 | 17.47 | 16.89 | 16.49 | 1.25 | 1 |
| 194.5385 | 28.7086 | 0.0255 | 15.21 | 14.56 | 14.08 | 36.02 | 1 |
| 194.9172 | 28.6308 | 0.0179 | 15.67 | 15.47 | 15.30 | 7.90 | 1 |
| 194.3645 | 28.4397 | 0.0260 | 17.16 | 16.57 | 16.19 | 0.75 | 1 |
| 194.5628 | 28.5218 | 0.0231 | 17.00 | 16.56 | 16.32 | 1.84 | 1 |
| 194.3912 | 28.4823 | 0.0209 | 14.35 | 13.54 | 13.00 | 1.86 | 3 |
| 194.4747 | 28.4998 | 0.0244 | 15.94 | 15.18 | 14.56 | 0.04 | 0 |
| 195.2170 | 28.3661 | 0.0255 | 14.51 | 13.73 | 13.10 | 1.39 | 0 |
| 195.3123 | 28.5217 | 0.0281 | 17.48 | 17.11 | 16.98 | 1.06 | 1 |
3 Star formation and AGN across the Coma supercluster
Located 100 Mpc from us, the Coma supercluster offers a unique opportunity for investigating the effect on individual galaxies of the hierarchical formation of structures in the Universe, as galaxies progress through various environments towards the cores of the clusters.
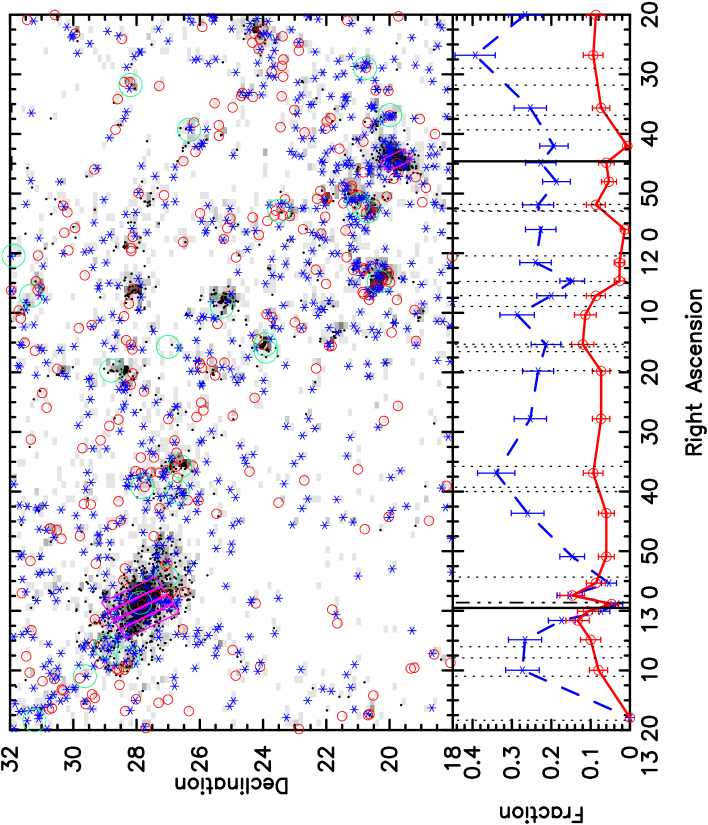
In order to give a general overview of the optical star formation properties of galaxies along the entire supercluster, in Fig. 1 we plot the positions of all the galaxies from the SDSS spectroscopic catalogue found in our redshift range, and the major galaxy groups obtained from the NASA Extragalactic Database (NED, http://nedwww.ipac.caltech.edu/). In order to avoid multiple detections, we consider the groups only from the NGS, WBL, USGC and HCG catalogues, and even amongst these, we identify duplication by merging groups closer than 1′ and within 100 km s-1 of each other.
The positions of AGN host galaxies, identified using the BPT diagram (Baldwin, Phillips & Terlevich, 1981, also see §4.2), and non-AGN starburst galaxies (star-forming on the BPT diagram, and having EW(Hα)25Å), are indicated in Fig. 1. We also show the limited regions at the cores of the Coma and Abell 1367 clusters, over which the 24m data are available, and utilised in this paper. Plotted in the bottom panel of the same figure, is the distribution of the AGN and starburst galaxies, as fractions of the 150 galaxies contributing to each bin. It is worth mentioning that although these distributions are a fair representation of the data, the binning has resulted in a spurious feature at the position of Abell 1367. As is already well known in the literature, the central region of Abell 1367 is sparsely populated, the majority of galaxies in the core being late-type. In this figure, it appears that the fraction of starburst galaxies does not decline in the core of Abell 1367, but if the data is re-binned so as to have equally-spaced bins, this would not be the case. Having said that, the decline in the fraction of starburst galaxies at the centre of Abell 1367 is much shallower than that seen in Coma.
In general, the optically-identified AGN seem to be more or less uniformly distributed throughout the supercluster (Figs. 1 and 2), except for a sharp decline in the cores of both the clusters. This latter result is counter-intuitive, because AGN hosts are known to be early-type massive galaxies which mostly reside in dense environments. Hence, this may indicate that the optical emission from the AGN present in this region is obscured and/or detectable at other wavelengths (radio/X-ray). The latter is beyond the scope of this work, but our MIPS 24m data supports the former possibility. As seen in Fig. 11, not only does the relative fraction of the red 24m galaxies marginally increase towards the centre, around 50% of them are found within 0.5 Mpc of the centre of the Coma cluster, indicating that optical emission from several AGN hosts may be obscured. Further evidence in support of this argument may be drawn from Fig. 8 where a large fraction of galaxies detected at 24m do not show [OIII] and/or Hβ in emission, but their Hα/[NII] flux ratios are consistent with the presence of an AGN (Miller et al., 2003) on the BPT diagram (Baldwin, Phillips & Terlevich, 1981).
We further investigate the environmental trends for AGN and star formation activity within the Coma supercluster, by estimating the local fraction of star-forming galaxies () and AGN () over the entire supercluster, both for massive galaxies (; , assuming from Blanton et al., 2001) and the dwarf galaxy population (; ). Following Haines et al. (2007), we define the local projected density of galaxies () using a variant of the adaptive kernel estimator (Silverman, 1986; Pisani, 1993), where each galaxy is represented by an adaptive Gaussian kernel . This is different from the algorithm of Silverman (1986), which, in its previous applications to astronomical data, requires the kernel width to be iteratively set to be proportional to . In this work, we fix the transverse width to be proportional to , where is the distance to the third nearest neighbour within 500 km s-1.
The dominant factors governing the star formation properties of a galaxy are the mass of its DM halo, and whether it is the central or a satellite galaxy in a halo (e.g. Kauffmann et al., 2004; Yang et al., 2005; Blanton et al., 2006). We adopt the above method, and choose the dimensions of the kernel, keeping this in mind. In the case of galaxies within groups or clusters, the local environment is measured on the scale of their host halo (0.1–1 Mpc), while for galaxies in field regions the local density is estimated by smoothing over their 5–10 nearest neighbours or on scales of 1–5 Mpc (for details, see Haines et al., 2007).
We can then map the local galaxy density () and -band luminosity density () as and , where is the -band luminosity of galaxy (see Fig. 3). Following Yang et al. (2005), we identify local maxima in the -band luminosity density as galaxy groups and clusters, whose masses correlate with the total -band luminosity associated with the peak. By comparison with the Millennium simulation, we expect all groups with 4 or more members to be associated with a local maximum in (Haines et al., 2007). The local -band luminosity density is shown as black contours in Figs. 2–4.
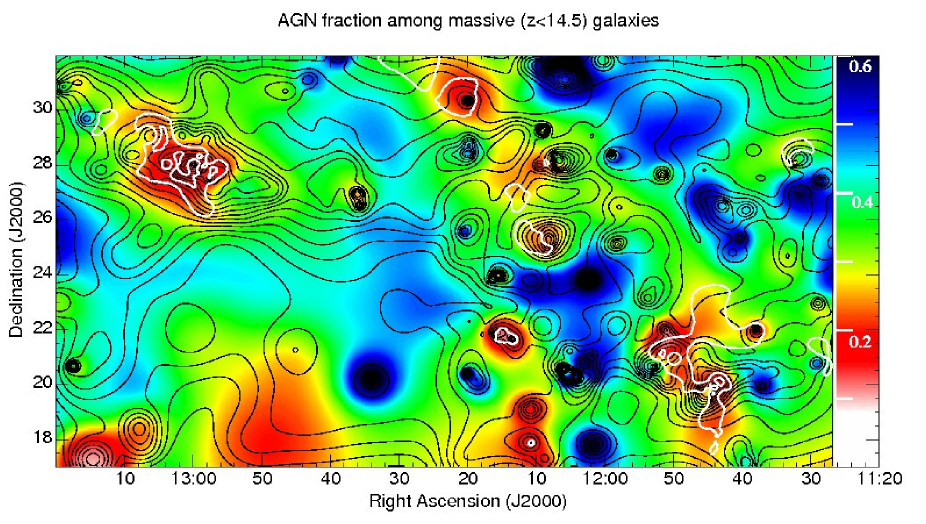
In Fig. 2 we show the spatial variation of among massive galaxies () across the supercluster, where we calculate as , where is the subset of galaxies classified as optical AGN, based on the ratios of thermally excited and recombination lines used in the BPT diagram. We do not consider the lower mass galaxies, as the fraction of AGN declines rapidly to zero below ;
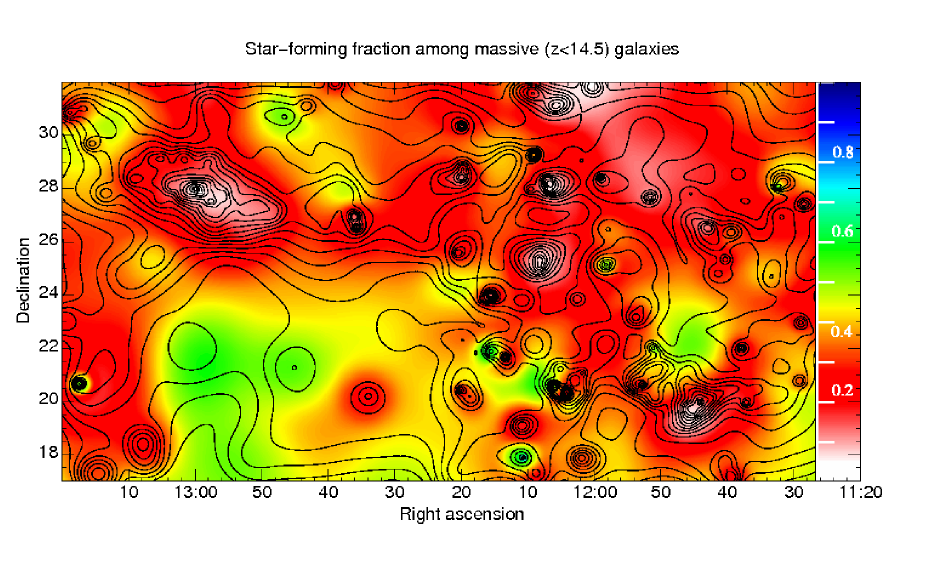
For comparison, Fig. 3 shows the distribution of as , where is the subset of galaxies classified as star-forming according to the line-ratios used in the BPT diagram. Fig. 4 shows a map of the local mean equivalent width (EW) of H of star-forming galaxies as , plotted in a manner analogous to that used by Haines et al. (2006) for galaxy colours in the Shapley supercluster.

In Fig. 2 we see that the AGN fraction , among massive galaxies () declines at the centre of the Coma and Abell 1367 clusters, while elsewhere, it is uniformly distributed. This appears to contradict the results of Haines et al. (2007), who found the AGN fraction to be independent of environment, and to be a monotonically increasing function of stellar mass. However, the volume studied by Haines et al. (2007) within SDSS DR4 did not cover clusters as rich as Coma or Abell 1367. This may indicate that only the very dense environments affect the optical AGN activity of galaxies. The relation between and local environment is unclear in the intermediate density group environment. While the values decline in the centre of some groups, in others they exceed the mean value for the field. Although there is a slight indication that the groups in which the appears to be declining, mostly lie on the filament connecting the Coma and Abell 1367, or in the vicinity of the clusters themselves, while the groups with higher values of lie in underdense regions. However, it is not possible to draw any firm statistical inferences from this observation.
Whether the AGN fraction varies with environment or not depends on how the activity of the galactic nuclei is defined. Miller et al. (2003) do not find any correlation between galaxy density and fAGN in a large sample of galaxies (), where the AGN are defined in terms of optical emission line ratios characterised by the BPT diagram. Other studies find higher incidence of optical AGN in groups and clusters (Arnold et al., 2009). If the AGN were selected according to their radio, mid-IR or X-ray properties, they would be found in differen hosts: radio AGN in early-type galaxies, IR AGN in bluer galaxies, and X-ray AGN in galaxies of intermediate colour (Hickox et al., 2009). The environment dependence of AGN activity is thus largely linked to the distribution of the hosts. The incidence of X-ray AGN is higher in galaxy groups than in galaxy clusters (Martini et al., 2006; Shen et al., 2007). The fraction of radio-loud AGN is the same in the brightest galaxies of groups and clusters and in the field, but higher in non-central galaxies (Best et al., 2005). Del Pozzo et al. (2010) show that the mass function of black holes is independent of environment, and the variation in the distribution of optical, radio and X-ray AGN can be understood in terms of the accretion processes that lead to the manifestation of the AGN in the various ranges of electromagnetic radiation.
We measured the significance of the spatial variations seen in across the supercluster by performing Monte Carlo simulations, in which we made repeated maps of after randomly assigning the positions of the AGN to the bright galaxies (i.e. testing the null hypothesis that is constant across the supercluster), and measuring the fraction of maps in which a given local value of was obtained within one of the Monte Carlo simulations. The results of these simulations are represented by the white contours, which indicate regions that have 1 and 2- below the mean value across the supercluster. This confirms that the decline in seen towards the core of the Coma cluster is significant at the 3 level, while that seen in Abell 1367 is significant at the 2 level.
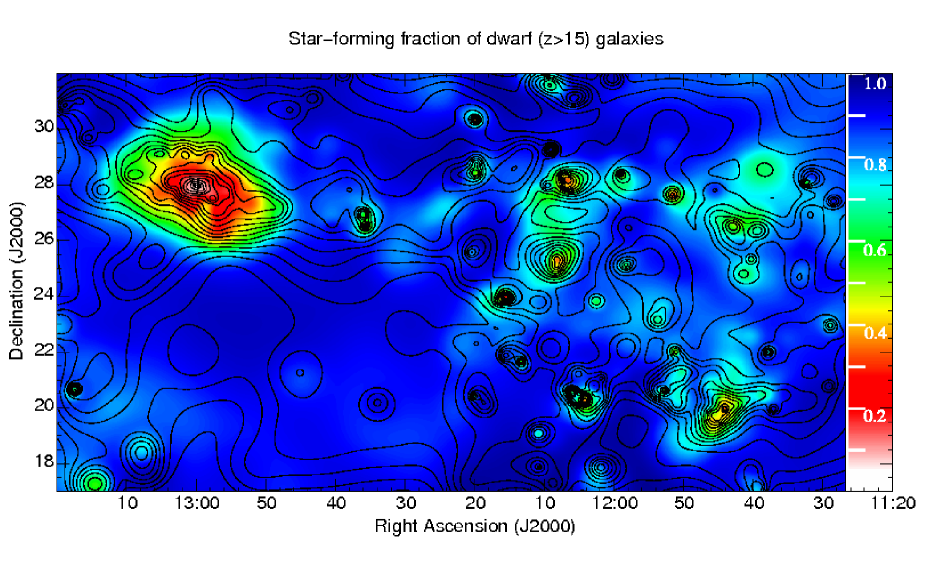
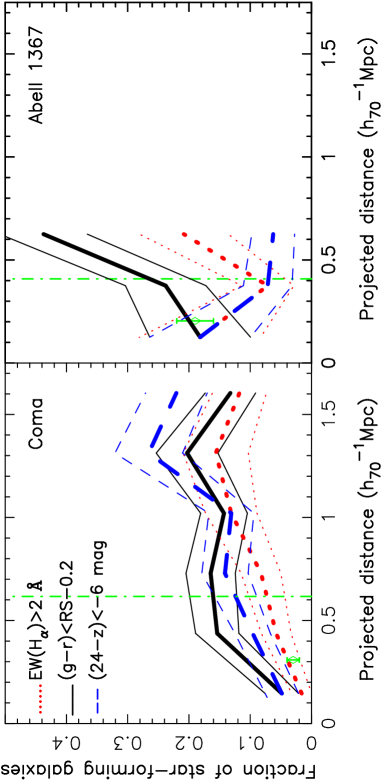
In Fig. 3 we show the general correlation between the fraction of star-forming galaxies () and environment for massive galaxies (; top panel) and the dwarf galaxies (; bottom panel). For the massive galaxies we find an almost uniform in all the environments. For dwarf galaxies, we see a much stronger SF-density relation, with rising rapidly from the .1–0.4 seen in the cluster cores, to in the field. This result is in agreement with literature, where, using colour or SFR indicators, it has been shown that dwarf galaxies exhibit much stronger radial trends with environment than their massive counterparts (Gray et al., 2004; Tanaka et al., 2004; Smith et al., 2006; Haines et al., 2007, among others). The origin of the SF-density relation for the dwarf galaxies can be attributed to the fact that (i) the star formation in dwarf galaxies can easily be quenched by the tidal impact of a massive neighbour and/or the ICM of the cluster (e.g. Larson, Tinsley & Caldwell, 1980), and (ii) unlike their massive counterparts, dwarfs (of the luminosities considered here) do not become passive by internal mechanisms such as gas consumption through star formation, merging etc.. However, the effects of supernovae wind blowouts and feedback become significant for relatively faint ( M⊙) dwarfs (e.g. Mac Low & Ferrara, 1999; Marcolini et al., 2006). In this work we do not find any evidence for the quenching of star formation in galaxies on the filament(s), but only in the cores of the embedded galaxy groups.
The Hα emission traces the current SFR of a galaxy, while the continuum flux under this line can be used as an indicator of its past SFR, making the globally averaged EW(Hα) from a galaxy an effective indicator of the birthrate parameter ( current SFR normalized by the SFR averaged over the lifetime of a galaxy). Recently, Lee et al. (2009) have shown that EW(Hα) Å corresponds to . In Fig. 4 we show the variation in the mean EW(Hα) as a function of environment for the star-forming dwarf galaxies. This is potentially a very powerful technique for dissociating the intrinsically active star formation history (SFH) of low-mass galaxies from a starburst caused by the impact of local environment (see Haines et al., 2007, for instance).
If galaxies are slowly quenched by interactions with their environment (Balogh et al., 2004a), a decline in the mean EW(Hα) is expected in the regions of denser environment. On the other hand, if star formation is triggered due to the impact of environment, the mean EW(Hα) should increase. Unlike the slow quenching of dwarfs in the dense environments (Tanaka et al., 2004; Haines et al., 2007), here, in the Coma supercluster, we find that the dwarf galaxies follow different evolutionary paths in the groups and in the denser cluster environments. In galaxy groups, a dwarf galaxy is slowly quenched via interactions with the other group members and/or the tidal field of the group, while in the clusters, an infalling dwarf experiences a starburst in the intermediate density environment at the cluster periphery (Porter et al., 2008; Mahajan, Raychaudhury & Pimbblet, 2010), and is then rapidly quenched via cluster-related environmental mechanisms, such as ram-pressure stripping.
In analogy to Fig. 2, we measure the significance of the spatial variations seen in the mean EW(Hα) via Monte Carlo simulations, this time by making repeated maps after randomly swapping the values of EW(Hα) among the dwarf star-forming galaxies. In doing this, we seek to test the null hypothesis that the EW(Hα) is independent of spatial position among star-forming galaxies. In Fig. 4, we show, as overlaid white contours, the regions in which the local observed mean value of the EW(Hα) is 2 and 3 above that averaged over the whole supercluster. This confirms that the excess star formation seen in the infall regions of Coma, and towards the core of Abell 1367, is indeed significant at 3 level. In quantitative terms, this excess in the infall regions of the Coma cluster is due to a population of 30 dwarf starburst galaxies (, EW(HÅ) located within or along the white 2- contours in Fig. 4. The analogous excess in the core of Abell 1367 can be ascribed to 10 starburst dwarf galaxies.
4 Optical and mid-IR analysis of Coma and Abell 1367 galaxies
The infrared (IR) emission from normal galaxies around m is dominated by hot dust in the Hii regions of massive stars, in addition to (usually) minor contribution from asymptotic giant branch (AGB) stars and the general interstellar medium (ISM). This recycled emission, together with the optical emission, can thus provide a good estimate of the total starlight of a galaxy and be used to better constrain the current and past star formation rate (SFR) of a galaxy (Calzetti et al., 2007; Kennicutt et al., 2009; Rieke et al., 2009, among others). While IR astronomers usually study late-type galaxies, early-type galaxies have received sporadic attention only in the context of the warm dust component detected in a few of them (e.g. Knapp et al., 1989).
In this paper, we combine the optical photometric and spectroscopic data taken by the SDSS DR7, with the 24m Spitzer/MIPS data, which is sensitive to processed optical emission from stars, to study the star formation activity of galaxies residing in the denser regions of the Coma supercluster.
4.1 Optical and MIR colours

In Fig. 5, we show the colour magnitude relation (CMR) for all the spectroscopic galaxy members () found in this region in the SDSS DR7, and those that are also detected at 24m in the Spitzer/MIPS observations. For comparison, the 24m galaxies found in Abell 1367 are also shown. We only use galaxies brighter than to fit the CMR. The CMR is of the form for all the Coma galaxies, where the mean absolute deviation from the relation is mag.
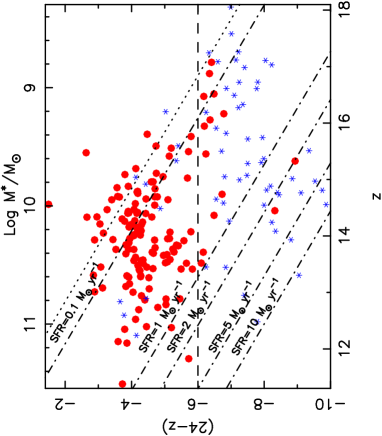
We repeat this analysis in Fig. 6 for the near-infrared (NIR) band of SDSS (-band), and the 24m MIPS band. The galaxies classified as red and blue on the optical colour-magnitude diagram, split into two separate classes around mag on the plot of the near/mid IR colour and magnitude as well. Although we overplot the lines of constant SFR in Fig. 6, according to the empirical relation given by Calzetti et al. (2007), it is important for the reader to consider that the 24m flux alone is an accurate SFR indicator only for the late-type, dusty star-forming galaxies (we return to this issue below). The SDSS -band, centred at 9000Å, is a good measure of the light from evolved stars, and hence the stellar mass of a galaxy. The top axis shows the stellar mass of galaxies estimated using the relation , from Bell et al. (2003). On the other hand, the 24m MIPS band in the MIR is a good proxy for the dust-processed light. This makes the colour an excellent approximation for the value of the specific star formation rate (SSFR or SFR/M∗) of galaxies.
Figs. 5 and 6 together show that the 24m detected red sequence galaxies in Coma have consistent optical and MIR colours. We note that the optical-MIR colours of the red sequence galaxies are not consistent with those expected from photospheric emission from old stellar populations, with an excess emission always apparent at 24m. The Spitzer Infrared Spectrograph observations of early-type galaxies in Virgo and Coma clusters show that the diffuse, excess emission, apparent at 10–30m in these galaxies, is due to silicate emission from the dusty circumstellar envelopes of mass-losing evolved AGB stars (Bressan et al., 2006; Clemens et al., 2009). The strength of this silicate emission is a slowly declining function of stellar age (Piovan, Tantalo & Chiosi, 2003), and persists even for very evolved stellar populations ( Gyr). The optical-MIR colours of Virgo and Coma galaxies have been found to be consistent with such old stellar populations (Clemens et al., 2009).
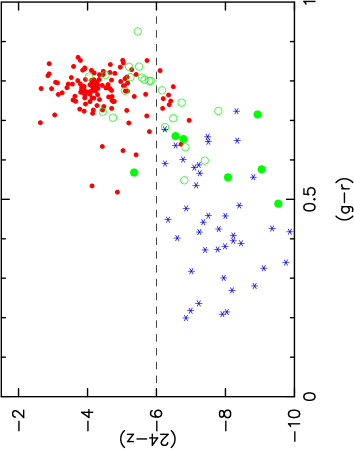
The blue galaxies in Fig. 5 have a wide spread in both colour and magnitude. The inhomogeneity of this class of galaxies becomes even more clear in Fig. 7, where we plot the optical colour against the near/mid-IR colour. Just as in Fig. 5, the passive red galaxies cluster in a small region of the colour-colour space, but the blue galaxies and (optical) AGNs span a wide range along both the axes. We note the clear separation of star-forming (blue stars) and passive (red points) galaxies in colour. The horizontal dashed line in Fig. 7 indicates our empirically chosen criterion to separate the two populations about . Interestingly, although the AGN and star-forming galaxies (green and blue symbols respectively) are classified on the basis of their optical spectra on the BPT diagram (Baldwin, Phillips & Terlevich, 1981, also see §4.2), they occupy distinct regions in this plot of optical vs optical-IR colour, as well.
4.2 Optical and 24m star formation indicators
The understanding of the formation of stars in galaxies requires, among other things, the measurement of the rate at which the interstellar gas is converted into stars. With the development of appropriate technology, radio, IR and UV photometry and spectroscopy are increasingly being employed, in addition to the traditional optical observations, for the purpose of measuring the rate of star formation. The dust clouds surrounding the young stellar concentrations absorb starlight and re-radiate it at IR wavelengths. Thus, the SFR measured by IR measurements is accurate only in the optically thick limit. The observed UV radiation escaped from the molecular clouds which block the UV light at earlier ages, comes mostly from stars with ages 107 - 108 yrs (Calzetti et al., 2005). H emission is produced only in the first few million years from the most massive stars (Leitherer et al., 1999). Indeed, a combination of UV, Hα and IR observations is required to give a full measure of the obscured and unobscured star formation. In this section, we attempt to combine the direct (optical) and the obscured (IR) radiation from the Coma and Abell 1367 galaxies to understand the process of star formation across this supercluster.
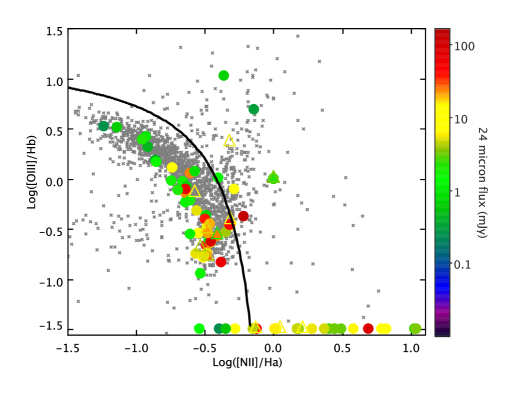
The 24m IR emission in galaxies can result from dust heated by young massive star clusters as well as the AGN. Since our MIPS data comes from the densest regions at the core of the Coma cluster (Fig. 1), which is a favourable environment for AGN hosts, it is important to investigate the origin of the 24m emission in these galaxies. To do so, in Fig. 8 we plot the usual ratios of optical emission linewidths ([OIII], Hβ, [NII] and Hα), known to distinguish star forming galaxies from those dominated by AGN, in what is popularly known as the BPT diagram (Baldwin, Phillips & Terlevich, 1981).
In Fig. 8, we show all the emission-line galaxies found in the 2,000 km s-1 redshift slice around Coma and/or Abell 1367, in the 500 square degrees Coma supercluster region (see Fig. 1), along with the galaxies detected at 24m (MIPS) in Coma (circles) and Abell 1367 (open triangles). Although we find a significant number of 24m detected galaxies with [NII]/Hα ratios suggestive of AGN, this does not mean that the 24m emission is predominantly due to AGN. Goulding & Alexander (2009) have tried to estimate the contribution of the AGN component to the IR emission from galaxies using Spitzer/IRS spectroscopy. Although only a few galaxies in their sample have IR fluxes produced predominantly by AGN, they also find that a substantial fraction of AGN are optically obscured, consistent with the results presented here.
We find that most of the galaxies which have measured values of all four emission lines are dusty star forming galaxies. However, interestingly, a large number of galaxies detected at 24m in Coma that do not show emission in [OIII] and/or Hβ, do have a [NII]/Hα flux ratio consistent with the presence of an AGN. Such galaxies can be classified as AGN if ([NII]/Hα)-0.2 (Miller et al., 2003).

The EW of the Balmer lines, especially that of the Hα emission line, has been extensively used to estimate the current optical SFR of galaxies. It has been shown in the literature that the 24m flux is a good measure of dust-processed star light (e.g. Calzetti et al., 2007). But, the 24m observations used in this work cover the very central regions of the Coma cluster, and Abell 1367, which comprises mostly of early-type galaxies. In order to test the correspondence between the direct and dust-processed SFR tracers, in Fig. 9 we plot the colour as a function of spectroscopically measured EW(Hα). We also colour-code the symbols according to the concentration parameter of the galaxies (ratio of the Petrosian radii R90r/R50r from the SDSS photometric catalogue, which is an indicator of morphology). Passive spirals often have concentration indices consistent with early-types (R90r/R; also see Mahajan & Raychaudhury, 2009). But Fig. 9 shows that both the spiral and spheroidal galaxies are uniformly distributed along both the axes, implying that the emission-line galaxies detected at 24m at the core of Coma and Abell 1367 are not dominated by galaxies of any particular morphological type (as quantified by the concentration index).
Due to the dominance of early-type galaxies in our 24m sample, it is not surprising that only a small fraction of galaxies classified as star-forming on the basis of their colour (Fig. 6), show no signs of current star formation in their optical spectra. For completeness, at EW(Hα) Å we plot all the 24m detected galaxies that do not show optical emission in Hα. As expected, most of these galaxies have colours and concentration parameters consistent with those of quiescent early-type galaxies. This suggests that their 24m emission is primarily due to the contribution from AGB stars, which (unlike young stars) do not produce Hα emission. The good overall correspondence between the photometric colour and spectroscopic EW(Hα) makes the colour a good candidate for comparing the star formation activity in nearby galaxies, in the absence of optical spectra.
4.3 Varying fractions of star-forming galaxies with SFR tracer: implications for the Butcher-Oemler effect
Photometric colours and EWs of emission lines like [OII] and Hα have been extensively used for studying the evolution of galaxies in time and across the sky. In one such pioneering work, Butcher & Oemler (1984, BO84) found that clusters at moderate to high redshifts contain an ‘excess’ of blue galaxies, relative to their local counterparts. They estimated the blue fraction by considering galaxies found within R30 (radius containing 30% of all red sequence galaxies), for which the optical broadband colours are bluer by at least 0.2 mag than that of the red sequence galaxies. For the redshift regime of Coma (), BO84 found a uniform blue fraction within R30. Since then, several such studies have sought to quantify and validate the Butcher-Oemler effect for different samples of clusters. Some of these define their samples in a way similar to that of BO84, and obtain similar results (e.g. Margoniner & Carvalho, 2000).
Using panoramic MIR data for 30 clusters (including both Coma and Abell 1367) over , Haines et al. (2009) are able to reproduce the Butcher-Oemler effect using a fixed limit in (equivalent to a fixed SFR of 8 M⊙yr-1), but show that the Butcher-Oemler effect can be largely explained as a consequence of the cosmic decline in star formation (Le Floc’h et al., 2005; Zheng et al., 2007). In this case, the blue galaxies in clusters are those that are recently accreted from the field (accretion has occurred at a relatively constant rate since ; Berrier et al., 2009), but since the global level in star formation among these galaxies has declined, a smaller fraction of the infalling population is classed as blue (which assumes a non-evolving level of star formation), resulting in the observed Butcher-Oemler effect.
Elsewhere (Balogh, Navarro, & Morris, 2000; Ellingson et al., 2001; De Propris et al., 2004), studies going out to several multiples of the cluster-centric radius, scaled by R200, show the effect of the chosen aperture size on the blue fraction. It has been shown that the observed gradual radial trend of is consistent with a simple infall scenario, whereby the star-forming galaxies are infalling field galaxies, which are then quenched rapidly upon their first passage through the cluster core (e.g. Balogh, Navarro & Morris, 2000; Ellingson et al., 2001; Haines et al., 2009). By comparing the photometric colour with the spectroscopically determined SSFR, Mahajan & Raychaudhury (2009) show that the presence of metal-rich stellar populations in low redshift cluster galaxies can also influence the evolutionary trends such as the Butcher-Oemler effect, if they are studied only using galaxy colours. Several recent studies indicate that a non-negligible fraction of red sequence galaxies show signs of ongoing star formation from their optical spectra and/or broad-band colour, and that a robust separation of passive and star-forming galaxies requires mutually independent data (e.g. Bildfell et al., 2008). In this work, we show that in the Coma Supercluster, the value of not only varies with the cluster-centric aperture used for measuring the blue fraction, but can also be severely effected by the SFR tracer employed.
In Fig. 10 we plot the fraction of non-AGN, star-forming galaxies found using 3 different criteria: (i) IR colour [( mag; Fig. 6], (ii) EW(Hα)Å and, (iii) the photometric colour is bluer than that of the fitted red sequence (Fig. 5, by more than the mean absolute deviation, for all the Coma and Abell 1367 galaxies. BO84 had included galaxies brighter than (H km s-1Mpc-1) in their sample. To make a fair comparison with the work of Butcher & Oemler (1984), without adding uncertainties by using empirical relations to convert magnitudes from one passband to the other, in Fig. 10 we choose to only include galaxies brighter than (; Blanton et al., 2001) for calculating the fractions. Also, note that all the spectroscopic galaxy members are used to calculate the fractions in each radial bin.
These distributions show that, by taking into account the obscured star formation estimated from the 24m flux, the fraction of star-forming galaxies can dramatically vary at any given radius from the centre of the cluster. In both clusters, the ‘blue’ fraction () is higher, and flattens at lower cluster-centric radii, than the estimated using the EW(Hα), evidently showing a significant contribution of the post-starburst galaxies to the fraction (also see Section 5.2). We note that this trend may vary if the dusty red galaxies have a non-negligible contribution in building the red sequence. But as seen in Fig. 5, in the Coma cluster, this does not seem to be the case.
It is interesting to note that unlike Coma, Abell 1367 has an increasing fraction of blue galaxies with cluster-centric radius (black lines), but an inverse trend emerges when the fractions are measured using the colour (blue lines) or the Hα EW (red lines). This implies that some of the blue galaxies outside the core of Abell 1367 are post-starburst galaxies (see Fig. 12). This result supports the results obtained in the more general work of Mahajan & Raychaudhury (2009), who show that using a single galaxy property, such as the broadband colour, is not an appropriate way of quantifying evolutionary trends like the Butcher-Oemler effect.
5 Discussion
In this paper we set out to understand the relationship between the star formation activity in galaxies, as depicted by an assortment of indicators encompassing the optical and 24m mid-IR wavebands, and their immediate and global environment, in the Coma supercluster. A wide range of local and global environments of galaxies, and a uniform optical coverage across the entire square degrees of sky, make this supercluster an ideal laboratory for examining the environmental dependence of galaxy properties. We discuss below the implications of the results from our analysis presented in §3 and §4.
5.1 The spatial and velocity distribution of galaxies detected at 24m

The 24m data for the Coma cluster extend out to a few times its core radius (Fig. 10), allowing us to analyse the spatial (sky and velocity) distribution of the galaxies detected at 24m, relative to all the spectroscopic members found in the SDSS. In order to do so, in Fig. 11, we plot the distribution of all the spectroscopic galaxies, and the (optically) red and blue galaxies detected at 24m respectively. As discussed above (Figs. 5 and 6), in Coma both the 24m and optical colours mostly segregate the same galaxies into ‘red’ and ‘blue’ ones. Fig. 11 (top panel) shows that, of the 24m detected galaxies, the distribution of the (optically) red ones is similar to that of all the galaxies, but the (optically) blue ones tend to peak 1.0 Mpc from the centre of Coma.
In Fig. 11 (bottom panel), we plot the distribution of the line of sight (l.o.s.) velocities of galaxies, with respect to the mean velocity of the Coma cluster (called the ‘relative velocity’ hereafter), for the same three sets of galaxies. The distribution of the relative velocity of ‘all’ and (optically) red galaxies are statistically similar. But the (optically) blue 24m galaxies show a bimodal distribution, with a large fraction of one mode concentrated around relative velocity km s-1. A Kolmogorov-Smirnoff (K-S) test suggests that the probability of the parent distribution of the relative velocities of red and blue galaxies being sampled from the same population is . The same comparison between the relative velocity distribution of ‘all’ and blue galaxies gives , suggesting that it is highly unlikely that the blue and red (or ‘all’) galaxies are drawn from the same parent distribution (Fig. 11). This leads us to conclude that a non-negligible fraction of the (optically) blue 24m galaxies within Mpc of the centre of the Coma cluster are star-forming galaxies which may belong to the substructure associated with NGC 4839 (see §5.3 for further discussion).
The l.o.s. velocity distribution of the (optically) blue 24m galaxies is highly non-Gaussian, with an excess at km s-1, suggesting that many of them have recently entered the cluster. If these blue 24m galaxies were virialized, a Gaussian distribution centered on , like that seen for the red (red dashed histogram) and ‘all’ (solid black histogram) galaxies would be expected.
The current episode of star formation in these galaxies can be attributed to the environmental impact of the cluster’s ICM (e.g. Poggianti et al., 2004), or the enhanced galaxy density in the infall region (e.g. Mahajan, Raychaudhury & Pimbblet, 2010). This result is consistent with the findings of Caldwell & Rose (1997), who analysed the spectra of early-type galaxies in 5 nearby clusters, including Coma, and found that in 4 of the 5 clusters, the early-type galaxies show signatures of recent star formation in their spectra (also see §5.2).
5.2 The distribution of k+A galaxies
The post-starburst, or k+A galaxies, as they are popularly known in the literature, are passive galaxies that have recently (1-1.5 Gyr) experienced a strong burst of star formation. These galaxies are very crucial in understanding the impact of environment on various galaxy properties, especially their SFR. The spectrum of a k+A galaxy shows strong absorption in Hδ, but little or no emission in Hα.
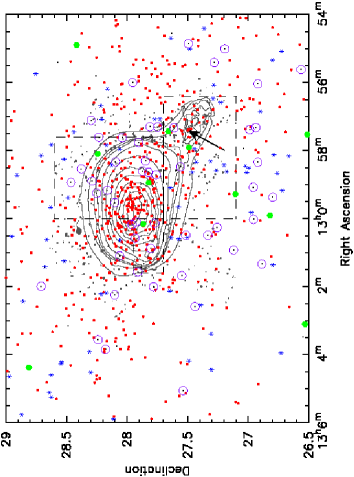
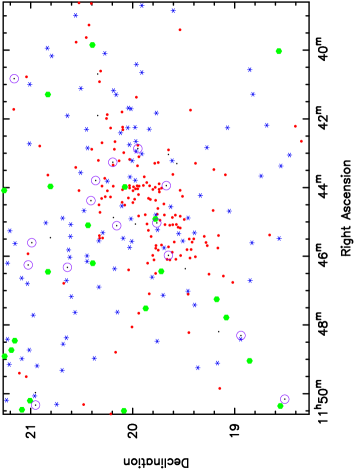
In this work we make use of the SDSS DR7 spectroscopic galaxy catalogue () for identifying the k+A galaxies (EW(HÅ & EW(HÅ) in the Coma supercluster (Please note that throughout this work, negative values of EW indicate absorption). In Fig. 12 we show these k+A galaxies together with the passive, star-forming and AGN galaxies in and around the Coma and Abell 1367 cluster respectively. As can be easily seen, the k+A galaxies preferentially avoid the dense region in the cluster core but inhabit the surrounding infall regions out to Mpc (almost twice the virial radius). In Fig. 12 we have also over-plotted the contours of intensity from the mosaicked 0.5–2 keV image of the core of Coma cluster from XMM-Newton EPIC/PN observations (Finoguenov, Briel, & Henry, 2003), kindly supplied to us by A. Finoguenov. We note that there are almost no star-forming galaxies in the X-ray emitting region of the core. This observation further strengthens the argument that the changes in environment, experienced by a galaxy on the outskirts of clusters, play a key role in modulating the properties of galaxies, especially the dwarfs (e.g. Porter et al., 2007, 2008).
By analysing deep () photometric and spectroscopic optical data for 3 regions in Coma (two near the centre and one near NGC 4839, each Mpc in size), Poggianti et al. (2004) found that 10% of the cluster’s dwarf () galaxies have post-starburst spectra. They also used the results from the X-ray analysis of Neumann et al. (2003) to show that the k+A galaxies in the Coma cluster are likely to be a result of the interaction between the Coma cluster and the adjoining NGC 4839 galaxy group (see §5.3). In Fig. 12, we overplot as dashed rectangles, the approximate location of the substructures found by Neumann et al. (2003). As has been shown by Poggianti et al. (2004, their fig. 6), on the western side of the Coma cluster, the k+A galaxies seem to lie along the X-ray substructure (also see fig. 2 of Neumann et al., 2003). We demonstrate this by overplotting contours of X-ray intensity in Fig. 12.
However, it is also interesting to note that the southern substructure, apparent from the X-ray contours, is almost devoid of k+A galaxies, but has a stream of star-forming dwarf galaxies flowing towards the cluster core (Fig. 4; also see §5.4). Contrary to Poggianti et al. (2004), by taking into account the extended region surrounding the Coma cluster, we find that the k+A galaxies preferentially avoid the cluster core but their spatial distribution does not show any correlation with the substructure evident in the X-ray emission (Fig. 12).
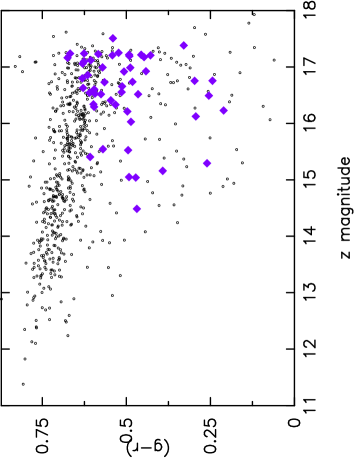
In Fig. 13 we examine the position of the k+A galaxies in the Coma cluster in the plot of colour vs magnitude. Fig. 13 show that almost all the k+A galaxies in Coma are dwarfs (), suggesting that either only the infalling dwarf galaxies are rapidly quenched, or the SFR- relation (e.g. Feulner et al., 2005) dilutes the post-starburst signature in massive galaxies. Since dwarf k+A galaxies in the Coma supercluster are found on the outskirts of Coma and Abell 1367 clusters, and occasionally in galaxy groups embedded elsewhere in the large-scale structure (LSS), this might suggest that dwarf galaxies falling into deeper potentials are more likely to show k+A features, while those being assimilated into galaxy groups may be quenched on a longer time-scale. We will probe this in greater detail in a later paper.
The handful of galaxies with very blue colours (; Fig. 13) are the k+A dwarfs in which the episode of starburst could have ended Myr ago, unlike the more evolved red post-starburst dwarfs (Poggianti et al., 2004). By studying spectra of early-type galaxies () in Coma, Caldwell & Rose (1997) also found that 15% of these galaxies show signatures of recent or ongoing star formation. Based on this result, Caldwell & Rose (1997) suggested that the present day clusters act as a catalyst for galaxy evolution, though at a reduced level as compared to their high redshift counterparts.
Given the vulnerable nature of dwarf galaxies, it is not surprising that a large fraction of them are the first ones to reflect the impact of rapid changes in their environment during the transition from filament to cluster. This contributes to dwarf galaxies having a better-defined SF-density relation, relative to their more massive counterparts (Fig. 4). Table 2 shows that 11.4% of dwarfs in Coma, 4.8% in Abell 1367 and 2.1% in the neighbouring supercluster region have spectra with k+A features. This evidently shows that the mechanisms responsible for quenching star formation in dwarf galaxies and rapidly transforming them to passive galaxies via the post-starburst phase, are strongly dependent on the cluster potential. This result is also in agreement with the observation of excessive red, dwarf ellipticals (dEs) in the Coma cluster (Jenkins et al., 2007). In Table 3 we provide a list of all the 110 k+A dwarf () galaxies found in the entire Coma supercluster.
| RA | Dec | Redshift | EW(Hα) | EW(Hδ) | |
|---|---|---|---|---|---|
| (J2000) | (J2000) | mag | Å | Å | |
| 195.4972 | 28.7095 | 0.0203 | 16.8559 | -1.9535 | -20.5023 |
| 194.7338 | 28.4636 | 0.0198 | 15.1591 | -2.6499 | -5.6373 |
| 174.6209 | 28.5871 | 0.0236 | 15.3615 | 1.8792 | -3.9275 |
| 192.4220 | 28.8448 | 0.0218 | 17.1838 | -1.3320 | -30.0913 |
| 192.8569 | 28.7203 | 0.0241 | 17.0417 | -1.1904 | -3.1975 |
| 193.9028 | 26.5644 | 0.0211 | 16.9923 | -1.8170 | -6.2012 |
| 194.5201 | 26.3706 | 0.0232 | 15.7774 | -1.8387 | -6.3831 |
| 195.0435 | 26.4612 | 0.0221 | 16.6272 | -2.0973 | -3.2747 |
| 189.0882 | 27.0333 | 0.0251 | 16.6488 | -1.9006 | -3.0789 |
| 194.0083 | 26.9208 | 0.0191 | 16.5278 | -1.4534 | -4.9134 |
5.3 Coma and NGC 4839
As noted above, the Coma cluster is known to have significant substructure in the optical and X-ray maps. The most prominent X-ray emitting substructure is associated with a galaxy group, of which NGC 4839 is the most prominent galaxy. By combining N-body hydrodynamical simulations with ROSAT X-ray and VLA radio observations, Burns et al. (1994) remarked that the NGC 4839 group has already passed through the core of Coma 2 Gyr ago, and is now on its second infall (also see Caldwell & Rose, 1997). However, several other studies based on optical spectroscopy and imaging, and X-ray observations conclude otherwise (Colless & Dunn, 1996; Neumann et al., 2003; Adami et al., 2005). No consensus seems to have been reached on the dynamical state of NGC 4839. Studies supporting the first infall argument suggest that the NGC 4839 galaxy group has a velocity dispersion () of 329 km s-1 (e.g. Colless & Dunn, 1996), while others claim it to be as high as 963 km s-1 (e.g. Caldwell et al., 1993), the latter being consistent with the scenario where the galaxies belonging to the group have dispersed during their first passage through the cluster.
Located Mpc from the centre of the Coma cluster, the NGC 4839 galaxy group was first detected as an asymmetric extension to the otherwise relaxed X-ray morphology of Coma (Briel, Henry and Böhringer, 1992). Several authors have discovered post-starburst (k+A) galaxies associated with this group (Caldwell et al., 1993; Caldwell & Rose, 1997; Poggianti et al., 2004). In this work, we find that most of the known post-starburst galaxies in Coma, such as those found by Poggianti et al. (2004), are either not detected at 24m, or show little MIR emission. We hence confirm that almost none of these post-starburst galaxies have a significant amount of obscured star formation going on in them.
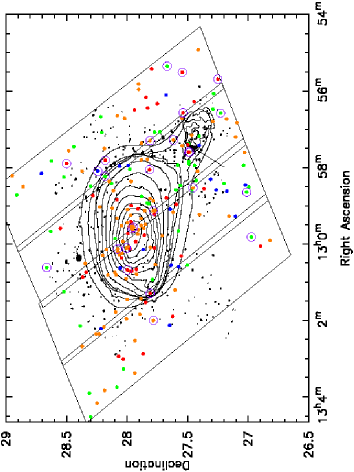
Struck (2006) suggests that when a galaxy group passes through the core of a cluster, as suggested by Burns et al. (1994) for Coma and NGC 4839, the group galaxies are gravitationally shocked. In this scenario, enhancement in star formation activity is a natural consequence of an increase in galaxy-galaxy interactions among group galaxies. Such a scenario has been suggested for Coma and NGC 4839 by Neumann et al. (2003). Fig. 14 may provide circumstantial evidence to support this argument.
In Fig. 14 we show the spatial distribution of the 24m detected Coma galaxies colour-coded by their () colour. The blue 24m galaxies constituting the peak, which also corresponds to the mean velocity of the NGC 4839 group (Fig. 11), are explicitly shown. However, poor statistics in our data do not allow us to favour any of the 2 scenarios associated with the NGC 4839 galaxy group and the Coma cluster, namely, (i) whether the group is on it’s first infall, or (ii) it has already passed through the core and is on it’s second passage.
5.4 Coma, Abell 1367 and the filament
In the hierarchical model, galaxy clusters grow by accretion and/or mergers with other clusters and groups. In simulations, galaxies are seen to be accreted along the network of filaments of galaxies, feeding these clusters, along preferred directions (e.g. Bond, Kofman, & Pogosyan, 1996). Although several observational techniques are now being implemented to detect and quantify such large-scale structures (LSS), the low surface density of matter, enormous spatial scale, and projection effects make it difficult to observe the extent of these filaments of galaxies (Colberg, 2007).
One way of exploring the evolution of the LSS is to probe its impact on the galaxies traversing them. The spectacular filament crossing the Coma and Abell 1367 clusters is an exclusive object in the low redshift Universe, because it is not only traced by the spatial distribution of galaxies (Fig. 1), but has also been detected at radio wavelengths (Kim et al., 1989). One of the aims of this paper is to understand and interpret the difference in the evolutionary paths adopted by galaxies in the vicinity of the clusters, the filament and the groups embedded in the filament. In agreement with the scenario emerging in the literature (Gray et al., 2004; Tanaka et al., 2004; Smith et al., 2006; Haines et al., 2007, among others), we find that the SFR-density relation across the Coma supercluster is much weaker for the massive galaxies (; Fig. 3), relative to the dwarfs (; Figs. 3 & 4).
Empirical studies of galaxies infalling into clusters along filaments suggest that an enhanced galaxy density at the cluster periphery may lead to a burst of star formation in them, consuming a large fraction of cold gas (e.g. Porter et al., 2008; Mahajan, Raychaudhury & Pimbblet, 2010). This effect would be more efficient for the dwarf galaxies. In a study based on the SDSS data, Haines et al. (2007) find that the dwarf galaxies () residing in high density regions show a systematic reduction of in their Hα emission relative to the mean of the sample, leading the authors to favour slow quenching of star formation in these galaxies (also see Balogh et al., 2004a; Tanaka et al., 2004). On the contrary, in Coma we find that the infalling star-forming dwarf galaxies undergo a burst of star formation, followed by rapid quenching (Fig. 4, also see Section 5.2).
In contrast, star formation in dwarf galaxies infalling into galaxy groups, seems to be slowly quenched without an intermediate starburst phase, resulting in the observed reduction in the mean EW(Hα) values seen in the vicinity of groups in Fig. 4. This observation could be attributed to the relatively inefficient ram-pressure stripping in galaxy groups (Tanaka et al., 2004), transforming infalling galaxies slowly over several Gyr via a process involving progressive starvation (Larson, Tinsley & Caldwell, 1980).
Another notable fact in Fig. 4 is the orientation of the stream of blue star-forming galaxies southward of Coma, almost orthogonal to the direction of elongation of the galaxy density (Figs. 3 & 4). This may be significant given the observations presented in the previous section (also see Burns et al., 1994). Consistent with the results presented in literature, we find that the instantaneous SFR of a galaxy depends upon the stellar mass of the galaxy, as well as on the local galaxy density, and on whether the galaxy is in a group or cluster. The cosmic web does play a crucial role in defining the evolutionary path of the galaxy, as is seen by different rate of quenching of dwarf galaxies in groups and clusters (Fig. 4). The different fractions of dwarf k+A galaxies in the three major components of this supercluster further strengthens this argument (Table 2). It is indeed remarkable that the Coma and Abell 1367 clusters, that are well known to have very different galaxy properties, influence the star formation histories of the infalling galaxies very differently. While the fraction of star-forming and k+A dwarf galaxies in Abell 1367 vary by a factor of 10 ( 52% & 4.8% respectively; Table 2), in the Coma cluster neither dominate (12.5% & 11.4% respectively; Table 2).
6 Conclusions
This work is a step ahead in understanding the star formation properties of galaxies in one of the richest nearby superclusters. We analyse the spectroscopic and photometric data obtained by the SDSS and archival 24m data obtained by the MIPS instrument on board Spitzer. Our major results are:
-
•
The fraction of (optical) AGN drops significantly () in the dense cluster environment. But the relation between AGN activity and environment is unclear in the intermediate density environments of galaxy groups.
-
•
Star formation in massive galaxies () seems to be low everywhere in the supercluster region studied here, almost independent of the local environment. In sharp contrast, the dwarf galaxies () can be seen to be rapidly forming stars everywhere, except in the dense cluster and group environments.
-
•
The passive, AGN host and star-forming galaxies as classified from their optical spectra, occupy different regions on the colour-colour diagram.
-
•
The fraction of star-forming galaxies in Coma is determined to within %, irrespectively of the definition of star-forming in terms of optical colour, optical-mid-IR colour or EW(Hα). Many of the blue galaxies in Coma are found to be post-starburst galaxies, whose blue colours are due to a recent burst of star formation which has now terminated, as revealed by their lack of Hα emission and excess Hδ absorption. However, in Abell 1367, the obtained using the 3 different indicators show different trends. While the fraction of blue galaxies increases outward from the centre, the obtained by employing the () near/mid IR colour decreases away from the centre of Abell 1367.
-
•
Most of the (optically) blue 24m galaxies detected in Coma are on their first infall towards the cluster. The current episode of star formation in such galaxies is possibly a result of a rapidly changing local environment.
-
•
11.4% of all dwarf () galaxies within Mpc2 of the centre of Coma, and 4.8% within the same area around Abell 1367 have post-starburst (k+A) type spectra. In the surrounding supercluster region this fraction drops to 2.1% only, suggesting that the mechanism(s) responsible for quenching star formation in dwarfs depends upon the cluster’s potential. The starburst, rapid quenching and subsequent k+A phase requires the dense ICM and high infall velocities attainable in rich clusters, as opposed to galaxy groups where star formation in infalling dwarf galaxies appears to be quenched gradually. The k+A galaxies preferentially avoid the dense centre of the cluster.
-
•
The spatial distribution of the k+A galaxies suggests a correlation between the substructure of the Coma cluster (revealed in the X-ray emission) and the mechanisms responsible for quenching star formation in galaxies.
7 Acknowledgments
We thank Dr Alexis Finoguenov and Dr Ulrich Briel for providing us the XMM-Newton EPIC/PN 0.5–2 keV mosaic image of the Coma cluster used in Figs. 12 and 14. SM is supported by grants from ORSAS, UK, and the University of Birmingham. CPH acknowledges financial support from STFC. We are very grateful to the anonymous referee for constructive comments that were very helpful in improving this paper.
This research has made use of the SAO/NASA Astrophysics Data System, and the NASA/IPAC Extragalactic Database (NED). Funding for the SDSS and SDSS-II has been provided by the Alfred P. Sloan Foundation, the Participating Institutions, the National Science Foundation, the U.S. Department of Energy, the National Aeronautics and Space Administration, the Japanese Monbukagakusho, the Max Planck Society, and the Higher Education Funding Council for England. A list of participating institutions can be obtained from the SDSS Web Site http://www.sdss.org/.
References
- Adami et al. (2005) Adami C., Biviano A., Durret F., Mazure A., 2005, A&A, 443, 17
- Adelman-McCarthy et al. (2006) Adelman-McCarthy et al., J. K., 2006, ApJS, 162, 38
- Arnold et al. (2009) Arnold T. J., Martini P., Mulchaey J. S., Berti A., Jeltema T. E., 2009, arXiv, arXiv:0911.0392
- Bai et al. (2006) Bai L., Rieke G. H., Rieke M. J., Hinz J. L., Kelly D. M., Blaylock M., 2006, ApJ, 639, 827
- Bai et al. (2010) Bai, L., Rasmussen, J., Mulchaey, J. S., Dariush, A., Raychaudhury, S., Ponman, T. J., 2010, ApJ, submitted
- Baldwin, Phillips & Terlevich (1981) Baldwin J. A., Phillips M. M., Terlevich R., 1981, PASP, 93, 5
- Balogh, Navarro & Morris (2000) Balogh M. L., Navarro J. F., Morris S. L., 2000, ApJ, 540, 113
- Balogh et al. (2004a) Balogh M., et al., 2004, MNRAS, 348, 1355
- Balogh, Navarro, & Morris (2000) Balogh M. L., Navarro J. F., Morris S. L., 2000, ApJ, 540, 113
- Bell et al. (2003) Bell E. F., McIntosh D. H., Katz N., Weinberg M. D., 2003, ApJS, 149, 289
- Bernstein et al. (1994) Bernstein G. M., Guhathakurta P., Raychaudhury S., Giovanelli R., Haynes M. P., Herter T., Vogt N. P., 1994, AJ, 107, 1962
- Berrier et al. (2009) Berrier J. C., Stewart K. R., Bullock J. S., Purcell C. W., Barton E. J., Wechsler R. H., 2009, ApJ, 690, 1292
- Bertin & Arnouts (1996) Bertin E., Arnouts S., A&AS, 117, 393
- Best et al. (2005) Best, P. N., Kauffmann, G., Heckman, T. M., Brinchmann, J., Charlot, S., Ivezić, Ž., & White, S. D. M. 2005, MNRAS, 362, 25
- Bildfell et al. (2008) Bildfell C., Hoekstra H., Babul A., Mahdavi A., 2008, MNRAS, 389, 1637
- Blanton et al. (2001) Blanton M. R., et al., 2001, AJ, 121, 2358
- Blanton et al. (2006) Blanton M. R., Eisenstein D., Hogg D. W., Zehavi I., 2006, ApJ, 645, 977
- Bond, Kofman, & Pogosyan (1996) Bond J. R., Kofman L., Pogosyan D., 1996, Nature, 380, 603
- Boselli et al. (1997a) Boselli A., Gavazzi G., Lequeux J., Buat V., Casoli F., Dickey J., Donas J., 1997, A&A, 327, 522
- Boselli et al. (1997b) Boselli A., et al., 1997, A&A, 324, L13
- Bothun, Schommer, & Sullivan (1984) Bothun G. D., Schommer R. A., Sullivan W. T., III, 1984, AJ, 89, 466
- Bressan et al. (2006) Bressan A., et al., 2006, ApJ, 639, L55
- Briel, Henry and Böhringer (1992) Briel U. G., Henry J. P., Böhringer H., 1992, A&A, 259, L31
- Burns et al. (1994) Burns J. O., Roettiger K., Ledlow M., Klypin A., 1994, ApJ, 427 L87
- Butcher & Oemler (1984) Butcher H., Oemler A., Jr., 1984, ApJ, 285, 426
- Caldwell et al. (1993) Caldwell N., Rose J. A., Sharples R. M., Ellis R. S., Bower R. G., 1993, AJ, 106, 473
- Caldwell & Rose (1997) Caldwell N., Rose J. A., 1997, AJ, 113, 492
- Calzetti et al. (2005) Calzetti D., et al., 2005, ApJ, 633, 871
- Calzetti et al. (2007) Calzetti D., et al., 2007, ApJ, 666, 870
- Chincarini & Rood (1976) Chincarini G., Rood H. J., 1976, ApJ, 206, 30
- Clemens et al. (2009) Clemens M. S., Bressan A., Panuzzo P., Rampazzo R., Silva L., Buson L., Granato G. L., 2009, MNRAS, 392, 982
- Colberg (2007) Colberg J. M., 2007, MNRAS, 375, 337
- Colless & Dunn (1996) Colless M., Dunn A. M., 1996, ApJ, 458, 435
- Cortese et al. (2004) Cortese L., Gavazzi G., Boselli A., Iglesias-Páramo J., Carrasco L., 2004, A&A, 425, 429
- Cortese, Gavazzi, & Boselli (2008) Cortese L., Gavazzi G., Boselli A., 2008, MNRAS, 390, 1282
- Davis & Mushotzky (1993) Davis D. S., Mushotzky R. F., 1993, AJ, 105, 409
- Del Pozzo et al. (2010) Del Pozzo W., Raychaudhury S., Babul A., 2010, submitted to MNRAS
- De Propris et al. (2004) De Propris R., et al., MNRAS, 2004, 351, 125
- Dressler (1980) Dressler A., 1980, ApJS, 42, 565
- Dressler & Shectman (1988) Dressler A., Shectman S. A., 1988, AJ, 95, 985
- Ellingson et al. (2001) Ellingson E., Lin H., Yee H. K. C., Carlberg R. G., 2001, ApJ, 547, 609
- Feulner et al. (2005) Feulner G., Goranova Y., Drory N., Hopp U., Bender R., 2005, MNRAS, 358, L1
- Finoguenov, Briel, & Henry (2003) Finoguenov A., Briel U. G., Henry J. P., 2003, A&A, 410, 777
- Fontanelli (1984) Fontanelli P., 1984, A&A, 138, 85
- Goulding & Alexander (2009) Goulding A. D., Alexander D. M., 2009, MNRAS, 398, 1165
- Geller & Huchra (1989) Geller M. J., Huchra J. P., 1989, Sci, 246, 897
- Giovanelli & Haynes (1985) Giovanelli R., Haynes M. P., 1985, ApJ, 292, 404
- Gray et al. (2004) Gray M. E., Wolf C., Meisenheimer K., Taylor A., Dye S., Borch A., Kleinheinrich M., 2004, MNRAS, 347, L73
- Gregory & Thompson (1978) Gregory S. A., Thompson L. A., 1978, ApJ, 222, 784
- Haines et al. (2006) Haines C. P., Merluzzi P., Mercurio A., Gargiulo A., Krusanova N., Busarello G., La Barbera F., Capaccioli M., 2006, MNRAS, 371, 55
- Haines et al. (2007) Haines C. P., Gargiulo A., La Barbera F., Mercurio A., Merluzzi P., Busarello G., 2007, MNRAS, 381, 7
- Haines et al. (2008) Haines C. P., Gargiulo A., Merluzzi P., 2008, MNRAS, 385, 1201
- Haines et al. (2009) Haines C. P., et al., 2009, ApJ, 704, 126
- Hickox et al. (2009) Hickox R. C., et al., 2009, ApJ, 696, 891
- Iglesias-Páramo et al. (2003) Iglesias-Páramo J., Boselli A., Gavazzi G., Cortese L., Vílchez J. M., 2003, A&A, 397, 421
- Jenkins et al. (2007) Jenkins L. P., Hornschemeier A. E., Mobasher B., Alexander D. M., Bauer F. E., 2007, ApJ, 666, 846
- Kauffmann et al. (2004) Kauffmann G., White S. D. M., Heckman T. M., Ménard B., Brinchmann J., Charlot S., Tremonti C., Brinkmann J., 2004, MNRAS, 353, 713
- Kennicutt et al. (2009) Kennicutt R. C., et al., 2009, ApJ, 703, 1672
- Kim et al. (1989) Kim K.-T., Kronberg P. P., Giovannini G., Venturi T., 1989, Nature, 341, 720
- Knapp et al. (1989) Knapp G. R., Guhathakurta P., Kim D., Jura M. A., 1989, ApJS, 70, 329
- Larson, Tinsley & Caldwell (1980) Larson R. B., Tinsley B. M., Caldwell C. N., 1980, ApJ, 237, 692
- Lee et al. (2009) Lee J. C., Kennicutt R. C., José G. Funes S. J., Sakai S., Akiyama S., 2009, ApJ, 692, 1305
- Le Floc’h et al. (2005) Le Floc’h E., et al., 2005, ApJ, 632, 169
- Leitherer et al. (1999) Leitherer C., et al., 1999, ApJS, 123, 3
- Mac Low & Ferrara (1999) Mac Low M.-M., Ferrara A., 1999, ApJ, 513, 142
- Mahajan & Raychaudhury (2009) Mahajan S., Raychaudhury S., 2009, MNRAS, 400, 687
- Mahajan, Raychaudhury & Pimbblet (2010) Mahajan S., Raychaudhury S., Pimbblet K. A., 2010, in preparation
- Marcolini et al. (2006) Marcolini A., D’Ercole A., Brighenti F., Recchi S., 2006, MNRAS, 371, 643
- Margoniner & Carvalho (2000) Margoniner V. E., de Carvalho R. R., 2000, AJ, 119, 1562
- Martini et al. (2006) Martini P., Kelson D. D., Kim E., Mulchaey J. S., Athey A. A., 2006, ApJ, 644, 116
- Miller et al. (2003) Miller C. J., Nichol R. C., Gómez P. L., Hopkins A. M., Bernardi M., 2003, ApJ, 597,142
- Neumann et al. (2003) Neumann D. M., et al., 2003, A&A, 406, 789
- Piovan, Tantalo & Chiosi (2003) Piovan L., Tantalo R., Chiosi C., 2003, A&A, 408, 559
- Pisani (1993) Pisani A., 1993, MNRAS, 265, 706
- Poggianti et al. (2004) Poggianti B. M., Bridges T. J., Komiyama Y., Yagi M., Carter D., Mobasher B., Okamura S., Kashikawa N., 2004, ApJ, 601, 197
- Porter et al. (2007) Porter S. C., Raychaudhury S., 2007, MNRAS, 375, 1409
- Porter et al. (2008) Porter S. C., Raychaudhury S., Pimbblet K. A., Drinkwater M. J., 2008, MNRAS, 388, 1152
- Raychaudhury et al. (1997) Raychaudhury S., von Braun K., Bernstein G. M., Guhathakurta P., 1997, AJ, 113, 2046
- Rieke et al. (2004) Rieke G. H., et al., 2004, ApJS, 154, 25
- Rieke et al. (2009) Rieke G. H., Alonso-Herrero A., Weiner B. J., Pérez-González P. G., Blaylock M., Donley J. L., Marcillac D., 2009, ApJ, 692, 556
- Rines et al. (2003) Rines K., Geller M. J., Kurtz M. J., Diaferio A., 2003, AJ, 126, 2152
- Saintonge, Tran, & Holden (2008) Saintonge A., Tran K.-V. H., Holden B. P., 2008, ApJ, 685, L113
- Shen et al. (2007) Shen Y., Mulchaey J. S., Raychaudhury S., Rasmussen J., Ponman T. J., 2007, ApJ, 654, L115
- Shupe et al. (2008) Shupe D. L., et al., 2008, AJ, 135, 1050
- Silverman (1986) Silverman B. W., 1986, Density Estimation for Statistics and Data Analysis, Chapman and Hall, London
- Struck (2006) Struck C., 2006, asup.book, 115
- Smith et al. (2006) Smith R. J., Hudson M. J., Lucey J. R., Nelan J. E., Wegner G. A., 2006, MNRAS, 369, 1419
- Smith et al. (2008) Smith R. J., et al., 2008, MNRAS, 386, L96
- Sullivan & Johnson (1978) Sullivan W. T., III, Johnson P. E., 1978, ApJ, 225, 751
- Tanaka et al. (2004) Tanaka M., Goto T., Okamura S., Shimasaku K., Brinkmann J., 2004, AJ, 128, 2677
- West (1998) West M. J., 1998, ucb..proc, 36
- Wolf et al. (2009) Wolf C., et al., 2009, MNRAS, 393, 1302
- Yang et al. (2005) Yang X., Mo H. J., van den Bosch F. C., Weinmann S. M., Li C., Jing Y. P., 2005, MNRAS, 362, 711
- Zheng et al. (2007) Zheng X. Z., Bell E. F., Papovich C., Wolf C., Meisenheimer K., Rix H.-W., Rieke G. H., Somerville R., 2007, ApJ, 661, L41