A near-infrared study of AGB and red giant stars in the Leo I dSph galaxy
Abstract
A near-infrared imaging study of the evolved stellar populations in the dwarf spheroidal galaxy Leo I is presented. Based on observations obtained with the WFCAM wide-field array at the UKIRT telescope, we build a near-infrared photometric catalogue of red giant branch (RGB) and asymptotic giant branch (AGB) stars in Leo I over a square area. The colours of RGB stars, obtained by combining the new data with existing optical observations, allow us to derive a distribution of global metallicity [M/H] with average (uncorrected) or [M/H] after correction for the mean age of Leo I stars. This is consistent with the results from spectroscopy once stellar ages are taken into account. Using a near-infrared two-colour diagram, we discriminate between carbon- and oxygen-rich AGB stars and obtain a clean separation from Milky Way foreground stars. We reveal a concentration of C-type AGB stars relative to the red giant stars in the inner region of the galaxy, which implies a radial gradient in the intermediate-age (1–3 Gyr) stellar populations. The numbers and luminosities of the observed carbon- and oxygen-rich AGB stars are compared with those predicted by evolutionary models including the thermally-pulsing AGB phase, to provide new constraints to the models for low-metallicity stars. We find an excess in the predicted number of C stars fainter than the RGB tip, associated to a paucity of brighter ones. The number of O-rich AGB stars is roughly consistent with the models, yet their predicted luminosity function is extended to brighter luminosity. Although these discrepancies can be partly ascribed to significant uncertainties in the Leo I star-formation history and incompleteness of the spectroscopic samples of C stars fainter than the RGB tip, it appears more likely that the adopted evolutionary models overestimate the C star lifetime and underestimate their -band luminosity.
keywords:
Galaxies: individual: Leo I – Galaxies: stellar content – stars: AGB and post-AGB – stars: carbon – Local Group1 Introduction
The dwarf spheroidal galaxy Leo I was the first shown to be dominated by a relatively young stellar population (Lee et al., 1993). HST deep photometry confirmed the presence of a prominent intermediate-age stellar population and young stars (Gallart et al., 1999; Caputo et al., 1999). Quantitative analysis of the HST data established that most star formation activity (70%–80%) occurred between 7 and 1 Gyr ago, with some residual star formation until at least Myr ago. The detection of a blue horizontal branch (Held et al., 2000) provided the first evidence for an old stellar population, later confirmed by the discovery of RR Lyrae variable stars (Held et al., 2001).
The presence of an intermediate age population in Leo I was also revealed by an extended asymptotic giant branch (AGB). After the spectroscopic discovery of a carbon star in Leo I by Aaronson et al. (1983), follow-up photometry by Aaronson & Mould (1985) showed that the carbon stars (4 newly identified on the basis of their red near-infrared colours) belong to an extended AGB typical of an intermediate-age stellar population. The presence of a significant population of C stars (19 stars) in Leo I was confirmed by objective grating spectroscopy in the blue-green spectral region (Swan C2 bands) by Azzopardi et al. (1985, 1986). Using a 4-filter technique based on the filters and CN and TiO intermediate-band filters, Demers & Battinelli (2002) further surveyed Leo I for C stars, identifying 13 C-star candidates, 6 of which in common with Azzopardi et al. (1986). Menzies et al. (2002) obtained near-infrared (NIR) photometry to in a square field allowing a study of the AGB content of Leo I. They showed that most luminous AGB stars are carbon stars, several of which are variable, and detected the presence of 5 very red stars near the AGB tip, probably young ( Gyr old) dust-enshrouded stars, also candidates for Mira variability.
Several spectroscopic studies recently addressed the metallicity and chemical evolution of Leo I. Bosler et al. (2007) used the Ca ii triplet method to analyse Keck-LRIS spectra of 102 red giant branch (RGB) stars, and found . A mean metallicity [Fe/H] was measured by Koch et al. (2007) for 58 red giants. In both studies, the metallicity distribution is well described by a Gaussian function with a 1 width of 0.25 dex, and a full range in [Fe/H] of approximately 1 dex. In Gullieuszik et al. (2009) we obtained metallicities for 54 stars in Leo I from measurements of the Ca triplet line strengths, and found a mean metallicity and [M/H] on a scale tied to the [M/H] ranking of Galactic globular clusters (GGCs). A narrow and symmetric metallicity distribution, with a very low instrinsic metallicity dispersion, dex, appears consistent with a prompt initial enrichment and galactic winds expelling the metals products of stellar evolution. We also suggested the presence of a radial age gradient, with RGB stars in the inner part of Leo I being on average younger than those in the outer regions.
In this study, we further investigate the star-formation history of Leo I and the presence of stellar population gradients using deep NIR wide-field observations and analysing the AGB stars as tracers of intermediate-age stellar populations. Our NIR observations provide new constraints on the star-formation history of the galaxy, which are set by the number, type (carbon vs. oxygen-rich), and luminosities of AGB stars (see, e.g., Cioni, 2007; Groenewegen, 2007). Near-infrared photometry is ideal to this purpose because the cool AGB stars emit most of their flux at near-infrared wavelengths. The most evolved, dust-enshrouded AGB stars can be detected only at infrared wavelengths. In addition, the NIR photometry of red giant stars can be used to provide independent information on basic stellar properties.
Together with a companion paper on Leo II (Gullieuszik et al., 2008), this study is part of a survey of evolved stellar populations in dwarf galaxies in the Local Group and its vicinity, aimed at providing an observational database for the calibration of AGB stars models in a wide range of metallicities as a tool for a reliable interpretation of observations. For distant resolved systems (e.g., Virgo cluster galaxies observed with JWST or ELT) this will represent the main observational fact for modelling the galaxy’s star formation rate in the last few Gyr.
2 Observations and data reduction
| Filter | DIT(s) | Microsteps | |||
|---|---|---|---|---|---|
| 6 | 5.0 | 2 | 9 | ||
| 6 | 5.0 | 2 | 9 | ||
| 10 | 5.0 | 2 | 9 |
Observations of Leo I were carried out on April 19–20, 2005 using the NIR wide field camera WFCAM (Casali & et al., 2007) at the UKIRT at Mauna Kea, Hawai’i. WFCAM is equipped with 4 Rockwell Hawaii-II HgCdTe detectors with a scale of pixel-1. The size of each detector is pixels, corresponding to , with a space between the arrays of 94% of the detector size. Since the tidal radius of Leo I is (Irwin & Hatzidimitriou, 1995), one array (No. 2) was sufficient to study Leo I. The remaining detectors provide a useful estimate of the background/foreground field contamination.
The observing strategy and instrumental setup are the same as used for our study of Leo II (Gullieuszik et al., 2008). The observations, summarised in Table 1, consisted of 4 micro-stepped 10 s images (two 5 s coadds) on a 9-points jitter pattern, yielding a 360 s exposure time. In total, 6 observations were obtained in and and 10 in the band, yielding on-target integration times of 36 min in and and 60 min in . The “small” microstepping was used to obtain a better spatial sampling.
| ID | (J2000) | (J2000) | |||
|---|---|---|---|---|---|
| 14476 | 10:08:29.36 | +12:12:05.6 | 19.48 | 18.60 | 18.43 |
| 14447 | 10:08:03.90 | +12:12:06.8 | 19.64 | 18.93 | 18.93 |
| 200324 | 10:08:54.77 | +12:12:06.9 | 18.78 | 18.26 | 18.32 |
| 14467 | 10:08:41.75 | +12:12:07.3 | 20.78 | 19.95 | 20.05 |
| 22945 | 10:08:38.14 | +12:12:07.7 | 20.64 | 19.85 | 20.73 |
 |
 |
The raw data were calibrated using the WFCAM pipeline provided by the VISTA Data Flow System Project (Dye et al., 2006). The product of the pipeline are 4k4k oversampled combined images (“leavstacks”) with a spatial resolution pixel-1.
Our analysis was limited to the array centred on Leo I (No. 2) and a second array (No. 3) used as a control field to estimate the contamination by foreground Galactic stars and background galaxies. Object detection and point-spread function (PSF) photometry was performed on each “leavstack” image using daophot and allframe (Stetson, 1987, 1994). The PSF was generated with a “Penny” function with quadratic dependence on the position on the frame. The astrometric calibration was performed by the pipeline using the 2MASS Point Source Catalogue (Skrutskie et al., 2006, PSC) as a reference, with a final absolute systematic accuracy of the order . The positions of the sources in the final catalogue were converted from pixel units to the J2000 equatorial system using this astrometric calibration and an updated version of the IRAF111The Image Reduction and Analysis Facility (IRAF) software is provided by the National Optical Astronomy Observatories (NOAO), which is operated by the Association of Universities for Research in Astronomy (AURA), Inc., under contract to the National Science Foundation. package that included support for the ZPN projection adopted by the pipeline.
Our raw photometric catalogue was transformed to the 2MASS photometric system by applying the colour terms between WFCAM and 2MASS systems derived for the UKIDSS surveys (Dye et al., 2006), and zero points directly computed from the median of the magnitude differences between 2MASS and our WFCAM photometry in the colour range , for stars in common with the 2MASS/PSC. Only stars having 2MASS S/N ratio and photometric errors mag were used, which essentially limits the comparison to stars brighter than the RGB tip. The r.m.s. of the residuals is 0.04 mag in the band and 0.05 mag in the and bands. We verified that the zero points would not change significantly ( mag) using the colour terms from Hodgkin et al. (2009). We note that the colour terms were defined in the colour range . Outside this interval (e.g., for very red stars), our measurements should be considered on a (linearly transformed) WFCAM system rather than on the 2MASS system. The final, calibrated NIR photometric catalogue, which includes star-like objects detected in at least 2 images in 2 bands, is published in the electronic issue of the journal. A few lines are presented in Table 2 to illustrate its content.
For the completeness and photometric errors we assumed the results of artificial stars experiments used for Leo II (Gullieuszik et al., 2008), since the observing strategy, exposure times, and sky conditions were identical for the two galaxies, and the crowding is very similar and low in the NIR. The completeness factor is % for stars brighter than . All results of our analysis are based on photometry of stars brighter than , for which we have completeness factor and internal photometric errors mag.
3 Colour-Magnitude diagrams


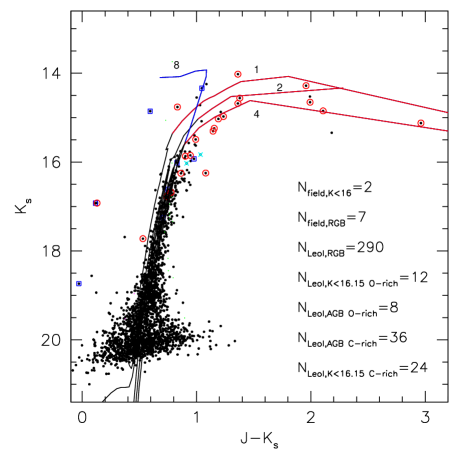
Figure 1 presents our (), colour-magnitude diagram (CMD) of the Leo I field, along with a diagram combining NIR data and optical photometry obtained with the EMMI camera at the ESO/La Silla NTT telescope (Held et al., 2000). Our photometric catalogue was cleaned using the sharp parameter calculated by allframe to remove noise peaks, diffuse objects, and other spurious detections. A magnitude-dependent sharp cutoff was adopted, as in Gullieuszik et al. (2007b, their figure 2).
Our dataset provides a nearly complete sample of upper-AGB stars belonging to the intermediate-age stellar populations of Leo I, with a red tail of C stars which extends to , in agreement with Menzies et al. (2002). In addition, the NIR CMD of Leo I samples the RGB from the tip (clearly visible at ) down to . The RGB is comprised between the Girardi et al. (2002) theoretical isochrones for an age 6 Gyr and metallicities and .
The cool AGB C-stars (mostly variable) are the brightest objects in Leo I in the band. At optical wavelengths, their luminosity dramatically decreases and the reddest among them are generally undetected in the band. The completeness of the optical catalogues is also complicated by the large amplitude of luminosity variations in the optical domain. Still, many upper-AGB stars are present in the optical catalogues, although some are very faint (see Fig. 1). As a result, archival optical catalogues may be used to retrieve AGB stars detected in the NIR (or mid-infrared) and characterise their SEDs. We cross-identified the stars in our NIR catalogue with the carbon star surveys of Azzopardi et al. (1986) and Demers & Battinelli (2002) and with the list of very red objects in Menzies et al. (2002), using positional coincidence within a radius. Star C10 was incorrectly identified by Demers & Battinelli (2002) with star no. 7 in the Azzopardi et al. (1986) catalogue. Since the distance between D02-C10 and ALW-7 is , and both stars are located within from two distinct sources in our catalogue (with colours and magnitudes typical of C stars), we conclude that they are distinct stars. All of the very red stars detected by Menzies et al. (2002) within our field-of-view (namely, stars A, B, C, and D) are also present in our NIR CMD (Fig. 1). Among them, only star D is visible in the optical bands. As an example, Fig. 2 shows two of the reddest stars. They are very bright in the band, yet fall below the detection threshold in the image.
Different techniques adopted for searching C stars lead to samples with different biases (see Battinelli & Demers, 2009). The reddest stars are too faint in the optical spectral range to be detected with objective grating techniques, while the 4-filter technique misses the bluest stars (Demers & Battinelli, 2002). Azzopardi et al. (1986), using an objective grating operating in the Å range, did not detect the brightest, reddest C stars (as noticed by Menzies et al., 2002), while Demers & Battinelli (2002) could not retrieve the bluest, i.e. warmest, spectroscopically identified C stars.
In Sect. 6 we will present a method for selecting C- and O-rich AGB stars based on two-colour NIR diagrams. Our selection will include all previously known C-stars and, in addition, will allows us to separate the foreground Milky Way stellar population.
4 Distance
The luminosity of the RGB tip (TRGB) in the band has long been used as a valuable distance indicator (Da Costa & Armandroff, 1990; Lee et al., 1993). The dependence of the TRGB luminosity on age and metallicity is minimised in the -band (e.g., Salaris & Girardi, 2005). In the NIR, the luminosity of the tip depends on age and metallicity in a more complex way. For instance, the -band magnitude of intermediate-age stars at the TRGB is fainter than that of old stars; while the TRGB luminosity rises with increasing metallicity (e.g., Salaris & Girardi, 2005). For a population that becomes more metal-rich with time as a result of galaxy chemical evolution, the two effects may partly balance. As discussed in Gullieuszik et al. (2007a, 2008), distance estimates consistent with those obtained from optical methods can be derived from NIR photometry, provided that the star-formation history (SFH) of the galaxy is at least approximately known. Testing our ability to measure distances from NIR data is important in view of the future generation of ground based and space telescopes that will operate mainly or exclusively at infrared wavelengths (JWST, adaptive optics at the ELT).
In a complex stellar population, the RGB is generally wide and the cutoff does not have a constant luminosity (see, e.g., the discussion of Fornax dSph by Whitelock et al., 2009). However, the TRGB can still be operationally defined to represent the mix population, and compared with synthetic CMDs that reflect the SFH of the system. The method is employed here to measure the distance to Leo I. An objective estimate of the magnitude of the TRGB was obtained by fitting the -band luminosity function with a step function convolved with a Gaussian kernel representative of the photometric errors. This method, extensively applied by our group (e.g., Momany et al., 2002), has given in the band results consistent within with the Maximum Likelihood Algorithm of Makarov et al. (2006) (see Rizzi et al., 2007).
The magnitudes of the TRGB measured in the bands are listed in Table 3. The errors associated to these magnitudes are essentially the uncertainty on the absolute photometric calibration, since the uncertainties due to the fitting algorithm are less than 0.01 mag and the internal photometric errors at the level of the TRGB are negligible (see Sect. 2). To derive the distance to Leo I, the TRGB magnitudes were compared with the empirical calibrations of as a function of [M/H] from Valenti et al. (2004b). This calibration, whose intrinsic systematic error is mag, is based on Galactic globular clusters, i.e. old stellar populations. Applying it to the complex stellar populations of Leo I requires a “population correction” based on synthetic CMDs to take into account its star formation history. The distance to Leo I was then computed as
| (1) |
where is the observed TRGB magnitude, is the extinction, is the absolute TRGB magnitude as derived from Valenti et al. (2004b) calibration, and is the population correction needed to account for the effects of the different SFH of Leo I and the GGCs.
| band | |||||
|---|---|---|---|---|---|
| 17.00 | 22.09 | 0.18 | |||
| 16.30 | 22.01 | 0.19 | |||
| 16.14 | 22.01 | 0.20 |
The population correction was calculated using a simulated CMD of Leo I with constant metallicity to build the luminosity function (LF) and measure the theoretical TRGB magnitude, (see Gullieuszik et al. 2007a for details). Our measurements were then repeated by selecting only stars older than 10 Gyr (). The population correction was then . The values are listed in Table 3. The population effect is positive for all bands, i.e. the RGB tip for the overall stellar population is slightly fainter than that of an old population.
Our distance estimates for Leo I, computed from Eq. (1) with a reddening , are given in Table 3. The weighted mean of the distances derived from the bands is 22.04 mag (corresponding to 256 kpc) with a standard deviation of 0.11 mag. The errors were calculated by error propagation from the photometric calibration uncertainty (see Sect. 2) and the intrinsic systematic error on the Valenti et al. (2004b) calibration (0.16 mag). This estimate agrees with the results of optical studies. Held et al. (2001) found from the magnitude of Leo I RR-Lyrae stars; Bellazzini et al. (2004) measured from the magnitude of the TRGB. Using the same method, Méndez et al. (2002) found . Our result therefore confirms the possibility of reliably estimating the distance to resolved stellar systems with complex stellar populations using NIR photometry alone.
5 Metallicity
5.1 Metallicity distribution


The metallicity distribution function (MDF) of RGB stars is an important constraint for models of chemical evolution of dwarf galaxies. We derived a photometric MDF for RGB stars in Leo I by comparing their with the colour of GGCs of known metallicity, following a technique developed for optical colours by Saviane et al. (2000). Stars on the upper RGB were interpolated in the (), diagram across analytical fits to the RGB fiducial lines of template Galactic globular clusters. We assumed for Leo I a distance of and a reddening . In our implementation of the method, we employed [M/H] values for a set of GGCs spanning a wide range in metallicity, from Valenti et al. (2004a). The complete list of GGCs with metallicities is given by Gullieuszik et al. (2007a). The global metallicity [M/H], which measures the abundance of all heavy elements, is the most appropriate to estimate the metallicities of dwarf spheroidal galaxies (having [/Fe] ratios close to solar) by comparison with the photometric properties of Milky Way globular clusters, which generally show an overabundance of -elements relative to iron that is a function of the cluster metallicity (see Geisler et al., 2007, and refs. therein).
The resulting photometric MDF of Leo I, obtained for red giant stars down to mag below the TRGB ( ), is presented in Fig. 3 (upper panel). With our choice, the MDF shows negligible contamination by stars on the blue side of the RGB, which probably include both younger stars in Leo I and Galactic foreground. The distribution has an average [M/H] and is quite well described by a Gaussian centred at [M/H] with a measured dispersion dex. The standard deviation of the mean, 0.05 dex, is adopted as internal error of the mean metallicity.
Since the stellar populations in Leo I are on average younger that the Galactic globular clusters, we computed a correction to the mean metallicity of Leo I by adopting the simplified approach that all RGB stars have an age of 5 Gyr (e.g., Gallart et al., 1999). Given two RGB stars with the same metallicity, the younger has bluer colours. By interpolating over the Girardi et al. (2002) isochrone set, we found that at a star of 5 Gyr is more metal rich by 0.27 dex than a 12.5 Gyr old star having [M/H] and the same colour. By applying this correction, the mean metallicity of Leo I from NIR photometry is then [M/H] (random) (systematic). The systematic error was estimated from the uncertainty on the photometric zero point of our calibration, which is 0.07 mag on the colour (the quadratic sum of the and zero-point uncertainties). Shifting the Leo I RGB by mag in colour results in a dex variation in metallicity.
The mean metallicity of red giant stars in Leo I in our spectroscopic analysis is [M/H] (Gullieuszik et al., 2009). Previous work by Bosler et al. (2007) and Koch et al. (2007) led to mean metallicities [Fe/H] and [Fe/H] , respectively. Our photometric age-corrected metallicity therefore agrees with all recent spectroscopic measures.
5.2 Comparison with spectroscopy
The metallicities of individual RGB stars in Leo I, derived from NIR photometry, can be directly compared with the results of spectroscopic measurements. In Fig. 4, the metallicity distribution of Leo I RGB stars inferred from colours is compared with the spectroscopic metallicity distribution from Gullieuszik et al. (2009) (we refer the reader to that paper for a full account of previous spectroscopic work). The photometric MDF was approximately corrected for age population effects, assuming a common age of 5 Gyr for Leo I stars. The [M/H] distributions are similar, both in the mean values and the range. The primary difference is in the low-metallicity tail of the photometric MDF. This can be partially explained by a fraction of contaminating AGB stars, although the main reason is probably the presence of young stars with colour bluer than the RGB, which are incorrectly treated as metal-poor stars.


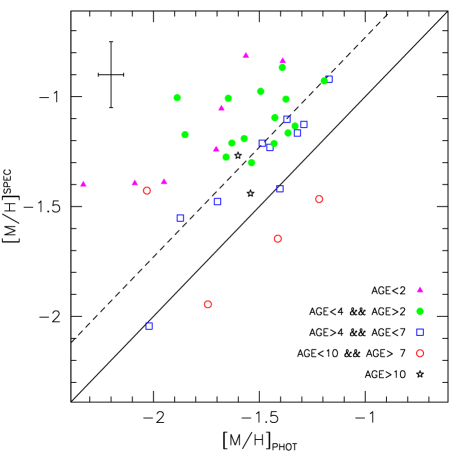
The significant overlap between our sample of RGB stars and the dataset of Gullieuszik et al. (2009) (39 stars in common) also allows a direct comparison of photometric and spectroscopic metallicity estimates on a star-by-star basis. Individual photometric and spectroscopic measures are plotted in Fig. 5, where stars in different age intervals (as estimated by Gullieuszik et al., 2009), are marked with different symbols. In this plot, the metallicities derived from photometry have not been corrected for the age difference. Were all Leo I stars as old as the GGCs, we would expect the spectroscopic and photometric metallicities to be equal within the errors, and cluster about the bisector in Fig. 5. This is clearly not the case, as most stars are on the left of the unity relation, i.e. their metallicities are underestimated by the colours. This is consistent with the mean age of the bulk of the Leo I stellar populations. We have plotted an age-corrected relation (dashed line in Fig. 5), by calculating the metallicity correction to be applied to our photometric measures for young stellar populations ([M/H] dex, as above). Indeed, many stars are close to this line, with the youngest stars located even more to the left, as expected. The observed shift in of young stars is consistent with our age determination based on optical colours. The metallicities derived using the colours agree with the spectroscopic estimates, once stars’ ages are accounted for. Alternatively, the colours could be used to estimate the ages of stars once their metallicities are known from spectroscopy.
6 AGB stars
We now turn our attention to the AGB star content of Leo I. Our WFCAM catalogue provides the database for a study of the intermediate-age AGB stars in Leo I with unprecedented photometric accuracy and spatial coverage. From this database, we now select new samples of C-rich and O-rich AGB stars and discuss their properties.
6.1 Two-colour diagrams

The two-colour diagram is an efficient tool to separate dwarf and giant stars (Aaronson & Mould, 1985; Bessell & Brett, 1988). As such, it is particularly useful when studying extragalactic systems for separating the stellar populations of the system from the Galactic foreground.
Figure 6 shows the NIR two-colour diagrams of stars brighter than in the field of Leo I and in a comparison field beyond the “tidal radius” of the galaxy. The magnitude cutoff was chosen to include only stars brighter than the RGB tip, leaving out first-ascent red giant stars. Following the approach of our Leo II study (Gullieuszik et al., 2008), we defined 4 regions in the two-colour diagram aimed at discriminating C stars from O-rich AGB stars in Leo I, both against the Galactic foreground. The star counts in the different regions are given in Fig. 6.
Regions 2 and 3 contain the loci of giant and main-sequence Galactic stars from Bessell & Brett (1988). The star counts are equal in Leo I and the control field within the statistical fluctuations, indicating a population of foreground Milky Way stars. Regions 1 and 4 are populated only in the case of the Leo I field, which proves that stars in those regions belong to the dSph galaxy. The stars in region 1, which are close to the Bessell & Brett (1988) line for giant stars, are identified with O-rich AGB stars in Leo I. The photometry of candidate O-rich AGB stars in region 1 is given in Table 4. Region 4 contains stars which become increasingly reddened in both and colours. In dSph galaxies this region is most likely populated by C stars (Gullieuszik et al., 2008; Menzies et al., 2008; Whitelock et al., 2009), although in the Milky Way and the Magellanic Clouds it may be populated by other objects, such as M-type (O-rich) Mira variable stars and OH/IR stars (Bessell & Brett, 1988; Nikolaev & Weinberg, 2000; Menzies et al., 2002). Mid-infrared spectroscopy with Spitzer Space Telescope of AGB stars in Local Group galaxies has shown that at low metallicity the dusty winds and mass-loss rates of C stars are similar to those of Galactic AGB stars, while mass loss is 1-2 orders of magnitude lower in O-rich AGB stars (see Lagadec & Zijlstra, 2008, for a discussion). For example, this is the case for Fornax dSph, which has a metallicity similar to that of Leo I (Matsuura et al., 2007; Lagadec et al., 2008). All previously identified C stars in Leo I are indeed found in region 4. NIR photometry for the candidate C stars selected from our two-colour diagram is given in Table 5, along with their cross-identification with previous surveys (unfortunately, no matching was possible with Aaronson & Mould 1985 because finding charts or coordinates are not provided). Most of them are previously identified C stars, while 6 are new candidates. Note that star No. 11242 (ALW-17), which is marginally included in region 4, is not a C star according to Azzopardi et al. (1986). A few very red stars in region 4 were not identified in optical bands. For all stars with missing optical photometry, visual checks on our EMMI images ruled out possible mismatches and confirmed that the optical counterparts fall below the detection threshold. A special case is star No. 8336 (also M02-D), which is very bright in the optical () compared to other stars in Table 5 and has a blue optical colour , inconsistent with that of C stars. Inspection of both optical and NIR images confirmed its star-like shape. This object is likely to represent a chance superposition or photometric blend (see Gullieuszik et al., 2007b, for a similar case in SagDIG).
Figure 7 shows the location of Leo I stars selected using the two-colour diagram in the CMD. The O-rich AGB star candidates from Table 4 are distributed on a nearly vertical sequence above the TRGB, overlapping in magnitude and colour with the faintest C stars. Note that most of the AGB stars within 1 mag above the TRGB are O-rich stars. The stars in Table 5 closely follow the mean locus of C stars in LG galaxies (Totten et al., 2000) up to . Those with redder colours show a large scatter consistent with the known variability of upper-AGB carbon stars and the onset of circumstellar dust envelopes (Menzies et al., 2002; Whitelock & Feast, 2000).

We note incidentally that the same two-colour technique can be used for discriminating RGB stars in Leo I from the Milky Way foreground. This is shown in Fig. 8, where we plot the NIR two-colour diagram of stars in the magnitude interval , which corresponds to the upper 1.3 mag of the RGB of Leo I. The diagram is plotted for both the Leo I field and the control field, and is slightly more scattered than the data in Fig. 6 because of the increased photometric error. The stars populating region 3 are mostly Galactic dwarfs. This is confirmed by a , plot of stars in the field of Leo I, where the wide baseline of the combined optical–NIR colour allows a neat separation of the foreground stars.
The great majority of stars in regions 1 and 2 are red giants in Leo I. The near absence of stars in region 1 for the comparison field is easily explained by the fact that giant stars in the Milky Way are much brighter than the magnitude range of the RGB of Leo I. While the stars in region 1 are mostly in Leo I, the region 2 sample can be slightly contaminated by distant Galactic dwarf stars (but in the case of Leo I the contamination is negligible). The two samples of RGB stars should probably be grouped together to avoid a bias in colour and metallicity. In conclusion, a selection based on broad-band imaging alone proves to be a valuable tool for selecting red giants stars. The increasing availability of wide-field NIR imagers makes this technique an interesting complement to intermediate-band optical searches (e.g., Majewski et al., 2000) to define clean samples of member stars in resolved systems for follow-up spectroscopic studies.

6.2 Radial gradient in the AGB population

Leo I is one of the few dSph for which no evidence of a population gradient was known from the literature. Recently, our spectroscopic study of Leo I (Gullieuszik et al., 2009) gave a marginal detection of a radial metallicity gradient among Leo I RGB stars, in contrast with the conclusions of Koch et al. (2007). We also found evidence for a concentration of younger stars in the central region of Leo I. Then it is important to confirm the presence of stellar population gradients using AGB stars as tracers of intermediate-age stellar populations. Radial distances were therefore calculated for AGB and RGB stars assuming that the centre of Leo I is located at , (J2000) and the stellar density distribution is approximately elliptical with ellipticity and position angle P.A.= (Sohn et al., 2007). The radial distribution of AGB stars, normalised to the number of stars in the upper 2 mag of the RGB, is plotted in Fig. 9 (lower panel). C- and O-rich AGB stars were counted in elliptical annuli with a 04 step in semi-major axis. The errors on the relative number of AGB stars were calculated assuming Poisson statistic for the star counts. A central concentration of AGB stars relative to RGB stars is apparent in the plot, with a decline of a factor of at with respect to the centre. The statistical significance of this result is larger when we consider C stars only (Fig. 9, upper panel). A Kolmogorov-Smirnov (KS) test used to compare the cumulative distributions of AGB stars (C- and O-rich) to that of RGB stars gave the following results. The null hypothesis that AGB and RGB stars are drawn from the same parent population can be rejected with a 95% confidence; the probability rises to 97% if we consider only C stars. For the O-rich AGB stars, the null hypothesis cannot be rejected at any significant level. These tests imply that the C-type AGB stars show a statistically significant central concentration, whereas the spatial distribution of O-rich AGB stars is similar to that of the bulk population of red giant stars.
The central excess of C stars is also evident in Fig. 10, where we compare AGB stars in an inner region of Leo I and in an elliptical ring with . While the fraction of O-rich AGB stars relative to the number of RGB stars is constant in the two regions, the fraction of C-stars is 3 times higher in the central region. Again, we conclude that the difference in the radial distribution of AGB and RGB stars is driven by an excess of C stars, which trace the intermediate-age stellar population in the age range 1–5 Gyr. This confirms the presence of an age gradient in Leo I as suggested by spectroscopy of RGB stars (Gullieuszik et al., 2009). Indeed, the number of C-stars is much more dependent on age and SFH than the number of O-rich AGB and RGB stars, as illustrated in Fig. 11 and discussed in more detail in the next section. Also, the mean age of red clump stars in Leo I is Gyr, definitely older than that of luminous AGB stars, which explains why no age gradient was detected by Held et al. (2000).
7 Comparison with theoretical models
The present observations sample quite completely the AGB population of Leo I in the surveyed area, except perhaps for the stars most absorbed by circumstellar dust. As discussed by Gullieuszik et al. (2008) for Leo II, this kind of data is important for testing thermally-pulsing AGB (TP-AGB) models in the regime of low metallicity. In the case of Leo I, the presence of recent star formation makes it a particularly interesting case for a study of AGB stars of different ages and masses.
Since the HST observations used in the determination of the SFH of Leo I were obtained in a central region, and given the presence of a significant gradient in the stellar populations of Leo I, we performed our analysis on the inner (projected) 2.5 arcmin of the galaxy. Inside this area, the ratio is almost constant and comprised between 0.10 and 0.12. Selecting this small region also dramatically reduces the number of foreground stars, whereas the number of Leo I stars is reduced by just a factor of 2 relative to the total observed area (see Fig. 10).
7.1 Simulating the photometry
The Leo I star counts can be compared with the recent set of TP-AGB evolutionary tracks from Marigo & Girardi (2007). The procedure followed to simulate the Leo I observations is essentially the same as in Gullieuszik et al. (2008), to which the reader is referred for details. Suffice it to mention that the latest version of the trilegal222http://stev.oapd.inaf.it/trilegal population synthesis code (Girardi et al., 2005; Girardi & Marigo, 2007) was used to simulate both the Milky Way foreground and the Leo I dSph. For this simulation, we assumed for Leo I a distance of 250 Kpc and zero reddening in the near-infrared. The simulations of the TP-AGB include important effects such as luminosity and temperature variations during thermal pulse cycles, and the processing of radiation by circumstellar dust according to the Groenewegen (2006) prescriptions (details are given in Marigo et al., 2008).

The total mass of simulated Leo I stars inside the area of our observations was chosen so as to reproduce the star counts in the upper 2 magnitudes of the RGB, for which our observations are complete. The relative star-formation rate of Leo I was taken from two different sources, as depicted in the upper panel of Fig. 11: Gallart et al. (1999, their figure 9) and Dolphin et al. (2005). In both cases the SFH was derived by inversion of a deep CMD from HST observations. Both determinations indicate that the star-formation rate of Leo I increased in the last few Gyr. This feature appears as a broad peak in the SFH between and 7 Gyr in the case of Gallart et al. (1999), and as a much more confined peak, close to 2.5 Gyr, in the case of Dolphin et al. (2005). For the Leo I metallicity, we adopted a Gaussian distribution with mean [M/H] and dispersion 0.2 dex. This metallicity distribution was assumed to be the same for all ages. This is a fair approximation since the bulk of the AGB stars arise from an age interval where spectroscopy suggests modest chemical evolution (Gullieuszik et al., 2009).
To reduce the statistic fluctuations in the numbers of predicted stars, each simulation was run 100 times with different random seeds. One example of such simulations is shown in Fig. 12, which reproduces quite well the observed diagram shown in Fig. 1. The main stellar features are accounted for by the model, including the colour distribution of C stars which, with the new prescriptions for circumstellar dust extinction, turns out to be consistent with the extended AGB red tail in the data. The simulations do not contain the objects found in the bottom-right part of the diagram (, ), which likely correspond to background galaxies (see, e.g., Nikolaev & Weinberg, 2000).
7.2 Comparing foreground and RGB counts
According to the model counts, the expected number of foreground Milky Way stars in our deg2 area (i.e. the area of an ellipse with semi-major axis and ellipticity ), in the magnitude interval, is ; this agrees with the 3 objects observed in regions 2+3 at and . In view of this agreement, our simulations can be used to infer the field contamination in other CMD regions. We find that a total of foreground stars are expected to contaminate the uppermost 2 mag of the RGB in Leo I, in the interval. The observed number of stars in this CMD region is 276 (Fig. 10), which largely outnumbers the expected foreground stars. We thus conclude that about 270 genuine RGB stars in Leo I are expected within 2 mag of the tip. The Leo I simulations are then scaled so as to obtain a total of RGB stars in the upper 2 magnitudes of the RGB.
7.3 Comparing AGB counts
Using 100 simulations for each SFH, we obtained the following results for AGB star counts in Leo I. For the Dolphin et al. (2005) SFH, we expect to find O-rich giants above the RGB tip. Among them, are genuine TP-AGB stars, the remaining being either early-AGB or core helium burning stars of the youngest ages. The predicted C-rich AGB stars are in total, brighter than the TRGB in the band. In the inner , the data present O-rich and C-rich stars in regions 1 and 4 of Fig. 6. While the number of O-giants in the simulations agrees with the observed one, the excess of C-rich giants is significant, by a factor of about 2. Alternatively, using the Gallart et al. (1999) SFH, we predict O-rich giants above the RGB tip ( genuine O-rich TP-AGB), and carbon stars ( above the TRGB). These numbers indicate a small deficit of O-rich stars (not significant, however), and again an excess in the predicted number of C stars by a factor of .

The mean C-star luminosity function is compared to the data in Fig. 13 (bottom panel). As suggested by a comparison between the data in Fig. 1 and the simulations in Fig. 12, the simulated C stars are fainter on the mean than the observed stars. A KS test indicates a negligible probability that the observed distribution is drawn from the model distribution. In particular, we note that the predicted number of C stars fainter than the RGB tip, which is significant in our models, contrasts with the paucity of faint C stars in the spectroscopic surveys (although the completeness of the observational searches of C stars for objects fainter than the RGB tip is not well understood).
A similar comparison for O-rich AGB stars above the RGB tip (Fig. 13, top panel) shows that the models predict a distribution extended to brighter magnitudes than observed, with a KS probability that the observed distribution is drawn from the theoretical model of just 1.5%. Although the number of O-rich AGB stars seems to be correctly predicted, the stars are brighter than observed by mag.
Thus, as in the case of Leo II, there are significant discrepancies between the LFs predicted by current low-metallicity TP-AGB models and the observed data. However, the trends are quite different in the two cases. In Leo II the lifetimes of O-rich AGB stars are overestimated, while the C stars are reproduced in seemingly acceptable numbers (Gullieuszik et al., 2008). For Leo I, the situation regarding O-rich and C-rich AGB star counts is the opposite. The difference is likely related to the different mean ages of AGB stars in these two galaxies, since the Leo II stellar populations are significantly older on average than those in Leo I. The few observed C stars in Leo II sample the lower limit of the mass interval for which C stars can be formed by thermal pulses, with masses close to 1.0 and ages between and 7 Gyr. Conversely, the numerous C stars in Leo I sample the interval for ages younger than 3 Gyr (). The differences found for C stars are therefore not surprising.
7.4 Comparison with the SMC
The current models of TP-AGB stars were calibrated using constraints from the Large and Small Magellanic Clouds, in particular their global C-star luminosity functions, and AGB lifetimes derived from their star clusters (Marigo & Girardi, 2007). Therefore, the behaviour of these models reflects constraints set by stellar populations with metallicity between [Fe/H] and . Leo I has a mean metallicity dex, which is 0.5 dex lower than that of the young SMC populations, and comparable to that of intermediate-age and old populations in the SMC. Thus, it is not clear why models calibrated on the SMC observations predict the numbers and luminosities of the Leo I AGB stars so poorly. Is the moderate difference in metallicity the main reason of the observed discrepancies ?
To clarify these questions, we made two tests. First, we tested the effects of changing the metallicity on the LF. Simulations were produced with metallicity varying from [M/H] to . The resulting LFs were nearly the same as those obtained for [M/H] , indicating that the problem cannot reside in the metallicities. Second, we compared the properties of AGB stars in Leo I and the SMC. New SMC simulations were performed using the SFH of Harris & Zaritsky (2004) together with the age-metallicity relation of Pagel & Tautvaišienė (1998). We used the trilegal code in its current version, yielding more detailed simulations than the original code presented in Marigo & Girardi (2007). The new simulations, which have the same features (e.g., detailed modelling of the photometry) and the same physics as used for Leo I, essentially confirm the results of Marigo & Girardi (2007) concerning the shape of the C-star LF and the good overall fit to the SMC data. This SMC model is shown in Fig. 13 (dashed histogram), shifted to the distance and reddening of Leo I dSph. The C stars in the SMC are apparently much brighter on the mean than those in Leo I (continuous histogram, using the Gallart et al. SFH). The dotted histogram shows the same model for the SMC, but excluding the stars with ages younger than 1.5 Gyr. It is then clear that the bulk of the bright C stars in the SMC comes from the strong star formation episode experienced in the recent past (see Harris & Zaritsky, 2004).

The C-star LF is clearly a sensitive function of the SFH of the system. This is confirmed by Fig. 14, where we present a colour-coded plot of the number of AGB stars in and age bins in the case of a constant star-formation rate and fixed metallicity equal to that of Leo I. In Fig. 14, most of the TP-AGB stars younger than Gyr become C stars soon after they enter the TP-AGB phase, except for some TP-AGB stars in the 2–5 range which also appear as O-rich because either are evolving through the first part of their TP-AGB phase before being converted to C stars, or (those younger than 0.5 Gyr) are massive enough to experience hot-bottom burning, thus keeping their surface C/O ratio (e.g., Marigo, 2007). As seen in the middle panel of Fig. 14, a sustained star formation activity in the last 1–2 Gyr does imply a high production rate of C stars. Since a recent episode of star formation ( Gyr) is absent in Leo I dSph, very luminous C stars are missing in the simulations.
While the C stars in the SMC mostly sample the properties of young C stars of metallicity close to , with initial masses higher than , the AGB stars in Leo I mainly arise from intermediate-age stars with metallicity and initial masses close to 1.5 .
7.5 Models vs. observations
Then, for the bright end of the C-star LF, it is conceivable that the star-formation histories used to calculate the model LF are biased towards stellar populations which are on average too old. However, it appears likely that the models actually overestimate the lifetime of low- and intermediate-mass C-type stars, and/or underestimate their luminosities. There are different ways by which the lifetimes/luminosities may be changed: by increasing the mass-loss rates for C stars, by decreasing the efficiency of dredge-up events (so as to more rapidly increase the core mass and luminosity), or by efficient dimming of their near-infrared light by circumstellar dust shells. Another aspect that might be potentially relevant to this issue is the fact that at the low metallicities considered here the TP-AGB models attain a surface C/O already during the first few sub-luminous thermal pulses, before reaching the core-mass luminosity relation characteristic of the fully-developed TP-AGB regime (Wagenhuber & Groenewegen, 1998). Though the effect of a very efficient third dredge-up on the stellar luminosity during these earlier stages is still not well assessed, we find in the literature some theoretical indication that TP-AGB stars might be brighter than commonly assumed by synthetic models (see, e.g., Herwig et al., 1998; Mowlavi, 1999). While exploring the possible solutions requires the calculation of new grids of TP-AGB evolutionary models, which is beyond the scope of this paper, the present results (along with those of Gullieuszik et al., 2008) demonstrate that, despite the possible uncertainties in SFHs and age-metallicity relations in nearby dwarf galaxies, the observed properties of AGB stars in dSph galaxies provide valid constraints to AGB models at low metallicities.
8 Summary and conclusions
We have presented new infrared photometry of Leo I dSph obtained with the wide-field imager WFCAM at the UKIRT. Our NIR photometry, combined with optical and band photometry, provides information on the spectral energy distribution of AGB and RGB stars in Leo I on a wide colour baseline.
We provide a catalogue of PSF-fitting photometry of evolved stars in Leo I down to , over a area, from which the basic parameters of Leo I, distance and metallicity, were re-derived. We measured the distance to Leo I from the , and magnitude of the TRGB, using a calibration based on Galactic globular clusters (Valenti et al., 2004b). Taking into account the SFH of Leo I by mean of synthetic CMDs, we corrected our measurements for the age difference between Leo I and the template GCs. This yielded a corrected distance modulus , in agreement with previous optical results. The colours of RGB stars were used to infer a metallicity distribution. We obtained a mean age-corrected metallicity [M/H] , consistent with recent results from spectroscopic analysis of Leo I RGB stars (Bosler et al., 2007; Koch et al., 2007; Gullieuszik et al., 2009). A star-by-star comparison of metallicities derived from spectroscopy and colours gave residuals generally consistent with the ages of the stars estimated from optical colours (Gullieuszik et al., 2009). Therefore, we argued that NIR photometry allows an accurate determination of the main parameters (distance, metallicity) of resolved galaxies provided that a guess of their SFH can be made. This conclusion is important for deriving distances and metallicities for resolved galaxies out to the Virgo cluster of galaxies with the future generation of NIR instruments (JWST and adaptive optics at Extremely Large Telescopes).
Using our NIR photometry, we obtained a nearly complete (with the possible exception of heavily obscured stars), homogeneous sample of AGB star in Leo I, confirming the presence of some very red objects not detected in optical images, probably luminous thermally-pulsing AGB stars reddened by dust envelopes (4 out of 5 in common with Menzies et al., 2002). We showed that, if the photometric data are of high precision and accuracy, the NIR two-colour diagram is able to discriminate between O-rich and C-rich AGB stars brighter than the RGB tip, and against the foreground Galactic dwarf stars. Our selection criteria for C stars brighter than the TRGB are entirely based on NIR photometry, hence not affected by the various biases typical of optical methods. The same method can be employed to select a clean sample of red giant stars by significantly reducing the contamination by Galactic dwarf stars. As a result, we found 37 C-stars in Leo I, 6 of which are new candidates. We were able to define, for the first time, a sample of 39 bona-fide O-rich AGB stars against the contaminating Milky Way foreground, on the basis of their NIR colours. Our selection was tested (and confirmed) on a control field. From these samples, we derived the luminosity functions of O-type and C-type AGB stars in Leo I.
The AGB stars in our Leo I sample were used as tracers of their parent intermediate-age stellar populations. We revealed a radial gradient in the number of C-type AGB stars relative to RGB stars, which implies an increasing fraction of intermediate-age (1–3 Gyr) stars in the inner regions of the galaxy. The fraction of C stars within an ellipse with semi-major axis (186 pc), having ellipticity and position angle appropriate for Leo I, is larger by a factor of 3 than in the outer field. This confirms the presence of an age gradient in the stellar populations of Leo I, as suggested by our spectroscopic study (Gullieuszik et al., 2009). In contrast, the O-rich AGB stars follow the profile of RGB stars.
The NIR photometry of AGB stars in Leo I was compared with the prediction of theoretical models. As in the case of Leo II, we found significant discrepancies between the present TP-AGB models with low metallicity and the observed data, with the simulated LFs for C- and O-rich AGB stars not reproducing the observations. In particular, the predicted number of C stars fainter than the RGB tip is larger in our models than found by spectroscopic surveys. These discrepancies can be explained by uncertainties in the star formation histories used to calculate the model LFs or, more likely, by an overestimate of the lifetime of low- and intermediate-mass C-type stars, and/or an underestimate of their luminosities, in the current models.
| ID | (J2000) | (J2000) | |||||||||
|---|---|---|---|---|---|---|---|---|---|---|---|
| 10098 | 10 : | 08 : | 44.58 | +12 : | 17 : | 22.8 | 20.96 | 19.42 | 16.80 | 16.04 | 15.89 |
| 10505 | 10 : | 08 : | 23.93 | +12 : | 17 : | 08.3 | 20.79 | 19.12 | 16.45 | 15.64 | 15.48 |
| 11634 | 10 : | 08 : | 45.32 | +12 : | 16 : | 32.6 | 20.18 | 18.65 | 16.07 | 15.29 | 15.15 |
| 11760 | 10 : | 08 : | 28.72 | +12 : | 16 : | 25.5 | 20.98 | 19.27 | 16.50 | 15.71 | 15.55 |
| 12378 | 10 : | 08 : | 34.49 | +12 : | 15 : | 55.6 | 20.99 | 19.30 | 16.55 | 15.74 | 15.59 |
| 12596 | 10 : | 08 : | 38.36 | +12 : | 15 : | 44.7 | 21.12 | 19.48 | 16.66 | 15.83 | 15.67 |
| 12651 | 10 : | 08 : | 33.66 | +12 : | 15 : | 40.9 | 21.10 | 19.33 | 16.43 | 15.63 | 15.46 |
| 12779 | 10 : | 08 : | 33.68 | +12 : | 15 : | 33.5 | 21.41 | 19.64 | 16.70 | 15.93 | 15.79 |
| 12955 | 10 : | 08 : | 08.01 | +12 : | 15 : | 18.0 | 21.12 | 19.33 | 16.43 | 15.56 | 15.38 |
| 13430 | 10 : | 08 : | 21.36 | +12 : | 14 : | 42.8 | 21.26 | 19.22 | 16.08 | 15.21 | 15.02 |
| 13758 | 10 : | 08 : | 35.08 | +12 : | 14 : | 08.4 | 20.27 | 18.82 | 16.39 | 15.66 | 15.54 |
| 13911 | 10 : | 08 : | 21.39 | +12 : | 13 : | 48.6 | 21.27 | 19.38 | 16.42 | 15.64 | 15.47 |
| 14293 | 10 : | 08 : | 10.91 | +12 : | 12 : | 40.6 | 20.50 | 19.09 | 16.70 | 16.02 | 15.88 |
| 2555 | 10 : | 08 : | 41.83 | +12 : | 20 : | 46.9 | 20.28 | 18.72 | 16.12 | 15.32 | 15.17 |
| 2699 | 10 : | 08 : | 24.53 | +12 : | 20 : | 40.1 | 20.80 | 19.08 | 16.30 | 15.50 | 15.34 |
| 2864 | 10 : | 08 : | 15.85 | +12 : | 20 : | 32.4 | 20.87 | 19.21 | 16.50 | 15.68 | 15.51 |
| 3177 | 10 : | 08 : | 22.06 | +12 : | 20 : | 20.8 | 20.53 | 19.15 | 16.79 | 16.06 | 15.93 |
| 3478 | 10 : | 08 : | 36.91 | +12 : | 20 : | 11.3 | 20.68 | 19.17 | 16.47 | 15.64 | 15.48 |
| 3480 | 10 : | 08 : | 33.63 | +12 : | 20 : | 11.0 | 20.91 | 19.44 | 16.64 | 15.81 | 15.64 |
| 4547 | 10 : | 08 : | 34.94 | +12 : | 19 : | 38.9 | 20.85 | 19.31 | 16.61 | 15.84 | 15.71 |
| 4568 | 10 : | 08 : | 22.04 | +12 : | 19 : | 37.4 | 20.93 | 19.29 | 16.67 | 15.87 | 15.72 |
| 495 | 10 : | 08 : | 24.88 | +12 : | 23 : | 59.3 | 20.47 | 19.04 | 16.48 | 15.80 | 15.64 |
| 5078 | 10 : | 08 : | 37.15 | +12 : | 19 : | 24.2 | 20.56 | 19.09 | 16.66 | 15.86 | 15.72 |
| 5554 | 10 : | 08 : | 26.36 | +12 : | 19 : | 11.1 | 20.18 | 18.87 | 16.51 | 15.81 | 15.68 |
| 6236 | 10 : | 08 : | 31.57 | +12 : | 18 : | 54.3 | 20.62 | 19.14 | 16.70 | 15.92 | 15.79 |
| 6298 | 10 : | 08 : | 17.15 | +12 : | 18 : | 51.9 | 20.71 | 19.14 | 16.61 | 15.80 | 15.66 |
| 6458 | 10 : | 08 : | 22.00 | +12 : | 18 : | 48.9 | 20.67 | 18.96 | 16.32 | 15.51 | 15.35 |
| 6473 | 10 : | 08 : | 28.44 | +12 : | 18 : | 49.0 | 20.56 | 19.20 | 16.80 | 16.05 | 15.93 |
| 676 | 10 : | 08 : | 12.28 | +12 : | 23 : | 19.4 | 20.94 | 19.28 | 16.75 | 16.03 | 15.89 |
| 6878 | 10 : | 08 : | 26.58 | +12 : | 18 : | 40.1 | 21.01 | 19.37 | 16.79 | 16.07 | 15.90 |
| 6961 | 10 : | 08 : | 23.26 | +12 : | 18 : | 38.1 | 20.77 | 19.15 | 16.54 | 15.72 | 15.56 |
| 7216 | 10 : | 08 : | 29.25 | +12 : | 18 : | 31.9 | 20.69 | 18.95 | 16.21 | 15.41 | 15.24 |
| 7240 | 10 : | 08 : | 39.02 | +12 : | 18 : | 32.2 | 21.10 | 19.44 | 16.46 | 15.63 | 15.46 |
| 7924 | 10 : | 08 : | 17.07 | +12 : | 18 : | 14.7 | 21.16 | 19.51 | 16.73 | 15.94 | 15.79 |
| 8366 | 10 : | 08 : | 32.61 | +12 : | 18 : | 05.9 | 20.73 | 19.18 | 16.66 | 15.88 | 15.75 |
| 8476 | 10 : | 08 : | 14.57 | +12 : | 18 : | 01.7 | 20.93 | 18.98 | 16.09 | 15.24 | 15.06 |
| 8667 | 10 : | 08 : | 20.25 | +12 : | 17 : | 57.8 | 19.89 | 18.13 | 15.35 | 14.52 | 14.38 |
| 8836 | 10 : | 08 : | 27.89 | +12 : | 17 : | 54.8 | 21.44 | 19.59 | 16.66 | 15.82 | 15.66 |
| 9955 | 10 : | 08 : | 10.75 | +12 : | 17 : | 24.0 | 20.95 | 19.28 | 16.67 | 15.86 | 15.71 |
| ID | (J2000) | (J2000) | note | |||||||||
|---|---|---|---|---|---|---|---|---|---|---|---|---|
| 10027 | 10 : | 08 : | 35.28 | +12 : | 17 : | 24.5 | 21.50 | 19.46 | 16.21 | 15.46 | 15.23 | ALW-18 |
| 10531 | 10 : | 08 : | 19.49 | +12 : | 17 : | 07.1 | 21.48 | 19.53 | 16.44 | 15.69 | 15.39 | ALW-1 |
| 10543 | 10 : | 08 : | 31.03 | +12 : | 17 : | 07.7 | 20.86 | 18.80 | 15.74 | 14.94 | 14.69 | ALW-14 |
| 10975 | 10 : | 08 : | 27.51 | +12 : | 16 : | 53.9 | 21.67 | 19.47 | 16.97 | 15.97 | 15.30 | ALW-9,v |
| 1208 | 10 : | 08 : | 39.88 | +12 : | 22 : | 14.6 | 22.34 | 19.83 | 16.30 | 15.29 | 14.72 | DB-C08 |
| 13680 | 10 : | 08 : | 23.87 | +12 : | 14 : | 16.6 | 22.60 | 19.85 | 16.68 | 15.65 | 15.04 | ALW-4 |
| 13795 | 10 : | 08 : | 26.34 | +12 : | 14 : | 02.8 | 21.82 | 19.55 | 16.08 | 15.25 | 14.95 | ALW-6 |
| 14111 | 10 : | 08 : | 01.09 | +12 : | 13 : | 14.7 | – | – | 18.42 | 16.59 | 15.14 | |
| 1478 | 10 : | 08 : | 04.06 | +12 : | 21 : | 46.9 | 20.88 | 19.43 | 16.16 | 15.42 | 15.21 | |
| 20915 | 10 : | 08 : | 22.69 | +12 : | 23 : | 15.8 | – | – | 17.05 | 15.47 | 14.34 | DB-C13 |
| 21484 | 10 : | 08 : | 20.09 | +12 : | 20 : | 02.4 | – | – | 17.12 | 15.74 | 14.83 | DB-C02 |
| 2158 | 10 : | 08 : | 35.00 | +12 : | 21 : | 03.2 | 21.14 | 19.16 | 16.06 | 15.26 | 14.97 | ALW-16,v |
| 2641 | 10 : | 08 : | 29.53 | +12 : | 20 : | 43.0 | 21.22 | 19.39 | 16.43 | 15.65 | 15.38 | ALW-13 |
| 3493 | 10 : | 08 : | 18.08 | +12 : | 20 : | 09.2 | 21.52 | 19.32 | 16.27 | 15.39 | 15.05 | |
| 3554 | 10 : | 08 : | 16.60 | +12 : | 20 : | 07.0 | 21.13 | 19.27 | 16.50 | 15.72 | 15.51 | ALW-19 |
| 4137 | 10 : | 08 : | 28.50 | +12 : | 19 : | 48.6 | 21.02 | 19.58 | 16.10 | 15.20 | 14.80 | ALW-11,DB-C12 |
| 4458 | 10 : | 08 : | 48.36 | +12 : | 19 : | 42.0 | 21.00 | 19.37 | 16.83 | 16.12 | 15.93 | |
| 4523 | 10 : | 08 : | 12.89 | +12 : | 19 : | 37.9 | 22.72 | 19.99 | 15.88 | 14.96 | 14.51 | DB-C11 |
| 4951 | 10 : | 08 : | 24.82 | +12 : | 19 : | 26.9 | 21.09 | 19.09 | 15.79 | 14.94 | 14.62 | ALW-7 |
| 6101 | 10 : | 08 : | 27.30 | +12 : | 18 : | 57.3 | – | – | 16.99 | 15.31 | 14.09 | M02-B,v |
| 6103 | 10 : | 08 : | 25.62 | +12 : | 18 : | 57.1 | – | – | 16.04 | 15.08 | 14.58 | DB-C10,v |
| 626 | 10 : | 08 : | 28.23 | +12 : | 23 : | 30.1 | 21.61 | 19.52 | 16.34 | 15.56 | 15.32 | |
| 6343 | 10 : | 08 : | 29.28 | +12 : | 18 : | 51.6 | – | – | 17.89 | 16.03 | 14.55 | M02-A,v |
| 6598 | 10 : | 08 : | 32.34 | +12 : | 18 : | 46.2 | – | – | 15.56 | 14.59 | 14.10 | DB-C07,v |
| 7007 | 10 : | 08 : | 34.71 | +12 : | 18 : | 37.6 | 21.08 | 19.18 | 15.79 | 14.95 | 14.63 | ALW-15 |
| 7013 | 10 : | 08 : | 20.65 | +12 : | 18 : | 36.5 | – | – | 15.60 | 14.54 | 13.97 | DB-C03 |
| 7095 | 10 : | 08 : | 11.71 | +12 : | 18 : | 33.5 | 23.27 | 20.04 | 15.75 | 14.70 | 14.12 | DB-C04 |
| 7276 | 10 : | 08 : | 25.29 | +12 : | 18 : | 30.2 | 20.63 | 19.39 | 15.72 | 14.78 | 14.30 | ALW-8,DB-C06,v |
| 7450 | 10 : | 08 : | 22.55 | +12 : | 18 : | 25.9 | 21.40 | 19.22 | 15.85 | 14.92 | 14.52 | ALW-5,DB-C05 |
| 7965 | 10 : | 08 : | 15.76 | +12 : | 18 : | 13.7 | 21.15 | 19.32 | 16.73 | 16.01 | 15.82 | |
| 8336 | 10 : | 08 : | 41.20 | +12 : | 18 : | 07.1 | 18.77 | 18.73 | 17.30 | 15.87 | 14.61 | M02-D |
| 8717 | 10 : | 08 : | 22.25 | +12 : | 17 : | 57.0 | – | – | 17.18 | 15.22 | 13.57 | M02-C,v |
| 9344 | 10 : | 08 : | 19.96 | +12 : | 17 : | 41.4 | 21.69 | 19.54 | 15.65 | 14.79 | 14.44 | ALW-2,DB-C01 |
| 9745 | 10 : | 08 : | 27.68 | +12 : | 17 : | 31.8 | 21.43 | 19.46 | 16.47 | 15.73 | 15.43 | ALW-10 |
| 9951 | 10 : | 08 : | 21.76 | +12 : | 17 : | 25.0 | – | – | 16.11 | 15.17 | 14.72 | ALW-3,DB-C09 |
| 7125 | 10 : | 08 : | 30.08 | +12 : | 18 : | 34.2 | 21.11 | 19.59 | 17.11 | 16.45 | 16.26 | ALW-12 |
| 11242 | 10 : | 08 : | 40.39 | +12 : | 16 : | 46.0 | 21.52 | 19.88 | 17.42 | 16.77 | 16.59 | ALW-17,C? |
Acknowledgements
We thank M. Riello from the CASU Astronomical Data Centre for helpful comments and support with the WFCAM pipeline. We also thank Y. Momany for help and fruitful discussions in the course of this project. We acknowledge funding by the INAF PRIN07 project CRA 1.06.10.03. EVH wishes to acknowledge the hospitality of the Joint Astronomical Centre at Hilo where this paper was partly written. This publication made use of data products from the Two Micron All Sky Survey, which is a joint project of the University of Massachusetts and the Infrared Processing and Analysis Center/California Institute of Technology, funded by the National Aeronautics and Space Administration and the National Science Foundation.
References
- Aaronson et al. (1983) Aaronson M., Hodge P. W., Olszewski E. W., 1983, ApJ, 267, 271
- Aaronson & Mould (1985) Aaronson M., Mould J., 1985, ApJ, 290, 191
- Azzopardi et al. (1985) Azzopardi M., Lequeux J., Westerlund B. E., 1985, A&A, 144, 388
- Azzopardi et al. (1986) Azzopardi M., Lequeux J., Westerlund B. E., 1986, A&A, 161, 232
- Battinelli & Demers (2009) Battinelli P., Demers S., 2009, A&A, 493, 1075
- Bellazzini et al. (2004) Bellazzini M., Gennari N., Ferraro F. R., Sollima A., 2004, MNRAS, 354, 708
- Bessell & Brett (1988) Bessell M. S., Brett J. M., 1988, PASP, 100, 1134
- Bosler et al. (2007) Bosler T. L., Smecker-Hane T. A., Stetson P. B., 2007, MNRAS, 378, 318
- Caputo et al. (1999) Caputo F., Cassisi S., Castellani M., Marconi G., Santolamazza P., 1999, AJ, 117, 2199
- Casali & et al. (2007) Casali M., et al. 2007, A&A, 467, 777
- Cioni (2007) Cioni M., 2007, in F. Kerschbaum, C. Charbonnel, & R. F. Wing eds., Asp. Conf. Ser. Vol. 378, Why Galaxies Care About AGB Stars: Their Importance as Actors and Probes, Astron. Soc. Pac., San Francisco, p. 386
- Da Costa & Armandroff (1990) Da Costa G. S., Armandroff T. E., 1990, AJ, 100, 162
- Demers & Battinelli (2002) Demers S., Battinelli P., 2002, AJ, 123, 238
- Dolphin et al. (2005) Dolphin A. E., Weisz D. R., Skillman E. D., Holtzman J. A., 2005, preprint (arXiv:astro-ph/0507244)
- Dye et al. (2006) Dye S., Warren S. J., Hambly N. C., Cross N. J. G., Hodgkin S. T., Irwin M. J., Lawrence A., Adamson A. J., Almaini O., Edge A. C., Hirst P., Jameson R. F. a., 2006, MNRAS, 372, 1227
- Gallart et al. (1999) Gallart C., Freedman W. L., Aparicio A., Bertelli G., Chiosi C., 1999, AJ, 118, 2245
- Geisler et al. (2007) Geisler D., Wallerstein G., Smith V. V., Casetti-Dinescu D. I., 2007, PASP, 119, 939
- Girardi et al. (2002) Girardi L., Bertelli G., Bressan A., Chiosi C., Groenewegen M. A. T., Marigo P., Salasnich B., Weiss A., 2002, A&A, 391, 195
- Girardi et al. (2005) Girardi L., Groenewegen M. A. T., Hatziminaoglou E., da Costa L., 2005, A&A, 436, 895
- Girardi & Marigo (2007) Girardi L., Marigo P., 2007, in F. Kerschbaum, C. Charbonnel, & R. F. Wing eds., Asp. Conf. Ser. Vol. 378, Why Galaxies Care About AGB Stars: Their Importance as Actors and Probes, Astron. Soc. Pac., San Francisco, p. 20
- Groenewegen (2006) Groenewegen M. A. T., 2006, A&A, 448, 181
- Groenewegen (2007) Groenewegen M. A. T., 2007, in F. Kerschbaum, C. Charbonnel, & R. F. Wing eds., Asp. Conf. Ser. Vol. 378, Why Galaxies Care About AGB Stars: Their Importance as Actors and Probes, Astron. Soc. Pac., San Francisco, p. 433
- Gullieuszik et al. (2008) Gullieuszik M., Held E. V., Rizzi L., Girardi L., Marigo P., Momany Y., 2008, MNRAS, 388, 1185
- Gullieuszik et al. (2007a) Gullieuszik M., Held E. V., Rizzi L., Saviane I., Momany Y., Ortolani S., 2007a, A&A, 467, 1025
- Gullieuszik et al. (2009) Gullieuszik M., Held E. V., Saviane I., Rizzi L., 2009, A&A, 500, 735
- Gullieuszik et al. (2007b) Gullieuszik M., Rejkuba M., Cioni M. R., Habing H. J., Held E. V., 2007b, A&A, 475, 467
- Harris & Zaritsky (2004) Harris J., Zaritsky D., 2004, AJ, 127, 1531
- Held et al. (2001) Held E. V., Clementini G., Rizzi L., Momany Y., Saviane I., Di Fabrizio L., 2001, ApJ, 562, L39
- Held et al. (2000) Held E. V., Saviane I., Momany Y., Carraro G., 2000, ApJ, 530, L85
- Herwig et al. (1998) Herwig F., Schoenberner D., Bloecker T., 1998, A&A, 340, L43
- Hodgkin et al. (2009) Hodgkin S. T., Irwin M. J., Hewett P. C., Warren S. J., 2009, MNRAS, 394, 675
- Irwin & Hatzidimitriou (1995) Irwin M., Hatzidimitriou D., 1995, MNRAS, 277, 1354
- Koch et al. (2007) Koch A., Wilkinson M. I., Kleyna J. T., Gilmore G. F., Grebel E. K., Mackey A. D., Evans N. W., Wyse R. F. G., 2007, ApJ, 657, 241
- Lagadec & Zijlstra (2008) Lagadec E., Zijlstra A. A., 2008, MNRAS, 390, L59
- Lagadec et al. (2008) Lagadec E., Zijlstra A. A., Matsuura M., Menzies J. W., van Loon J. T., Whitelock P. A., 2008, MNRAS, 383, 399
- Lee et al. (1993) Lee M. G., Freedman W., Mateo M., Thompson I., Roth M., Ruiz M.-T., 1993, AJ, 106, 1420
- Majewski et al. (2000) Majewski S. R., Ostheimer J. C., Kunkel W. E., Patterson R. J., 2000, AJ, 120, 2550
- Makarov et al. (2006) Makarov D., Makarova L., Rizzi L., Tully R. B., Dolphin A. E., Sakai S., Shaya E. J., 2006, AJ, 132, 2729
- Marigo (2007) Marigo P., 2007, A&A, 467, 1139
- Marigo & Girardi (2007) Marigo P., Girardi L., 2007, A&A, 469, 239
- Marigo et al. (2008) Marigo P., Girardi L., Bressan A., Groenewegen M. A. T., Silva L., Granato G. L., 2008, A&A, 482, 883
- Matsuura et al. (2007) Matsuura M., Zijlstra A. A., Bernard-Salas J., Menzies J. W., Sloan G. C., Whitelock P. A., Wood P. R., Cioni M., Feast M. W., Lagadec E., van Loon J. T., Groenewegen M. A. T., Harris G. J., 2007, MNRAS, 382, 1889
- Méndez et al. (2002) Méndez B., Davis M., Moustakas J., Newman J., Madore B. F., Freedman W. L., 2002, AJ, 124, 213
- Menzies et al. (2002) Menzies J., Feast M., Tanabé T., Whitelock P., Nakada Y., 2002, MNRAS, 335, 923
- Menzies et al. (2008) Menzies J., Feast M., Whitelock P., Olivier E., Matsunaga N., da Costa G., 2008, MNRAS, 385, 1045
- Momany et al. (2002) Momany Y., Held E. V., Saviane I., Rizzi L., 2002, A&A, 384, 393
- Mowlavi (1999) Mowlavi N., 1999, A&A, 344, 617
- Nikolaev & Weinberg (2000) Nikolaev S., Weinberg M. D., 2000, ApJ, 542, 804
- Pagel & Tautvaišienė (1998) Pagel B. E. J., Tautvaišienė G., 1998, MNRAS, 299, 535
- Rizzi et al. (2007) Rizzi L., Held E. V., Saviane I., Tully R. B., Gullieuszik M., 2007, MNRAS, 380, 1255
- Salaris & Girardi (2005) Salaris M., Girardi L., 2005, MNRAS, 357, 669
- Saviane et al. (2000) Saviane I., Rosenberg A., Piotto G., Aparicio A., 2000, A&A, 355, 966
- Skrutskie et al. (2006) Skrutskie M. F., Cutri R. M., Stiening R., Weinberg M. D., Schneider S., Carpenter J. M., Beichman C., Capps R., Chester T., Elias J., Huchra J., Liebert J., Lonsdale C., Monet D. G., 2006, AJ, 131, 1163
- Sohn et al. (2007) Sohn S. T., Majewski S. R., Muñoz R. R., Kunkel W. E., Johnston K. V., Ostheimer J. C., Guhathakurta P., Patterson R. J., Siegel M. H., Cooper M. C., 2007, ApJ, 663, 960
- Stetson (1987) Stetson P. B., 1987, PASP, 99, 191
- Stetson (1994) Stetson P. B., 1994, PASP, 106, 250
- Totten et al. (2000) Totten E. J., Irwin M. J., Whitelock P. A., 2000, MNRAS, 314, 630
- Valenti et al. (2004a) Valenti E., Ferraro F. R., Origlia L., 2004a, MNRAS, 351, 1204
- Valenti et al. (2004b) Valenti E., Ferraro F. R., Origlia L., 2004b, MNRAS, 354, 815
- Wagenhuber & Groenewegen (1998) Wagenhuber J., Groenewegen M. A. T., 1998, A&A, 340, 183
- Whitelock & Feast (2000) Whitelock P., Feast M., 2000, Memorie della Societa Astronomica Italiana, 71, 601
- Whitelock et al. (2009) Whitelock P. A., Menzies J. W., Feast M. W., Matsunaga N., Tanabé T., Ita Y., 2009, MNRAS, 394, 795