The First Release of the CSTAR Point Source Catalog from Dome A, Antarctica
Abstract
In 2008 January the 24th Chinese expedition team successfully deployed the Chinese Small Telescope ARray (CSTAR) to Dome A, the highest point on the Antarctic plateau. CSTAR consists of four 14.5cm optical telescopes, each with a different filter (g, r, i and open) and has a field of view (FOV). It operates robotically as part of the Plateau Observatory, PLATO, with each telescope taking an image every 30 seconds throughout the year whenever it is dark. During 2008, CSTAR #1 performed almost flawlessly, acquiring more than 0.3 million i-band images for a total integration time of 1728 hours during 158 days of observations. For each image taken under good sky conditions, more than 10,000 sources down to magnitude could be detected. We performed aperture photometry on all the sources in the field to create the catalog described herein. Since CSTAR has a fixed pointing centered on the South Celestial Pole (Dec ), all the sources within the FOV of CSTAR were monitored continuously for several months. The photometric catalog can be used for studying any variability in these sources, and for the discovery of transient sources such as supernovae, gamma-ray bursts and minor planets.
1 Introduction
The Antarctic Plateau has great potential for astronomical observations as it is extremely cold and dry and has a calm and tenuous atmosphere—attributes that are particularly favourable for optical, infrared and submillimeter observations. For photometry, there is the advantage of reduced scintillation as a result of the decreased high-altitude turbulence above the Antarctica plateau. (Kenyon et al., 2006). In addition, there is the possibility of long, continuous observations uninterrupted by the usual diurnal cycle, giving access to a time-series regime otherwise only available from space (Kenyon & Storey, 2006; Mosser & Aristidi, 2007; Rauer et al., 2008).
Astronomers have been interested in the Antarctic plateau for over thirty years (see Indermuehle et al. (2005) for a historical account). The first stellar photometry from Antarctica was conducted at the South Pole by Taylor et al. (1988) in the late 1980s. More recently, Strassmeier and colleagues (Strassmeier et al., 2008) have conducted continuous time-series observations from Dome C with sIRAIT, a small f/12 optical telescope. The ASTEP South project has reported 1592 hours of observations of the South Celestial Pole from Dome C during 2008 using a 10 cm refractor and pixel CCD camera (Crouzet et al., 2009).
At optical wavelengths most of the attention is now focussed on the Concordia station at Dome C, where excellent cloud-cover statistics, low free-atmosphere seeing and a relatively thin turbulent boundary layer have been measured, as summarised in e.g., Storey (2005). For example, Lawrence et al. (2004) investigated the seeing at Dome C and reported that the median seeing above the boundary layer is , and for 25% of the time is as low to 0.15′′. Thus, for some observations even a small telescope at Dome C can be as effective as a much larger one at the best temperate observatories.
Dome A is located at longitude E, latitude S, and is 1271 km directly inland from the Chinese Zhongshan Station. The elevation of Dome A is 4093 meters above sea level, the temperature is quite low (sometimes below C), the surface wind speeds are even lower than those at Dome C, and the precipitable water vapor is extraordinarily low (Kulesa et al., 2009). The seeing at Dome A from above the boundary layer may be better than that at Dome C, and the boundary layer itself should be thinner—perhaps as low as 15 meters for much of the time.
Recently, Saunders et al. (2009) compared Domes A, B, C and F, and Ridges A and B from the point of view of cloud cover, boundary layer thickness, auroral emission, free-atmosphere seeing, precipitable water vapor and surface temperature—and concluded that Dome A is possibly the best site on earth currently being used for astronomical observations.
Because of the potential opportunities offered by Dome A for astronomy and other scientific studies, an permanent station, Kunlun station, was established at Dome A by the 25th Chinese expedition team in 2009 January.
In early 2007, Chinese astronomers began the development of CSTAR, with an extensive testing program (Zhou et al. 2009). In November of that year, the CSTAR system was shipped to Antarctica as part of the Plateau Observatory (PLATO) (Lawrence et al., 2008; Yang et al., 2009), and commissioned at Dome A in 2008 January. CSTAR began observations from Dome A in 2008 March, as soon as the sky became sufficiently dark. During the year, we were typically able to return one image per day and roughly one third of the photometric catalog (less than 3000 bright stars) via Iridium satellite. CSTAR worked well until early August, when the PLATO power system shut down. The 25th Chinese expedition team returned to Dome A in 2009 January, retrieving all the data including images and catalogs that were stored on a large hard disk. The Dome A data are valuable as they have many potential uses, from site characterisation to the study of astronomical sources such as variable stars, supernovae, gamma-ray bursts and extra-solar planets. A separate paper analysing the weather statistics of the Dome A site from CSTAR data is in preparation (Zou et al., 2010).
This paper is organized as follows. A description of CSTAR and the data reduction method are presented in §2. The observations from Dome A are described in §3. In §4, we describe the data processing of these observations to produce the catalog. In §5, we discuss the photometric accuracy of the catalog. A final summary is presented in §6.
2 CSTAR
2.1 The instrument
The CSTAR program is conducted under the auspices of the Chinese Center for Antarctic Astronomy. The telescopes were built by the Nanjing Institute of Astronomical Optics & Technology (NIAOT) (Yuan et al., 2008), while the hardware and software of the data acquisition system were developed by the National Astronomical Observatories, Chinese Academy of Sciences (NAOC) (Zhou et al., 2009). CSTAR consists of four 14.5cm Schmidt telescopes, each with a different filter: g, r, i and open. The FOV is 20 deg2). Each telescope is equipped with an Andor DV435 1k1k CCD, giving a pixel size of about 15′′ in the sky. A 750 GB hard disk is used as the main storage, with all the software including the Windows XP operating system installed in a 4 GB Compact Flash memory. An 8 GB solid state disk is used in each computer to back up the most important data. The computer system can work at temperatures down to C, and is installed inside the PLATO instrument module where it is kept well above this temperature by the PLATO thermal management system (Luong-Van et al., 2008). The CCD cameras and electronics are installed outside on the CSTAR telescopes, where the ambient temperature can be lower than C.
Before its deployment to Dome A, the CSTAR data acquisition system was tested at Kalasu on the high plateau of Pamir in China, close to Tajikistan. At an elevation of 4450 meters and with temperatures that plunged to C during the tests, Kalasu provides an excellent environment for pre-deployment testing of astronomical instruments for Dome A. The complete CSTAR system was also tested at the NAOC’s Xinglong observatory at the beginning of September of 2007. Details of these tests are presented in Zhou et al. (2009).
In Zhou et al. (2009) we also describe the data acquisition procedure and automatic photometric pipeline used to perform aperture photometry on all the point sources in our images. The apertures for the photometry are 3, 4 and 5 pixels in radius and the inner and outer radius of the sky annulus is 10 and 20 pixels, respectively.
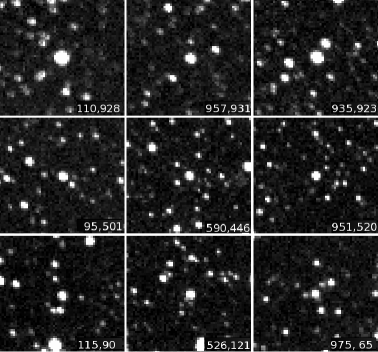
The typical FWHM of the point spread function (PSF) of a stellar image taken by CSTAR#1 is between 1.5 and 2.5 pixels. The spot diagram under laboratory conditions, that is C and 1 atm pressure, is shown in Yuan et al. (2008). The optical system may have suffered some misalignment from vibration during the almost 1300km sled traverse from Zhongshan Station to Dome A. It is also possible that there were some optical alignment changes due to the low ambient temperature at Dome A, although this was allowed for in the design. An image from CSTAR#1, A5CH5029.fit, is shown in Figure 1 to illustrate the realized optical quality at Dome A, where of the light energy is encircled in 2 pixels.
3 Observations at Dome A
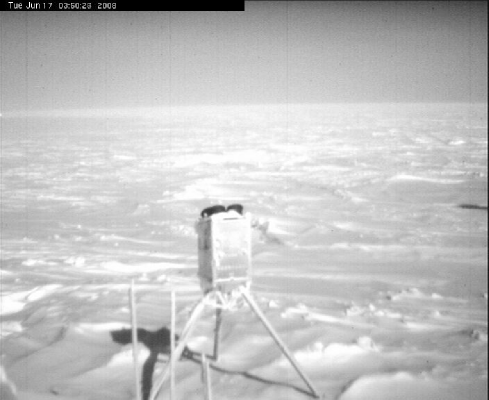
CSTAR observed robotically at Dome A from 2008 March 4 until 2008 August 8 (see Figure 2), taking an image with each telescope whenever it was dark enough to do so. The exposure time was changed from 20 sec to 30 sec on April 4. The CCD is a frame transfer CCD, which allows us to operate without a mechanical shutter. We readout the image after each exposure and perform a real-time data reduction for producing an initial catalog. A deadtime of 2.61 sec results in times between exposures of 22.61 sec, or 32.61 sec after April 4. Images were not taken if the sky was too bright. For a variety of technical reasons only CSTAR#1 produced images of good optical quality during 2008. There are 16918, 50575, 68157, 110357, 58711 and 5749 of these images from March, April, May, June, July and August, respectively. The total exposure times were 67.4, 311.4, 378.7, 613.1, 326.2 and 31.9 hours, respectively, in these months, giving a total exposure time of 1728 hours. We plot the distribution of integrated exposure time for each month in Figure 3. The integrated exposure time in June is the longest and is over one third of the total exposure time, while the exposure time in August is the shortest due to the shutdown of the PLATO power system.


4 Data Reduction
We have developed a pipeline for image processing and photometry that includes bias and flat-field correction, and then performs aperture photometry (Zhou et al., 2009). This work was undertaken during testing CSTAR at NAOC’s Xinglong station. The quality of the images taken at Dome A was significantly better than obtained at Xinglong due to the lower CCD temperature and improved sky conditions.
4.1 Flat fielding
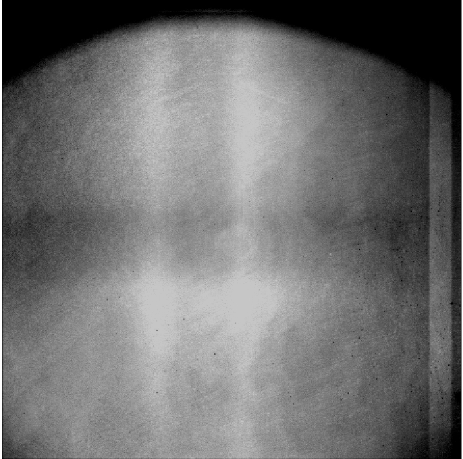
We constructed a flat-field image, shown in Figure 5, from a median of images taken with a high sky background, after removal of stars using sigma-clipping. To correct for variations in the flat-field over large spatial scales, we selected more than 50,000 images taken under conditions of good transparency and looked for systematic changes in the brightnesses of stars during their daily circular motion around the South Pole. This allowed us to create an additional “residual flat-field” correction that improved our photometric accuracy.
For this first release of the catalog we have not checked the variation of the flat-field during the year, nor with CCD temperature. The next release will include improved flat-fielding using images taken under photometric conditions with high sky background (i.e., during twilight or bright moon).
4.2 Absolute flux calibration
An image, A5CH5029, was taken under relatively good photometric conditions (17:50:29 UT, 2008 May 5) and was used as a standard image for calibrating magnitude offsets. For each other image, we derived a single magnitude offset, to be applied to all the stars on the image, from the mean of the magnitude offsets of a selection of bright stars.
The USNO-B catalog (Monet et al., 2003) contains stellar magnitudes in the optical passbands B1, B2, R1, R2 and I2 for over one billion objects over the whole sky. The catalog is complete down to mag, with a positional accuracy of at J2000 and a photometric accuracy of better than 0.3 magnitudes in the five colors. Since the USNO-B catalog contains such well calibrated magnitudes of the point sources in our observed field, we elected to use these objects for our flux calibration. Fortunately, Monet et al. (2003) have derived a formula for transforming the USNO-B1.0 magnitudes to those appropriate to the Sloan Digital Sky Survey (SDSS) filters, based on deg2 of SDSS Early Data Release. Since the CSTAR filters were chosen to be very similar to the SDSS filters, we can use this formula directly. We determine with 48 field stars. The differences between CSTAR instrumental magnitude and SDSS magnitudes of these stars are shown in Figure 4. The offset was used to transform the CSTAR instrumental magnitudes to SDSS i-band magnitudes. To reduce statistical measurement errors, we only selected the brightest stars for the offset calibration. We plan to do further work on choosing well-calibrated standard stars for our next run of the data reduction pipeline.
4.3 Time calibration
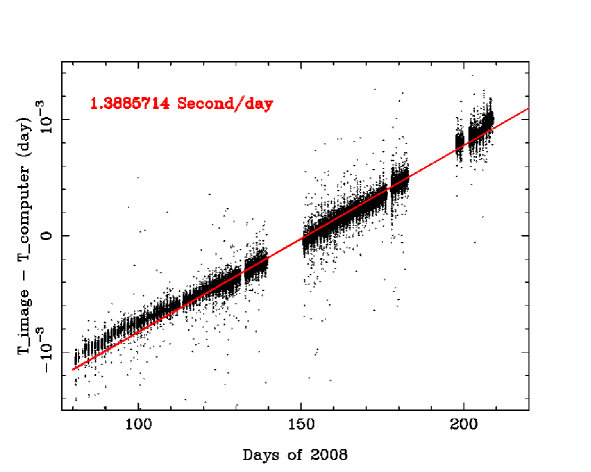
The CSTAR#3 computer included a GPS receiver to maintain time synchronisation and this time was intended to be distributed to the other CSTAR computers. However, there was a communication problem between CSTAR#3 and the other computers throughout the year. As a result, the timing of CSTAR#1 ran independently and at its own rate for the entire observation period. While this would normally create an intractable data reduction problem—particularly when determining the epochs of transient events and eclipses—in this case it is easily corrected. CSTAR is fixed in position and points at the South Celestial Pole. Every star traces out a circle on the CCD, and the position of each star can be used as a clock. To identify the stars, we calculate the rotation and shift of every image relative to a standard image using the positions of all the bright stars. The mean rotation angle relative to the standard image is then used to derive the rate of drift of computer time. In this way, precise timing can be determined. We find that the computer clock typically runs 1.3885714 seconds/day slower than the real local time. Figure 7 shows the time difference between the computer time and the real time obtained from the star positions during a period of 140 days of observation. The computer time on 2008 January 25 should be correct, because the computer time was manually set to GPS time (UT) on that date. In the catalog we present the corrected Julian time at the mid-exposure point of every image. This time should be accurate to a few seconds.
4.4 Photometric accuracy
Besides the statistical errors in the star and background brightness measurements, there are several systematic errors that may affect the derived stellar fluxes. The main systematic errors are:
1) Residual flat-field and bias correction errors. Light curves of all of the stars that had no significant variation were used to improve the flat-field correction map. However, a single flat-field and bias image were used for all observations, with no attempt to allow for temperature variations or instrumental drifts. This may have introduced systematic errors with each star tracing out a circle on the CCD.
2) Point Spread Function (PSF) variation. The CSTAR telescopes have a large field-of-view, square degrees, making it impossible for the optical design to keep the PSF uniform over all parts of the image. Since we used a fixed aperture to measure the magnitudes of the stars, there will be some measurement error from the PSF variation depending on the star location within the image.
3) Under-sampling. Each pixel of the CSTAR CCD is 15′′, so the light from a star might fall on only one or two pixels, with resultant problems from intra-pixel sensitivity variations.
4) Aurorae and thin cirrus clouds. These introduce an inhomogeneity in the sky background, especially during full moon. In the case of cirrus, there will be a resultant variable extinction across the field-of-view. The photometric calibration can therefore differ from one star to another. The sky background for each star is also difficult to estimate in the presence of cirrus.
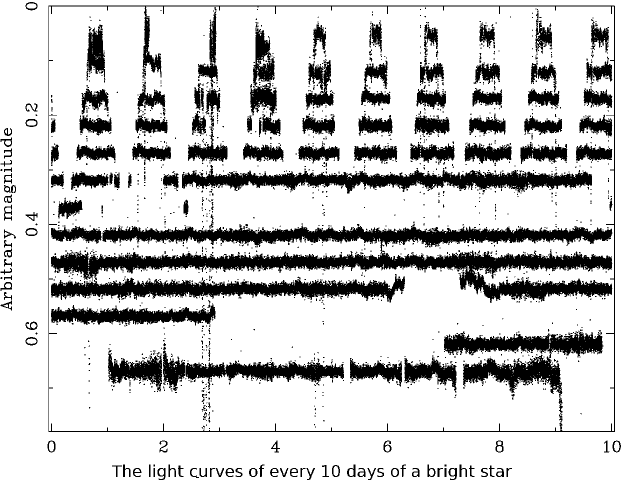
The systematic photometric error exceeds other sources of error when observing bright stars. As an example, we plot the light curve of a bright star (HIP 48752 = GSC 9518:379) of i8.2 mag at () in Figure 6. In the Figure, the light curves for every 10 days, with an arbitrary magnitude offset, are shown. From examining the best quality images, the RMS of the light curve variation is about 0.003 mag. We expect that the systematic error should be smaller than 0.003 mag.
To estimate the overall real measurement error for each field star in the image, we compared every image to a standard image. The standard image, A5CH5029, was taken under relatively good photometric conditions (17:50:29 UT, 2008 May 5). By comparison of the calibrated magnitudes of all the stars in the two images, we can plot the RMS error as a function of the magnitude of the stars.
As an example we show in Figure 8 the distribution of the measurement difference in magnitude for every star obtained from image A62M5104 and the standard image A5CH5029. We divided the magnitude range into small bins of 0.2 mag, then calculated the dispersion of the magnitude as the “real measurement error” in each magnitude interval. The error bars as a function of magnitude as shown in Figure 8 were then applied to all the measurements in the catalog for that image.
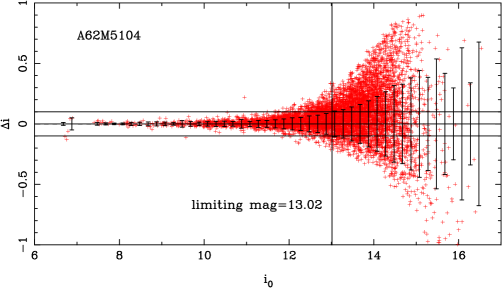
We defined the magnitude limit of our images as the magnitude which has a RMS error of 0.1 mag, which corresponds to a S/N=10.

As a byproduct of estimating the measurement error, the magnitude limit is also obtained for each image. In Figure 9 we plot the limiting magnitude distribution for all of the images taken over the 24 hours during 2008 May 12. The limiting magnitude changes with time because of variations in atmospheric extinction and sky brightness.
The final output from our data reduction is a catalog of star magnitudes for each image. The contents of the catalog are arranged as follow: The first two columns are RA and DEC, respectively; the following columns are the magnitudes and errors in aperture photometry obtained with radii of 3, 4, and 5 pixels respectively. In the header of the catalog some additional information is provided: the CCD temperature, the date and corrected time (UT) at the exposure midpoint, exposure time (seconds), sky brightness (ADU), filter number and number of sources found in the image.
| Number | RA | DEC | ||||||
|---|---|---|---|---|---|---|---|---|
| (J2000) | (J2000) | (r=3 pixel) | (r=4 pixels) | (r=5 pixels) | ||||
| 277 | 23:23:46.274 | -89:25:17.81 | 11.095 | 0.022 | 11.011 | 0.022 | 10.838 | 0.025 |
| 278 | 10:43:24.023 | -88:42:00.78 | 11.099 | 0.026 | 11.048 | 0.022 | 11.013 | 0.022 |
| 279 | 16:13:39.187 | -87:44:30.11 | 11.100 | 0.026 | 11.030 | 0.022 | 11.014 | 0.022 |
| 280 | 14:09:08.706 | -89:07:12.63 | 11.100 | 0.026 | 11.035 | 0.022 | 10.987 | 0.022 |
| 281 | 13:46:15.127 | -88:26:01.94 | 11.100 | 0.026 | 11.013 | 0.022 | 10.885 | 0.025 |
| 282 | 17:54:27.175 | -89:42:21.70 | 11.103 | 0.026 | 11.065 | 0.022 | 11.032 | 0.022 |
NOTE. The header parameters are decoded as: (1) : CCD temperature in Celcius (2) 2008 Jun 02: date (3) 20: exposure time in seconds (3) 10398: the number of sources detected in the image (4) 154.954086 day of the year during 2008. The catalogs can be downloaded from National Astronomical Observatories Science Data Center, Chinese Academy of Science at http://archive.bao.ac.cn/en/cstar.
5 Summary and catalog availability
The CSTAR Point Source Catalog first release contains 1728 hours of i-band photometry data taken by CSTAR#1 at Dome A, Antarctica, between 2008 March 4 and 2008 August 8. The data are from a fixed field-of-view of centered on the South Celestial Pole, with an image taken approximately every 30 s. Aperture photometry was used to derive the magnitudes of each of the 10,000 stars that were typically identified in each of the 300,000 images. The data have been flux calibrated using 48 standard stars to link to the USNO-B1.0 photometric system. The CSTAR catalog is available at http://archive.bao.ac.cn/en/cstar.
Acknowledgments
This study has been supported by the Chinese National Natural Science Foundation through grants 10873016, 10803007, 10473012, 10573020, 10633020, 10673012, and 10603006, and by the National Basic Research Program of China (973 Program), No. 2007CB815403. This research is also supported by the Chinese PANDA International Polar Year project, the Polar Research Institute of China (PRIC), and the international science and technology cooperation projects 2008DFA20420 of the Ministry of Science and Technology of China. The PLATO observatory was supported by the Australian Research Council and the Australian Antarctic Division. Iridium communications were provided by the US National Science Foundation and the United States Antarctic Program. The authors wish to thank all members of the 2008 and 2009 PRIC Dome A expeditions for their heroic effort in reaching the site and for providing invaluable assistance to the expedition astronomers in setting up and servicing the PLATO observatory and its associated instrument suite. Additional financial contributions have been made by the institutions involved in this collaboration.
References
- Crouzet et al. (2009) Crouzet, N., et al. 2009, 2009arXiv0912.2644C
- Indermuehle et al. (2005) Indermuehle, B. T., Burton, M. G., & Maddison, S. T. 2005, Publications of the Astronomical Society of Australia, 22, 73
- Kenyon et al. (2006) Kenyon, S. L., Lawrence, J. S., Ashley, M. C. B., Storey, J. W. V., Tokovinin, A., & Fossat, E. 2006, PASP, 118, 924
- Kenyon & Storey (2006) Kenyon, S. L., & Storey, J. W. V. 2006, PASP, 118, 489
- Kulesa et al. (2009) Kulesa et al. 2009, in preparation
- Lawrence et al. (2004) Lawrence, J. S., Ashley, M. C. B., Tokovinin, A. & Travouillon, T. 2004, Nature, 431, 278
- Lawrence et al. (2008) Lawrence, J. S., et al. 2008, Proc. SPIE, 7012, 701227
- Luong-Van et al. (2008) Luong-Van, D. M., Ashley, M. C. B., Everett, J. R., Lawrence, J. S., & Storey, J. W. V. 2008, Proc. SPIE, 7019, 70192U
- Monet et al. (2003) Monet, D. G., Levine, S. E., Canzian, B., et al. 2003, AJ, 125, 984
- Mosser & Aristidi (2007) Mosser, B., & Aristidi, E. 2007, PASP, 119, 127
- Rauer et al. (2008) Rauer, H., Fruth, T., & Erikson, A. 2008, PASP, 120, 852
- Saunders et al. (2009) Saunders, W., Lawrence, J.S., Storey, J.W.V., Ashley, M.C.B., Kato, S., Minnis, P., Winker, D., Liu, G., Kulesa, C., 2009 PASP, 121, 976
- Storey (2005) Storey, J.W.V., 2005 Antarctic Science, 17, 555
- Strassmeier et al. (2008) Strassmeier, K.G. et al. 2008 A&A, 490, 287
- Taylor et al. (1988) Taylor, M., Chen, K.-Y., McNeill, J. D., Merrill, J. E., Oliver, J. P., & Wood, F. B. 1988, PASP, 100, 1544
- Yang et al. (2009) Yang, H.G., et al. 2009, PASP, 121,174
- Yuan et al. (2008) Yuan, X.Y., et al. 2008, SPIE, 7012,152
- Zhou et al. (2009) Zhou, X., Wu, Z.Y. et al. 2009, RAA, submitted
- Zou et al. (2010) Zou, H., Zhou, X., Wu, Z.Y. et al. 2010, AJ, submitted