Superconductivity induced by doping platinum in BaFe2As2
Abstract
By substituting Fe with the 5d-transition metal Pt in BaFe2As2, we have successfully synthesized the superconductors BaFe2-xPtxAs2. The systematic evolution of the lattice constants indicates that the Fe ions were successfully replaced by Pt ions. By increasing the doping content of Pt, the antiferromagnetic order and structural transition of the parent phase is suppressed and superconductivity emerges at a doping level of about x = 0.02. At a doping level of x = 0.1, we get a maximum transition temperature Tc of about 25 K. While even for this optimally doped sample, the residual resistivity ratio (RRR) is only about 1.35, indicating a strong impurity scattering effect. We thus argue that the doping to the Fe-sites naturally leads to a high level impurity scattering, although the superconductivity can still survive at about 25 K. The synchrotron powder x-ray diffraction shows that the resistivity anomaly is in good agreement with the structural transition. The superconducting transitions at different magnetic fields were also measured at the doping level of about x = 0.1, yielding a slope of -dHc2/dT = 5.4 T/K near Tc. Finally a phase diagram was established for the Pt doped 122 system. Our results suggest that superconductivity can also be easily induced in the FeAs family by substituting the Fe with Pt, with almost the similar maximum transition temperatures as doping Ni, Co, Rh and Ir.
pacs:
74.70.Dd, 74.25.Fy, 75.30.Fv, 74.10.+vI Introduction
The FeAs-based compounds have formed a new family in the field of high- superconductorsKamihara2008 . Many new structures with the FeAs layers have been found, including the so-called 1111 phase (LNFeAsO, AEFeAsF, LN = rare earth elements, AE = alkaline earth elements)Kamihara2008 ; SrFeAsF1 ; SrFeAsF2 , 122 phase (, = alkaline earth elements)Rotter ; CWCh , 111 phase (LiFeAs, NaFeAs)LiFeAs ; NaFeAs , 11 phase (FeSe)WuMK , 32522 phase (Sr3Sc2O5Fe2As2)FeAs32522 , and 21311 phase (Sr2ScO3FeP and Sr2VO3FeAs )FeP42622 ; V42622 . In the system of (Ba,Sr)1-xKxFe2As2 with the ThCr2Si2 structure (denoted as 122 phase), the maximum Tc at about 38 K was discoveredRotter ; CWCh at about x = 0.40. Large single crystals can be grown in this 122 system.NiN ; Luohq It has been already found that by substituting the Fe-sites with the 3d, 4d, and 5d transition metals like CoSefat ; XuZA ; NiN , NiBaNiFeAs , RuRu , Rh, Pd and Irhanfei ; NiN2 , the superconductivity can be induced. It is thus necessary to see whether doping another 5d element Pt can also induce superconductivity in the 122 phase. In this paper, we report the successful fabrication of the new superconductor BaFe2-xPtxAs2 with the maximum Tc of about 25 K at the doping level of x = 0.1. X-ray diffraction (XRD) pattern, resistivity, synchrotron powder x-ray diffraction, DC magnetic susceptibility and upper critical field have been measured in this Pt-doped system. We also explored the phase diagram concerning the gradual vanishing of the antiferromagnetic order and the establishment of superconductivity upon doping Pt in this system.
II Sample preparation
The polycrystalline samples BaFe2-xPtxAs2 were synthesized by using a two-step solid state reaction method. Firstly, BaAs, PtAs and Fe2As powders were obtained by the chemical reaction with Ba pieces, Pt powders (purity 99.95%), Fe powders (purity 99.99%) and As grains. Then they were mixed together in the formula BaFe2-xPtxAs2, ground and pressed into a pellet shape. All the weighing, mixing and pressing procedures were performed in a glove box with a protective argon atmosphere (both H2O and O2 are limited below 0.1 ppm). The pellet was sealed in a silica tube with 0.2 bar of Ar gas and followed by a heat treatment at 900 oC for 30 hours. Then it was cooled down slowly to room temperature.
III Experimental data and discussion
The x-ray diffraction measurements were performed at room temperature using an MXP18A-HF-type diffractometer with Cu-Kα radiation from 10∘ to 80∘ with a step of 0.01∘. Synchrotron powder x-ray diffraction (XRD) experiments were performed on a large Debye-Scherrer camera installed at SPring-8 beam line BL02B2 by using an imaging plate as the detector. The wavelength of the x-ray was determined to be 0.602 by using CeO2 as the reference. Glass capillaries with an inner diameter of 0.3 mm were used to hold the powder samples in order to eliminate the preferred orientation. The Rietveld refinements were carried out using GSAS in the angle range of 2∘ to 75∘ with an increment of 0.01∘GSAS . The DC magnetization measurements were done with a superconducting quantum interference device (Quantum Design, SQUID, MPMS7). The zero-field-cooled magnetization was measured by cooling the sample at zero field to 2 K, then a magnetic field was applied and the data were collected during the warming up process. The field-cooled magnetization data has been collected in the warming up process after the sample was cooled down to 2 K at a finite magnetic field. The resistivity measurements were done with a physical property measurement system PPMS-9T (Quantum Design) with the four-probe technique. The current direction was reversed for measuring each point in order to remove the contacting thermal power.
III.1 X-ray diffraction
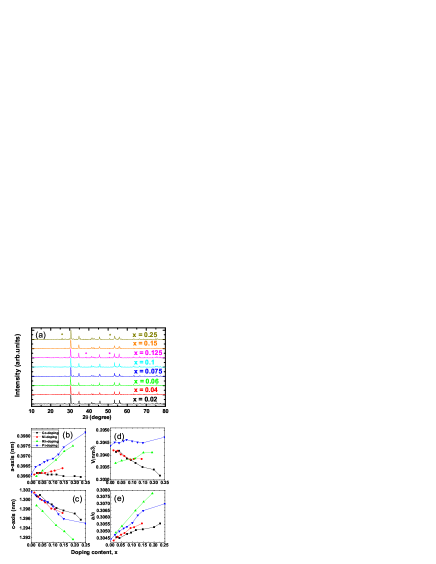
In order to have a comprehensive understanding to the evolution induced by the doping effect, we have measured the X-ray diffraction patterns for BaFe2-xPtxAs2 with x from 0 to 0.25. The lattice constants along a-axis and c-axis are thus obtained. In Fig.1 (a), we present the x-ray diffraction patterns of BaFe2-xPtxAs2. It is clear that all main peaks of the samples can be indexed to the ThCr2Si2 structure. The peaks marked with asterisks arise from the impurity phase PtAs2. As we can see, only the samples with high doping levels have the impurity phase PtAs2. By fitting the XRD data to the structure with the software Powder-X,DongC we get the lattice constants of BaFe2-xPtxAs2. In Fig.1 (b)-(c), we show a- and c-axes lattice parameters for the BaFe2-xPtxAs2 samples. One can see that, by substituting Pt into Fe-sites, the lattice constant expands, while shrinks. This tendency is similar to the case of doping the Fe-sites with Ni, Rh, Ir or Ru.Ru ; hanfei ; NiN2 For Ni and Co doping, the variation of a-axis lattice constant seems weaker, but the c-axis lattice constant drops significantly. Normally a larger a-axis and smaller c-axis lattice constant would mean that the bond angle of As-Fe-As is getting larger. Therefore the parameter (a/c)/(a0/c0) (a0 and c0 are the lattice constants for the parent phase) should tell us some information the doping induced change of bond angle and superconductivity. In Fig.1(d)-(e) we present the doping dependence of the unit cell volume and the ratio a/c versus doping content . Here we compared (a/c)/(a0/c0) with other dopants in Fig.1(e).NiN2 ; Canfield The optimal doping for Pt was found at about 0.1, with (a/c)/(a0/c0) of about 1.005, while it is also near 1.005 for Rh and Pd-doped samples at optimal doping NiN2 . However (a/c)/(a0/c0) for Co and Ni-doped samples at optimal doping is much smaller than Pt-doped samples.Canfield Regarding the relatively similar Tc values in all these systems, it is tempting to conclude that the value of (a/c)/(a0/c0) is not a decisive parameter to govern the superconductivity.
III.2 Doping dependence of resistivity
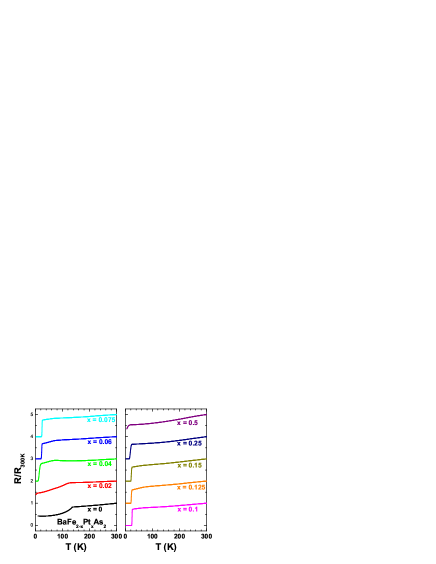
In Fig.2, we show the temperature dependence of resistivity for BaFe2-xPtxAs2 samples under zero field in the temperature region up to 300 K. The resistivity anomaly Tan is determined as the point deviating from the linear part at high temperatures. As we can see, the parent phase BaFe2As2 exhibits a sharp drop of resistivity (resistivity anomaly) at about 140 K, which associates with the formation of the antiferromagnetic order and structural transition. By doping more Pt, the resistivity drop was converted to an uprising. We found that the superconductivity appears in the sample with nominal composition of x = 0.02, which may be induced by a small amount of superconducting phase, suggesting slight inhomogeneity in the sample. At this doping level, the resistivity anomaly Tan is about 128 K, being rather consistent with the structure transition temperature (as shown in Fig.3). As the doping level was raised to 0.04, the resistivity anomaly Tan moves to 108 K, which is also consistent with the structure transition temperature. In the sample with x = 0.1, we get a maximum transition temperature Tc of about 25 K, which is determined by a standard method, i.e., using the crossing point of the normal state background and the extrapolation of the transition part with the most steep slope (as shown by the dashed lines in Fig.5). The transition width determined here with the criterion of 10-90 ( means the normal state resistivity at the onset transition point) is about 1.87 K. According to Saha et al.J. Paglione , the superconducting transition temperature Tc on the single crystal with x = 0.1 is about 23 K, while the transition width is about 1.5 K. Comparing with our data on the polycrystalline sample with x = 0.1, the superconducting transition temperature Tc of our sample is a little higher than theirs, which may be caused by the slight difference of the doping level. Meanwhile, the superconducting resistive transition width in our samples is a little bigger than theirs, which may be caused by the grain boundaries of polycrystalline samples. However, our data on the polycrystalline sample in regard to the superconducting transition behavior is very close to the data on the single crystal sample.
As mentioned above, there is an impurity phase PtAs2 in some samples, so it’s necessary to discuss how the impurity phase might affect the resistive properties of the material. According to the X-ray diffraction data, in the low-doped samples, there’s no impurity phase PtAs2, therefore here we discuss only the highly doped samples. In these samples, the impurity scattering caused by PtAs2 may lead to the increase of impurity scattering rate. However, as we argue below, the sizable impurity scattering effect in these samples are not induced by the slight amount of PtAs2, but by the intrinsic impurity scattering induced by the dopants at the Fe-sites. In Fig.2 we show the normalized resistance data. Here, we take the sample BaFe1.9Pt0.1As2 as an example to illustrate our point. For this sample, the residual resistance ratio RRR ( (300K)/(30K)) is about 1.35. This value is very small manifesting a bad metallic behavior and a strong impurity scattering. However, as evidenced by the X-ray diffraction data, our sample in this doping is quite clean, which would not lead to such a strong impurity scattering. Actually, even in the single crystal samples with the doping to the Fe-sites, RRR is also quite small. For example, in the single crystals of BaFe2-xMxAs2(M = Pt, Pd, Rh)NiN2 ; J. Paglione , RRR is just around 2. For the single crystals with Ni and Co doping,Canfield ; LFang the RRR can at most rises up to 3, which is much below the value of the (Sr,Ba)1-xKxFe2As2 which can go up to about 8-10 in very clean samples.Luohq The very large RRR value is expectable in the samples when the out of plane sites, here such as the Ba/Sr atoms, are doped with K. So a small RRR in the samples with doping to the Fe-sites may be a common phenomenon in this system, indicating an intrinsic strong impurity scattering effect. It is surprising that the superconductivity can still survive up to about 25 K even with such a strong impurity scattering effect. This result challenges the theoretical predictions on the impurity pair breaking effect with the model of the S± pairing manner in the iron pnictide superconductors.
III.3 Synchrotron powder x-ray diffraction
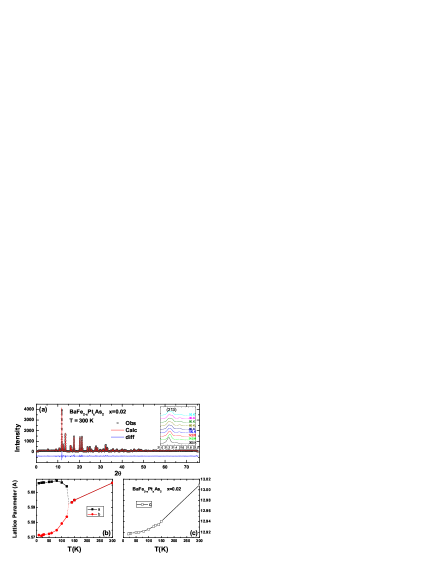
In order to investigate the relationship between the structural phase transition and the resistivity anomaly, synchrotron powder x-ray diffraction (XRD) experiments with the temperature from 10 K to 300 K were performed on the samples BaFe1.98Pt0.02As2, BaFe1.96Pt0.04As2, and BaFe1.9Pt0.1As2. As shown in Fig.3, the refined crystal structure of BaFe1.98Pt0.02As2 at room temperature is in good agreement with ThCr2Si2 structure. As the temperature decreases, the lattice constants and shrink a bit. The inset of Fig.3.(a) shows the (213) Bragg reflection peak as a function of temperature. The splitting of that peak indicates that the sample undergoes a tetragonal to orthorhombic distortion. The space group symmetry changes from tetragonal (I4=mmm) to orthorhombic (Fmmm) at about 125 K. As mentioned above, the resistivity anomaly Tan of BaFe1.98Pt0.02As2 is about 128 K, which is very close to that determined from the synchrotron data. So the resistivity anomaly Tan is rather consistent with structural transition temperature at the doping level x = 0.02. At the doping level x = 0.04, Tan is about 108 K, while the structural transition occurs between 100 K and 120 K (not shown here). At the doping level x = 0.1, no structural transition was found in the synchrotron experiment at all temperatures.
III.4 The electronic phase diagram
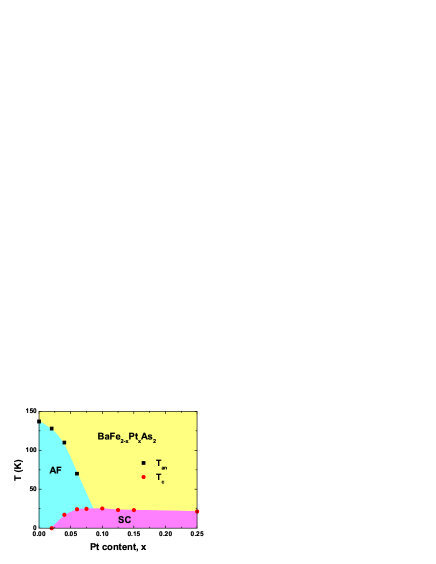
Based on the measurements described above, a phase diagram of BaFe2-xPtxAs2 within the doping range of x from 0 to 0.25 was given in Fig.4. The Tan was defined as the temperatures of the anomaly in resistivity, and Tc was determined from the onset of superconducting resistive transition. As we can see, with increasing Pt content, the temperature of the resistivity anomaly which corresponds to the tetragonal-orthorhombic structural / antiferromagnetic transition is driven down, and the superconductivity emerges at x = 0.02, reaching a maximum Tc of 25 K at x = 0.1. This general phase diagram looks very similar to that with Ni and Pd doping.XuZA ; Canfield Since Pt locates just below Ni and Pd in the periodic table of elements, we would conclude that the superconductivity induced by Pt doping shares the similarity as that of Ni doping.
One of the interesting point here is that, the superconductivity transition at about 23 K was observed even up to the doping level of x = 0.25, making the superconducting phase region extremely asymmetric. This can be naturally understood as the slow degradation of the AF spin fluctuations in the overdoped region if assuming that the paring is through exchanging the AF spin fluctuations. As indicated in our previous work in the Co-doped Ba-122 single crystals,LFang the superconducting ”dome” is not symmetric at all in the iron pnictide superconductors. In the underdoped region, the superconducting transition temperature ramps quickly up to the maximum value since the superconducting phase wins more and more density of states from the AF order. It is these quasiparticles that pair via exchanging the residual AF spin fluctuation and form the superconducting condensate. While, in the overdoped region, the whole Fermi surfaces will involve in the superconducting pairing, but now the pairing strength which is governed by the AF spin fluctuation becomes weaker and weaker. The extended superconducting transition at such a high doping level may also be partly attributed to the percolative superconductivity. The doping may have an upper solubility limit. Above this doping level, the system will chemically phase-separate into two different regions, one with superconductivity at almost the optimized Tc, while the others are the impurity phases, such as PtAs2. Further experiments on single crystals may decide whether this long-tail like over doped region is an intrinsic feature for the Pt doped samples.
III.5 Upper critical field
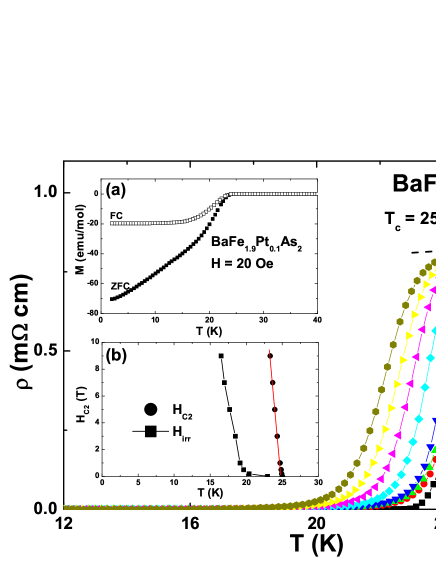
In Fig.5, we present the temperature dependence of resistivity under different magnetic fields for the sample with x = 0.1. As shown in the inset(a) of Fig.5, just as many other iron pnictide superconductors, the diamagnetic signal is very strong. However, from the zero-field-cooling M(T) curve one can also see that the low temperature part is not flat. This strong temperature dependence was not seen in the field-cooling M(T) data. We explain this strong temperature dependent ZFC M(T) curve as due to the decaying of the Meissner screening current, which is induced by the easy motion the of magnetic flux (even not the superconducting quantized flux lines) through the weak-links at the grain boundaries. This happens quite often in the polycrystalline samples. We thus used the criterion of to determine the upper critical field and show the data in the inset(b) of Fig.5. A slope of -dHc2/dT = 5.4 T/K can be obtained here. This is a rather large value which indicates a rather high upper critical field in this system. By using the Werthamer-Helfand-Hohenberg (WHH) formulaWHH for a single band system , the value of zero temperature upper critical field can be estimated. Taking K, we can get roughly. This is a very large upper critical field, just as in K-dopedWangZSPRB and Co-doped samplesJo . However, the high upper critical field is just an estimate of the data based on the single band model with the assumption that the upper critical field is determined by the orbital pair breaking effect. In the case of multi-band superconductivity and paramagnetic limit for the upper critical field, the value of H will differ from the value predicted by the WHH theory. Therefore an accurate determination of H needs to measure the resistive transitions directly under high magnetic fields. While the high value of -dHc2/dT at Tc at least indicates a rather strong pairing strength with a rather high quasiparticle density of states.
A very interesting point uncovered by our experiment is that the maximum Tc by doping Pt in BaFe2As2 is 25 K, which is close to that by doping Ni, Co and Ir at the Fe sites. Manifold interests can be raised here. (1) Although the ionic sizes are rather different among them, while the maximum Tc is not influenced by them, which may indicate that the non-magnetic centers paly a trivial role in the pair breaking effect. (2) Although the mass of the 5d element Pt is much heavier than the mass of the 3d elements, such as Ni, again the maximum Tc is the same by doping them to the Fe sites, which trivializes the importance of phonon mediated mechanism in the occurrence of superconductivity. (3) Normally the 5d transition elements have much wider band and stronger spin orbital coupling effect, while the similar maximum Tc may suggest that the electron itineracy as well as the spin-orbital coupling are not the determining factors for the occurrence of superconductivity. Our results here shed new lights in the understanding of the mechanism of superconductivity in the iron pnictide superconductors.
IV Conclusions
In summary, superconductivity has been found in BaFe2-xPtxAs2 with the maximum Tc = 25 K. The phase diagram obtained here is quite similar to that by doping Co, Ni, Rh and Ir to the Fe sites. The resistivity anomaly temperature Tan is rather consistent with that of the structure transition. It is found that all samples with doping to the Fe sites showed an very small RRR (below 3), which is much smaller than the value (up to 10) with the out-off plane dopants, like K-doped (Ba,Sr)-122. This indicates the doping at Fe-sites naturally leads to a strong intrinsic impurity scattering. While surprisingly, superconductivity can still survive up to about 25 K, even with such a strong impurity scattering effect. The superconductivity is rather robust against the magnetic field with a slope of -dHc2/dT = 5.4 T/K near Tc at the doping level x = 0.1. Our results clearly indicate that the superconductivity can also be easily induced in BaFe2As2 by replacing Fe with Pt. This discovery may trivialize the phonon effect, electron itinerancy, and the spin-orbital coupling in the occurrence of superconductivity.
Note added: When preparing this manuscript, we became aware that J. Paglione et al posted a paper concerning the superconductivity in Pt-doped BaFe2As2.J. Paglione Their results are consistent with ours although they report the result for only one doping level.
This work was supported by the Natural Science Foundation of China, the Ministry of Science and Technology of China (973 Projects No.2006CB601000, No. 2006CB921802), and Chinese Academy of Sciences (Project ITSNEM).
References
- (1) Y. Kamihara, T. Watanabe, M. Hirano, and H. Hosono, J. Am. Chem. Soc. 130, 3296 (2008).
- (2) X. Zhu, F. Han, P. Cheng, G. Mu, B. Shen, and H. H. Wen, EPL 85, 17011 (2009).
- (3) M. Tegel, S. Johansson, V. Weiss, I. Schellenberg, W. Hermes, R. Poettgen, and Dirk Johrendt, EPL 84, 67007 (2008).
- (4) M. Rotter, M. Tegel, and D. Johrendt, Phys. Rev. Lett. 101, 107006 (2008).
- (5) K. Sasmal, B. Lv, B. Lorenz, A. Guloy, F. Chen, Y. Xue, and C. W. Chu, Phys. Rev. Lett. 101, 107007 (2008).
- (6) X. C. Wang, Q. Q. Liu, Y. X. Lv, W. B. Gao, L. X. Yang, R. C. Yu, F. Y. Li, and C. Q. Jin, Solid State Communications. 148, 538 (2008).
- (7) D. R. Parker, M. J. Pitcher, P. J. Baker, I. Franke, T. Lancaster, S. J. Blundell, and S. J. Clarke, Chemical Communic., 2189 (2009).
- (8) Fong-Chi Hsu, Jiu-Yong Luo, Kuo-Wei Yeh, Ta-Kun Chen, Tzu-Wen Huang, Phillip M. Wu, Yong-Chi Lee, Yi-Lin Huang, Yan-Yi Chu, Der-Chung Yan, and Maw-Kuen Wu, Proc. Natl. Acad. Sci. 105, 14262-4 (2008).
- (9) X. Zhu, F. Han, G. Mu, P. Cheng, B. Shen, B. Zeng, and H. H. Wen, Phys. Rev. B 79, 024516 (2009).
- (10) H. Ogino, Y. Matsumura, Y. Katsura, K. Ushiyama, S. Horii, KohjiKishio and J. Shimoyama, Supercond. Sci. Technol. 22, 075008 (2009).
- (11) X. Zhu, F. Han, G. Mu, P. Cheng, B. Shen, B. Zeng, and H. H. Wen, Phys. Rev. B 79, 220512(R) (2009).
- (12) N. Ni, M. E. Tillman, J.-Q. Yan, A. Kracher, S. T. Hannahs, S. L. Bud ko, and P. C. Canfield, Phys. Rev. B 78, 214515 (2008).
- (13) H. Luo, Z. Wang, H. Yang, P. Cheng, X. Zhu, H. H. Wen, Supercond. Sci. Technol. 21, 125014 (2008).
- (14) A. S. Sefat, R. Jin, M. A. McGuire, B. C. Sales, D. J. Singh, and D. Mandrus, Phys. Rev. Lett. 101, 117004 (2008).
- (15) Y. K. Li, X. Lin, Z. W. Zhu, H. Chen, C. Wang, L. J. Li, Y. K. Luo, M. He, Q. Tao, H. Y. Li, G. H. Cao, Z. A. Xu, Phys. Rev. B 79, 054521 (2009).
- (16) L. J. Li, Q. B. Wang, Y. K. Luo, H. Chen, Q. Tao, Y. K. Li, X. Lin, M. He, Z. W. Zhu, G. H. Cao, and Z. A. Xu, arXiv:cond-mat/0809.2009 (2008).
- (17) S. Paulraj, S. Sharma, A. Bharathi, A. T. Satya, S. Chandra, Y. Hariharan, and C. S. Sundar, arXiv:cond-mat/0902.2728 (2009).
- (18) F. Han, X. Zhu, P. Cheng, G. Mu, Y. Jia, L. Fang, Y. Wang, H. Luo, B. Zeng, B. Shen, L. Shan, C. Ren, and H. H. Wen, Phys. Rev. B 80, 024506 (2009).
- (19) N. Ni, A. Thaler, A. Kracher, J. Q. Yan, S. L. Bud ko, and P. C. Canfield, Phys. Rev. B 80, 024511 (2009).
- (20) A. C. Larson, R. B. Von Dreele, General Structure Analysis System (GSAS), Los Alamos National Laboratory Report LAUR 86-748, 2000.
- (21) C. Dong, J. Appl. Cryst. 32, 838 (1999).
- (22) P. C. Canfield, S. L. Bud ko, Ni Ni, J. Q. Yan, and A. Kracher, Phys. Rev. B 80, 060501(R)(2009).
- (23) S. R. Saha, T. Drye, K. Kirshenbaum, N. P. Butch, and J. Paglione , J. Phys.: Condens. Matter 22, 072204 (2010).
- (24) L. Fang, H. Luo, P. Cheng, Z. S. Wang, Y. Jia, G. Mu, B. Shen, I. I. Mazin, L. Shan, C. Ren, and H. H.-H. Wen, Phys. Rev. B 80, 140508(R)(2009).
- (25) N. R. Werthamer, E. Helfand, P. C. Hohenberg, Phys. Rev. 147, 295 (1966).
- (26) Z. S. Wang, H. Q. Luo, C. Ren, H. H. Wen, Phys. Rev. B 78, 140501(R) (2008).
- (27) Y. J. Jo, J. Jaroszynski, A. Yamamoto, A. Gurevich, S. C. Riggs, G. S. Boebinger, D. Larbalastier, H. H. Wen, N. D. Zhigadlo, S. Katrych, Z. Bukowski, J. Karpinski, R. H. Liu, H. Chen, X. H. Chen, L. Balicas, Physica C 469, 566 (2009).